
Bitcoin
Navigating Bitcoin In September: Analyst Outlines Two Likely Scenarios

The Bitcoin price trajectory in September appears to be at a critical juncture, and it carries the potential to unfold in two very different directions. After closing August on a bearish note, the leading cryptocurrency has continued to exhibit signs of weakness after September began. The early days of the month have already seen Bitcoin edging further into bearish territory, a development that could potentially signal a prolonged period of capitulation throughout the rest of the month. However, keeping in mind this is BTC we’re talking about, and we’re only three days into September, we could see the crypto bounce back up sometime in the middle of the month.
Adding to this speculation, a well-known crypto analyst who goes by the pseudonym Titan of Crypto (@Washigorira) on social media, recently shared his thoughts on the possible outcomes for Bitcoin this month.
Bitcoin Trajectory In September
According to his analysis, there are two primary scenarios that could play out for Bitcoin in September. The first scenario envisions a rally that defies the prevailing bearish expectations and will surprise the market with an unexpected surge. The second scenario, however, involves a final phase of capitulation, where Bitcoin could reach new lows before staging a significant recovery in the final quarter of 2024.
This analysis focuses on the Bitcoin/US Dollar (BTC/USD) chart observed on a weekly timeframe. According to the chart’s current setup by @Washigorira, BTC has been tracing a price pattern that closely resembles a bullish expanding triangle since reaching its all-time high of $73,737 in March 2024. This particular pattern is widely recognized for its bullish signals. Despite the current short-term volatility, the longer-term outlook for Bitcoin remains positive. As such, both scenarios noted by the analyst eventually end up with a bullish surge for Bitcoin.
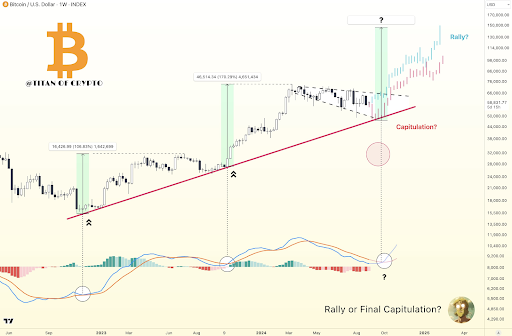
In the first scenario, Bitcoin is expected to initiate a significant price surge in September. This surge would be strong enough to push the cryptocurrency above the upper trendline of the bullish expanding triangle that has served as a strong resistance level for months. If BTC successfully breaks through this resistance, the price could potentially achieve a complete breakout and set the stage for a new all-time high.
Related Reading: Crypto Analyst Predicts Shiba Inu Will Surge 1,000% To $0.00014
In terms of price target for this scenario, a complete breakout will see BTC reaching as high as $150,000 in Q1 2025. Interestingly, this mirrors the bullish rally experienced in Q4 2023, which ultimately ended with the latest all-time high in Q1 2024.
The second scenario presents a more cautious outlook, where Bitcoin continues to experience the current capitulation phase. This scenario envisions Bitcoin dipping further in September, potentially breaking below the $50,000 mark. Such a decline could see BTC retesting its August low of $49,800, which is a critical support level.
However, this scenario does not end on a bearish note. Following this potential dip, Bitcoin is expected to reverse its downward trend in the fourth quarter of 2024. This would then lead to a bullish rally with a slightly more conservative price target of $100,000.
At the time of writing, Bitcoin is trading at $56,716.
Featured image created with Dall.E, chart from Tradingview.com


Bitcoin may be a useful hedge against inflation in the near future as market uncertainty is growing. In the long run, it may also be useful to envision Bitcoin differently, treating it as a barometer for the tech industry.
Standard Chartered’s Head of Digital Assets Research and WeFi’s Head of Growth both shared exclusive comments with BeInCrypto regarding this topic.
Bitcoin: Inflation Hedge or Magnificent 7 Candidate?
Since the early days of the crypto space, investors have been using it as a hedge against inflation. However, it’s only recently that institutional investors are beginning to treat it the same way. According to Geoff Kendrick, Head of Digital Assets Research at Standard Chartered, the trend of Bitcoin as an inflation hedge is increasing.
Still, this view may be too narrow in a few ways. Since the Bitcoin ETFs were first approved, BTC has been increasingly well-integrated with traditional finance. Kendrick noted this, saying that it is highly correlated with the NASDAQ in the short term. He claimed that Bitcoin might represent more than an inflation hedge, instead serving as an ersatz tech stock:
“BTC may be better viewed as a tech stock than as a hedge against TradFi issues. If we create a hypothetical index where we add BTC to the ‘Magnificent 7’ tech stocks, and remove Tesla, We find that our index, ‘Mag 7B’, has both higher returns and lower volatility than Mag 7,” Kendrick said in an exclusive interview with BeInCrypto.
This comparison is particularly apt for a few reasons. Tesla’s stock price is heavily entangled with Bitcoin, but it’s also been dropping due to political controversies. If Bitcoin were to replace Tesla’s position in the Magnificent 7, it may be a welcome addition. Of course, there is currently no mechanism to cleanly treat Bitcoin as a similar type of product. That could change.
However, Bitcoin’s role as an inflation hedge might be more immediately relevant. As Trump’s Liberation Day approaches, the crypto markets are becoming increasingly nervous about new US tariffs. As Agne Linge, Head of Growth at WeFi, said in an exclusive interview, these fears are impacting all risk-on assets, Bitcoin included.
“Crypto markets are closely tracking investor sentiment ahead of Trump’s…tariff announcement, with growing concerns over the potential economic impact. Bitcoin’s increasing correlation with traditional markets has amplified its exposure to broader macroeconomic trends, making it more sensitive to the risk-off sentiment that has affected equity markets,” Linge claimed.
She went on to state that US economic uncertainty was at record levels, surpassing both the 2008 financial crisis and the pandemic in April 2020. In these circumstances, recent inflation indicators are showing expected rates above expectations.
In such an environment, the crypto market is sure to take a hit, but traditional finance and the dollar is also in great jeopardy. All that is to say, Bitcoin is likely to be a solid inflation hedge in the near future. Even if it falls dramatically, it has worldwide appeal and the ability to rebound.
Disclaimer
In adherence to the Trust Project guidelines, BeInCrypto is committed to unbiased, transparent reporting. This news article aims to provide accurate, timely information. However, readers are advised to verify facts independently and consult with a professional before making any decisions based on this content. Please note that our Terms and Conditions, Privacy Policy, and Disclaimers have been updated.


Michael Saylor, one of the most outspoken supporters of Bitcoin, is back and bolder than ever. In a recent statement, the former MicroStrategy CEO predicted that the alpha coin will potentially hit a $500 trillion market cap. Saylor’s bold prediction for the world’s top digital asset comes during the intensified push for a Strategic Bitcoin Reserve (SBR).
In his latest pro-crypto statement, Saylor argued that the digital asset will “demonetize gold”, then it will demonetize real estate, which he calculated as 10x more than gold. To summarize his argument, Saylor further states that Bitcoin will demonetize “all long-term store of value”.
Push For SBR Gains Ground
Saylor’s latest statement comes as Congress intensifies its efforts to build the country’s BTC holdings. United States President Donald Trump formalized the plans to build crypto holdings through an executive order to establish a strategic crypto reserve that will initially include $17 billion worth of BTC that the country currently controls.
Michael Saylor: Bitcoin Headed to $500 Trillion 🚀₿
– At Digital Asset Summit, MicroStrategy’s Saylor predicted:
• BTC will reach $500T market cap
• It will “demonetize gold, real estate & all long-term stores of value”
– Capital shift: “From physical to digital, from…— AFV GLOBAL (@afvglobal) March 28, 2025
According to the president, additional acquisitions of cryptocurrency are allowed, provided these are done through “budget-neutral” approaches. Senator Cynthia Lummis initially proposed in the Senate, through the Bitcoin Act, the plan to create a Bitcoin reserve. Under the proposal, the administration can purchase 1 million Bitcoin to complement the reserve.
Saylor Explains Crypto’s Role During Blockchain Summit
Saylor’s latest prediction on Bitcoin was made during his appearance at the DC Blockchain Summit. He was joined on stage by Jason Les, the CEO of Rito Platforms, and Lummis, the principal author of the Bitcoin Act.
During the program, Saylor was asked about America’s need for Bitcoin. Saylor answered with conviction, saying the rising importance of BTC is inevitable and will happen with the US’ participation. During his talk, he shared that Bitcoin, created by the enigmatic Satoshi Nakamoto, is unstoppable.
Image: Gemini Imagen
Saylor added that the premier digital asset is the next stage in money’s evolution, and it’s currently absorbing value from traditional assets like currency reserves and real estate.
Saylor Predicts Top Coin Will Reach $500 Trillion In Market Cap
During his talk, Saylor predicted that BTC will eventually grow from $2 billion to $20 billion, which can hit $200 billion and beyond. Finally, he thinks the asset can achieve a $500 trillion market capitalization, reflecting more than 29,000% increase from its current market capitalization of $1.67 trillion.
Saylor’s recent bold prediction aligns with his firm conviction and support for the asset. He argues that Bitcoin’s unique features, its decentralized nature and fixed supply, make it a perfect hedge against economic uncertainties like inflation.
Featured image from Gemini Imagen, chart from TradingView
Editorial Process for bitcoinist is centered on delivering thoroughly researched, accurate, and unbiased content. We uphold strict sourcing standards, and each page undergoes diligent review by our team of top technology experts and seasoned editors. This process ensures the integrity, relevance, and value of our content for our readers.
A top executive of Strategy, formerly MicroStrategy, posted a cryptic post on X, fueling speculation that the company might be positioning itself to make another Bitcoin acquisition soon.
Strategy Executive Chairman Michael Saylor suggested in an X post that the company would purchase additional Bitcoins to boost its current BTC holding of $42 billion.
Saylor To Buy More Bitcoin
In a typical Saylor fashion, the Strategy top honcho disclosed the company’s BTC investment portfolio tracker, an indicator that the company is planning an upcoming Bitcoin acquisition.
Needs even more Orange. pic.twitter.com/lV5qgUP6oY
— Michael Saylor⚡️ (@saylor) March 30, 2025
“Needs even more Orange,” Saylor said in the post, referring to the orange circles in the graph (below), which represents the company’s Bitcoin purchases since September 2020.
Once again, Saylor’s post intrigued the crypto community because many believe the graph conveys a message that Strategy will buy more BTC soon.

Strategy Stockpile: Over $40B BTC
According to Saylor, Strategy’s Bitcoin holding now stands at more than $42 billion. Despite the company’s already huge investment in BTC, it seems the company will continue to increase its holdings, believing in the value of crypto.
Strategy has made great strides in building its BTC reserve from its initial Bitcoin purchase of 21,454 coins worth $250 million in August 2020.
On March 17, the company announced its latest acquisition of 130 Bitcoins for about $10.7 million in cash, with an average price of around $82,981 per coin.
Meanwhile, Onchain Lens reported on Sunday that Strategy moved a considerable number of its coins to new addresses.
“Strategy (formerly MicroStrategy) transferred 7,383.25 $BTC worth $612.92M to three new addresses on March 30,” Onchain Lens said in a post.
Analysts believe the company is influencing the crypto market to strengthen its position, as its chairman has consistently urged others never to sell their Bitcoin.
Strategy (formerly #MicroStrategy) has transferred 7,383.25 $BTC worth $612.92M into 3 new addresses.https://t.co/8KVn8hYNDL pic.twitter.com/g92HZCvoLp
— Onchain Lens (@OnchainLens) March 30, 2025
Fueling BTC Adoption
Many market observers argued that Saylor’s BTC investment strategy might have driven crypto adoption. Ironically, Saylor was pessimistic about Bitcoin’s future in 2013, predicting that the flagship crypto would fail.
However, in 2020, Saylor became one of Bitcoin’s staunch advocates and has now been preaching the merits of the firstborn crypto, urging companies to acquire Bitcoin.
For example, Visa planned to let its customers spend digital assets directly at 70 million merchants. At the same time, financial institutions such as JPMorgan and Morgan Stanley have begun offering crypto investments to wealthy clients and institutional investors.
Featured image from Times Now, chart from TradingView
Editorial Process for bitcoinist is centered on delivering thoroughly researched, accurate, and unbiased content. We uphold strict sourcing standards, and each page undergoes diligent review by our team of top technology experts and seasoned editors. This process ensures the integrity, relevance, and value of our content for our readers.

Analyst Reveals ‘Worst Case Scenario’ With Head And Shoulders Formation

BeInCrypto US Morning Briefing: Standard Chartered and Bitcoin
SUI Price Stalls After Major $147 Million Token Unlock

Bitcoin Could Serve as Inflation Hedge or Tech Stock, Say Experts

Circle Files for IPO

Solana Faces Resistance While ETH Sees DEX Volume Boost

2.52 Million Altcoins Are Ruining Crypto’s Future

Animoca Brands Valuation Tanks 75% In Two Years, Here’s Why

Crypto exchange BingX hacked for $43 million

Are The Big Players Losing Interest?

Hong Kong’s Securities Association Tips Authorities On Crypto Self-Regulation

Coinbase cbBTC Set to go Live on Solana
2.52 Million Altcoins Are Ruining Crypto’s Future
Animoca Brands Valuation Tanks 75% In Two Years, Here’s Why
Crypto exchange BingX hacked for $43 million
Are The Big Players Losing Interest?
Hong Kong’s Securities Association Tips Authorities On Crypto Self-Regulation
Coinbase cbBTC Set to go Live on Solana
-

 Market17 hours ago
Bitcoin Price Battles Key Hurdles—Is a Breakout Still Possible?
-

 Bitcoin15 hours ago
Big Bitcoin Buy Coming? Saylor Drops a Hint as Strategy Shifts
-

 Market24 hours ago
Top 3 Made in USA Coins to Watch In April
-

 Market22 hours ago
Ethereum Price Faces a Tough Test—Can It Clear the Hurdle?
-

 Bitcoin14 hours ago
$500 Trillion Bitcoin? Saylor’s Bold Prediction Shakes the Market!
-

 Market21 hours ago
Solana (SOL) Holds Steady After Decline—Breakout or More Downside?
-

 Ethereum20 hours ago
$2,300 Emerges As The Most Crucial Resistance
-

 Market20 hours ago
CFTC’s Crypto Market Overhaul Under New Chair Brian Quintenz