
Bitcoin
Bitcoin Whales Remain Determined, $3.96 Billion Worth Of BTC Gobbled Up In 96 Hours

All eyes are on Bitcoin, especially as many traders continue to anticipate a break above the $100,000 mark. This anticipation has cascaded into a spike in activity, especially among Bitcoin whales. Interestingly, Bitcoin whales are making bold statements amidst the anticipation, with on-chain data pointing to an accumulation of over 40,000 BTC in just 96 hours among this holder cohort.
This interesting accumulation coincides with the Bitcoin price reaching a peak of $99,645 in the last 24 hours, adding further momentum to the narrative of a possible historic price milestone.
Examining The Holding Patterns Of Bitcoin Whales
Bitcoin’s recent price dynamics have put the spotlight on Bitcoin whales. Ali Martinez, a well-known cryptocurrency analyst, drew attention to the remarkable activity of Bitcoin whales on social media platform X.
While highlighting Santiment data, Martinez revealed that Bitcoin whales have bought over 40,000 BTC worth approximately $3.96 billion in the past 96 hours. Notably, the Bitcoin whales referred to in this metric by Santiment consist of addresses holding between 100 and 1,000 BTC.

This aggressive accumulation comes at a critical juncture for Bitcoin, with prices flirting near the much-anticipated $100,000 mark. Such whale activity typically reduces the available supply of Bitcoin on the open market, which is expected to keep pushing up the Bitcoin price.
Despite the increase in whale accumulation, on-chain data from Glassnode suggests that long-term holders have upped their profit-taking in tandem. Particularly, over 128,000 BTC has been sold by long-term holders since early October.
However, this long-term holder profit taking has so far been offset by the demand from US Spot Bitcoin ETFs. These ETFs have acted as a counterbalance, absorbing nearly 90% of the Bitcoin sold by long-term holders.

A possible explanation is that long-term holders are exiting their self-custody of Bitcoin and are instead diverting their holdings into Spot Bitcoin ETFs in order to benefit from their regulatory clarity. According to data from SoSoValue, Spot Bitcoin ETFs in the US witnessed consecutive days of inflows throughout last week to bring the total inflow to $3.38 billion, which is the largest weekly inflow since their launch in January 2024.
What’s Next For Bitcoin Price?
Looking ahead, the Bitcoin price is definitely on its way to break above $100,000 in the next few days. However, it remains to be seen what happens after that. Crypto analyst Tony Severino has speculated that the Bitcoin price peak could double within a timeframe of two weeks to two months following the break above $100,000.This prediction is based off of the Bitcoin price performance after it first broke above the $10,000 price level in 2017.
On the other hand, veteran analyst Peter Brandt suggests there could be some sort of selling pressure among bulls once the Bitcoin price breaks above $100,000.
“What I had in mind here is the possibility that bulls will sell their BTC sub $100,00 thinking they will buy a correction that does not come, then turn bearish if Bitcoin goes to $120,000 believing price must come down,” he said.
Nevertheless, the current crypto market landscape is set in place for a continued Bitcoin price increase in the next few weeks and months.
Featured image from DALL-E, chart from TradingView


Bitcoin has produced a range-bound movement recently, with prices oscillating between $83,000 and 86,000. Interestingly, popular crypto analyst Burak Kesmeci has identified the important price levels for any short-term action.
Support At 82,800, Resistance At 92,000 – But Where Is Bitcoin Headed?
In a new post on X, Kesmeci shared an interesting on-chain analysis of the Bitcoin market. Using the short-term investor cost basis, the analyst identified two key price levels that could prove critical to Bitcoin’s next major move.
Firstly, Burak Kesmeci focuses on the average cost prices of new traders over the past 1-4 weeks, which are likely the most reactive to price changes. The realized price for these traders currently stands at $82,800, forming a near-term support that indicates many recent buyers are still in profit and may defend this level as a psychological floor.
Meanwhile, Kesmeci also highlights the $92,000 price level, which marks the average cost basis for BTC holders for 1-3 months. This price point has emerged as an important resistance zone, as investors are likely to exit the market once they break even. Furthermore, the $92,000 price level is also marked by a confluence with various technical indicators.
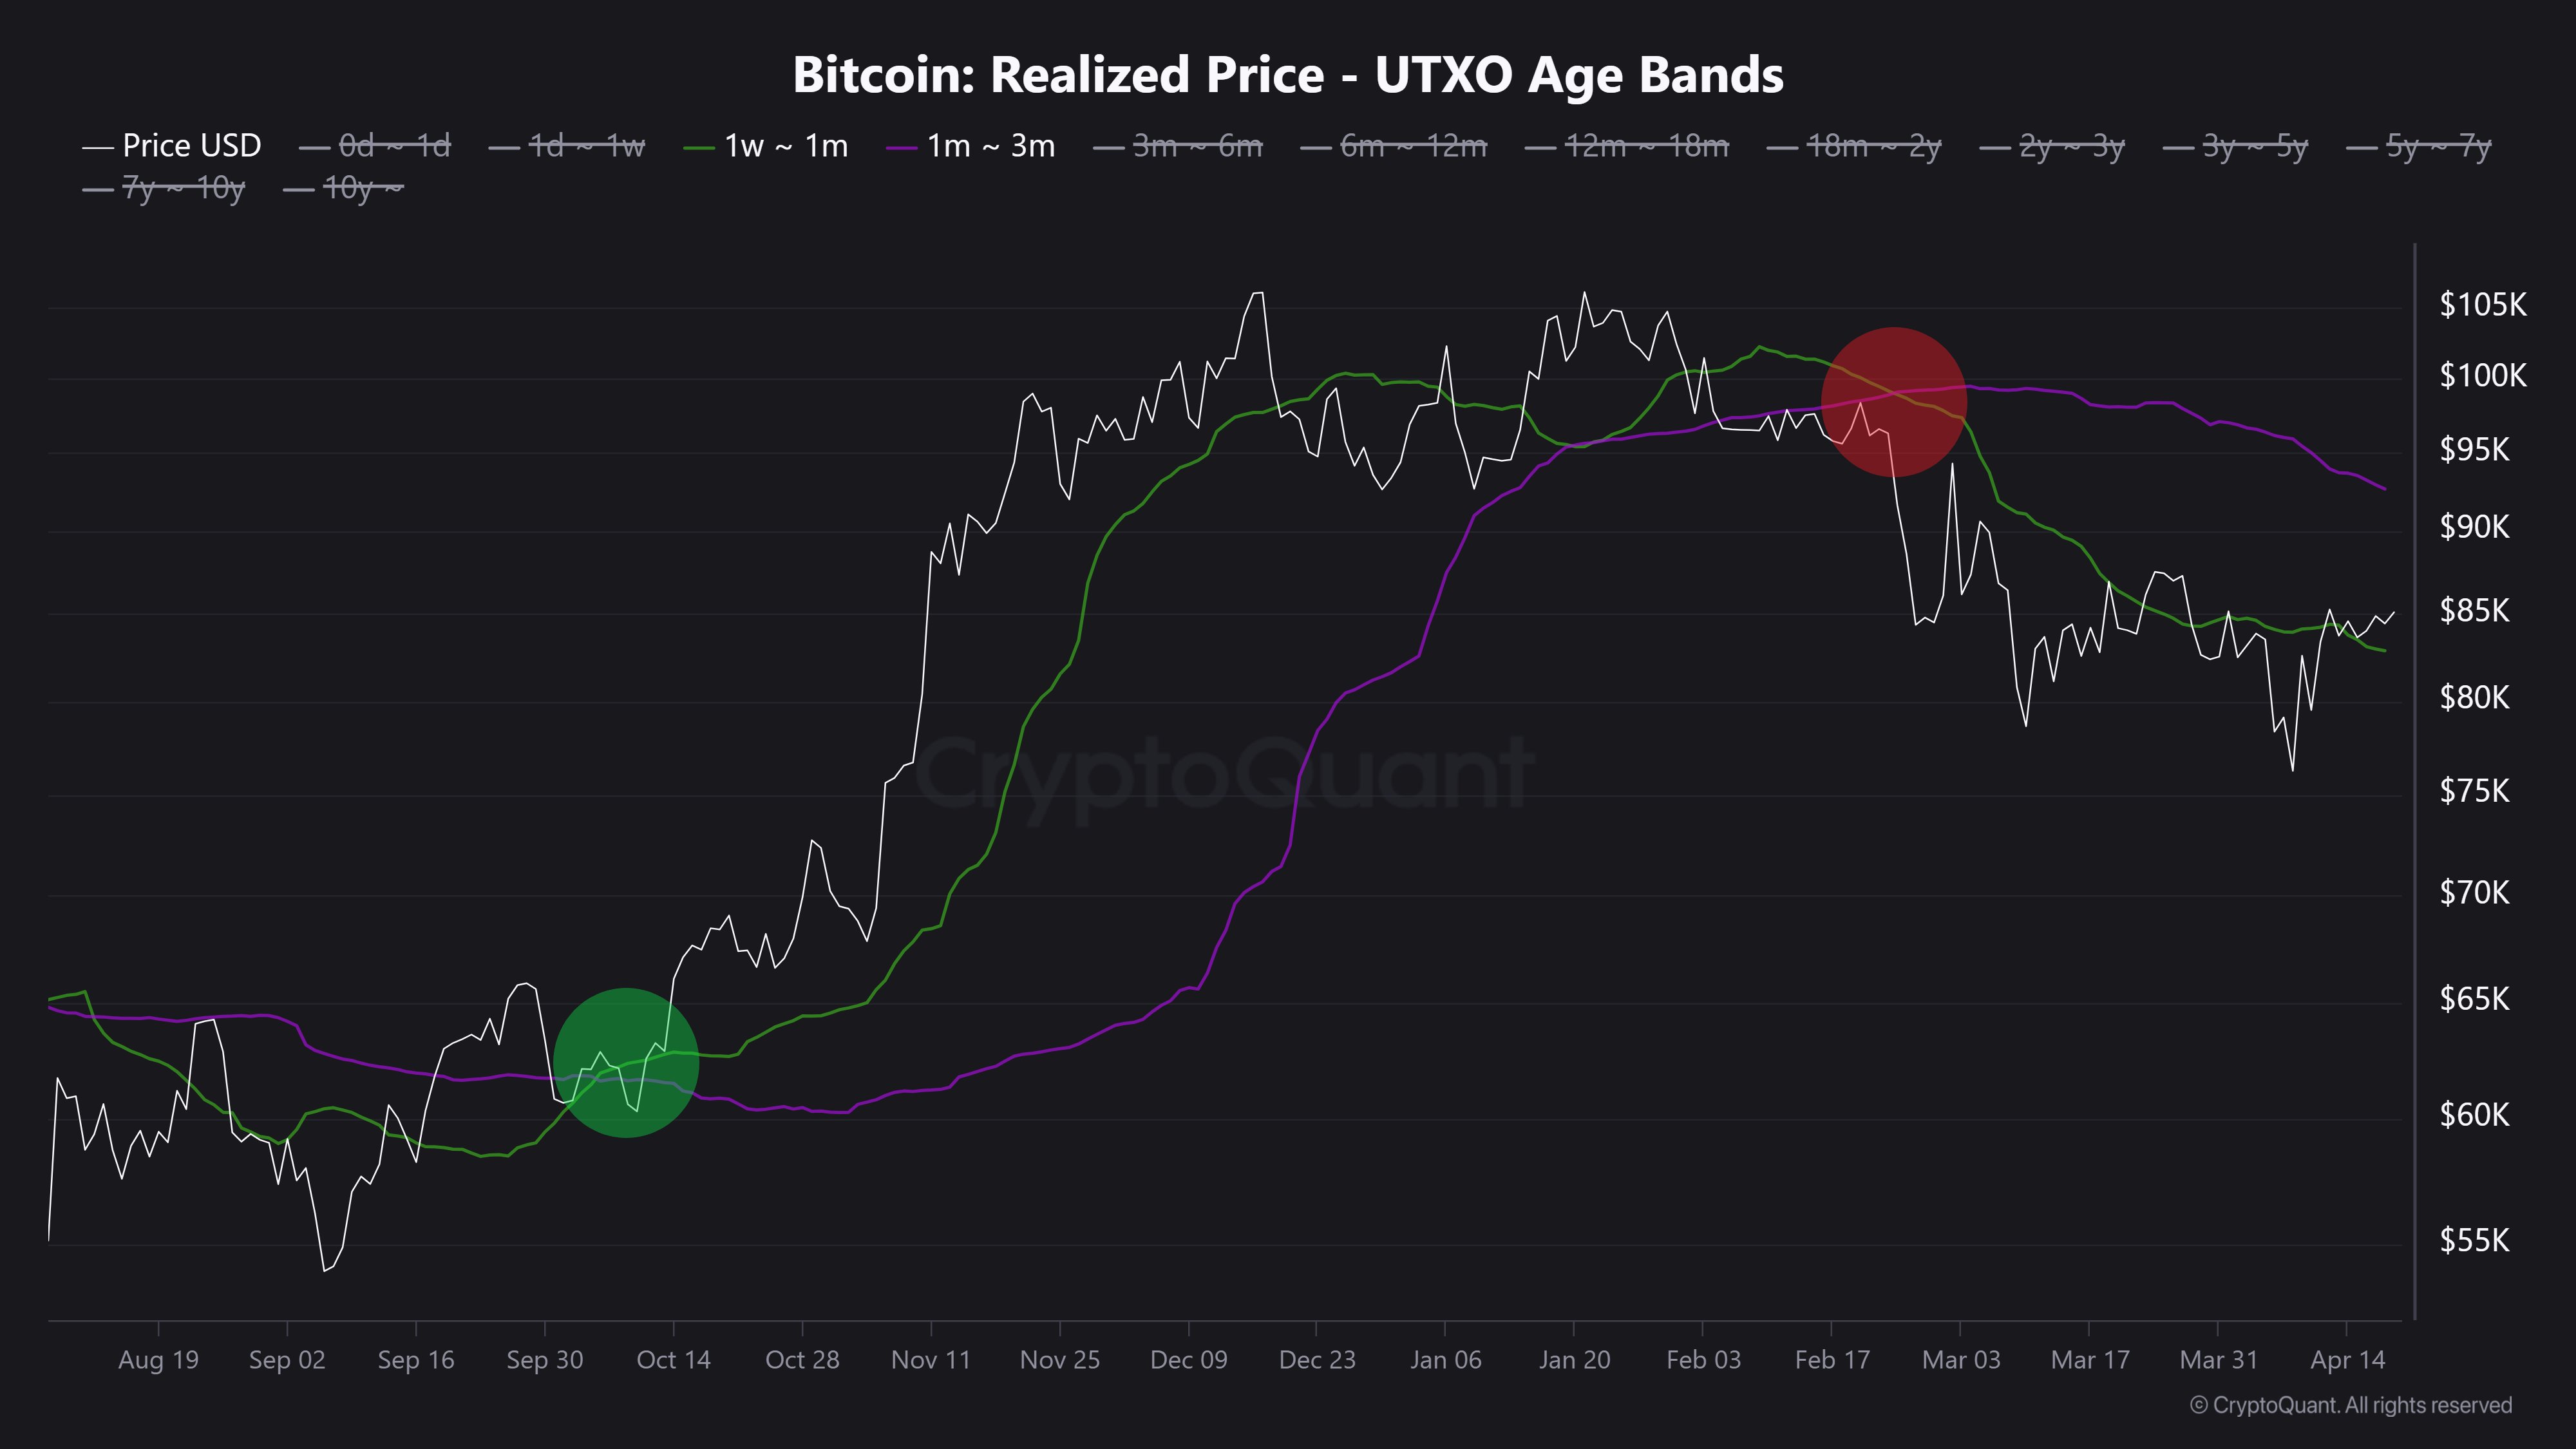
The interplay between these two levels is significant. Historically, short-term bullish trends in BTC tend to begin when the cost basis of more recent investors, 1–4 weeks, crosses above that of the 1–3 BTC holders. This shift signals increased confidence and willingness to buy at higher levels, which often fuels broader rallies.
However, that dynamic remains to play out in the current market. As of now, Bitcoin is trading around 85,000, positioning it above its support at the 1–4 week average of $82,800 but still below the 1–3 month resistance of $92,000. Furthermore, both cost basis levels have been declining over the past two months, reflecting hesitation or a lack of aggressive buying from new entrants.
Notably, Kesmeci states that BTC must surge above $92,000 to confirm a strong bullish momentum for a price reversal.
Bitcoin ETFs Offload 1,725 BTC
In other news, Ali Martinez reports that the Bitcoin ETFs have suffered withdrawals of 1,725 Bitcoin, valued at $146.92 million, over the past week. This development illustrates a high level of negative sentiment among institutional investors, adding to market uncertainty around the BTC market.
Meanwhile, Bitcoin trades at $85,249 following a price change of 0.89% in the past day. The premier cryptocurrency also reflects a 0.58% loss on the weekly chart and a 1.06% gain on a monthly chart.
Feature image from Adobe Stock, chart from Tradingview
Editorial Process for bitcoinist is centered on delivering thoroughly researched, accurate, and unbiased content. We uphold strict sourcing standards, and each page undergoes diligent review by our team of top technology experts and seasoned editors. This process ensures the integrity, relevance, and value of our content for our readers.

Following an extensive price correction in the past three months, the Bitcoin bull market continues to hang in the balance. Despite a modest price rebound in April, the premier cryptocurrency is yet to display a strong intent to resume its bull rally amidst a lack of positive market factors. However, crypto analyst Axel Adler Jr. has highlighted a promising development that could signal major upside potential for Bitcoin.
Bitcoin Long-Term Holders Looking To Halt Selling Pressure
In a recent post on X, Adler Jr. shared an important update in Bitcoin long-term holders (LTH) activity, which could prove significantly positive for the broader BTC market.
Using on-chain data from CryptoQuant, the renowned analyst reports that selling pressure by long-term holders, i.e. amount of LTH holdings on exchanges, has now hit its lowest point at 1.1% over the past year. This development indicates that Bitcoin LTH are now opting to hold on to their assets rather than take profits.
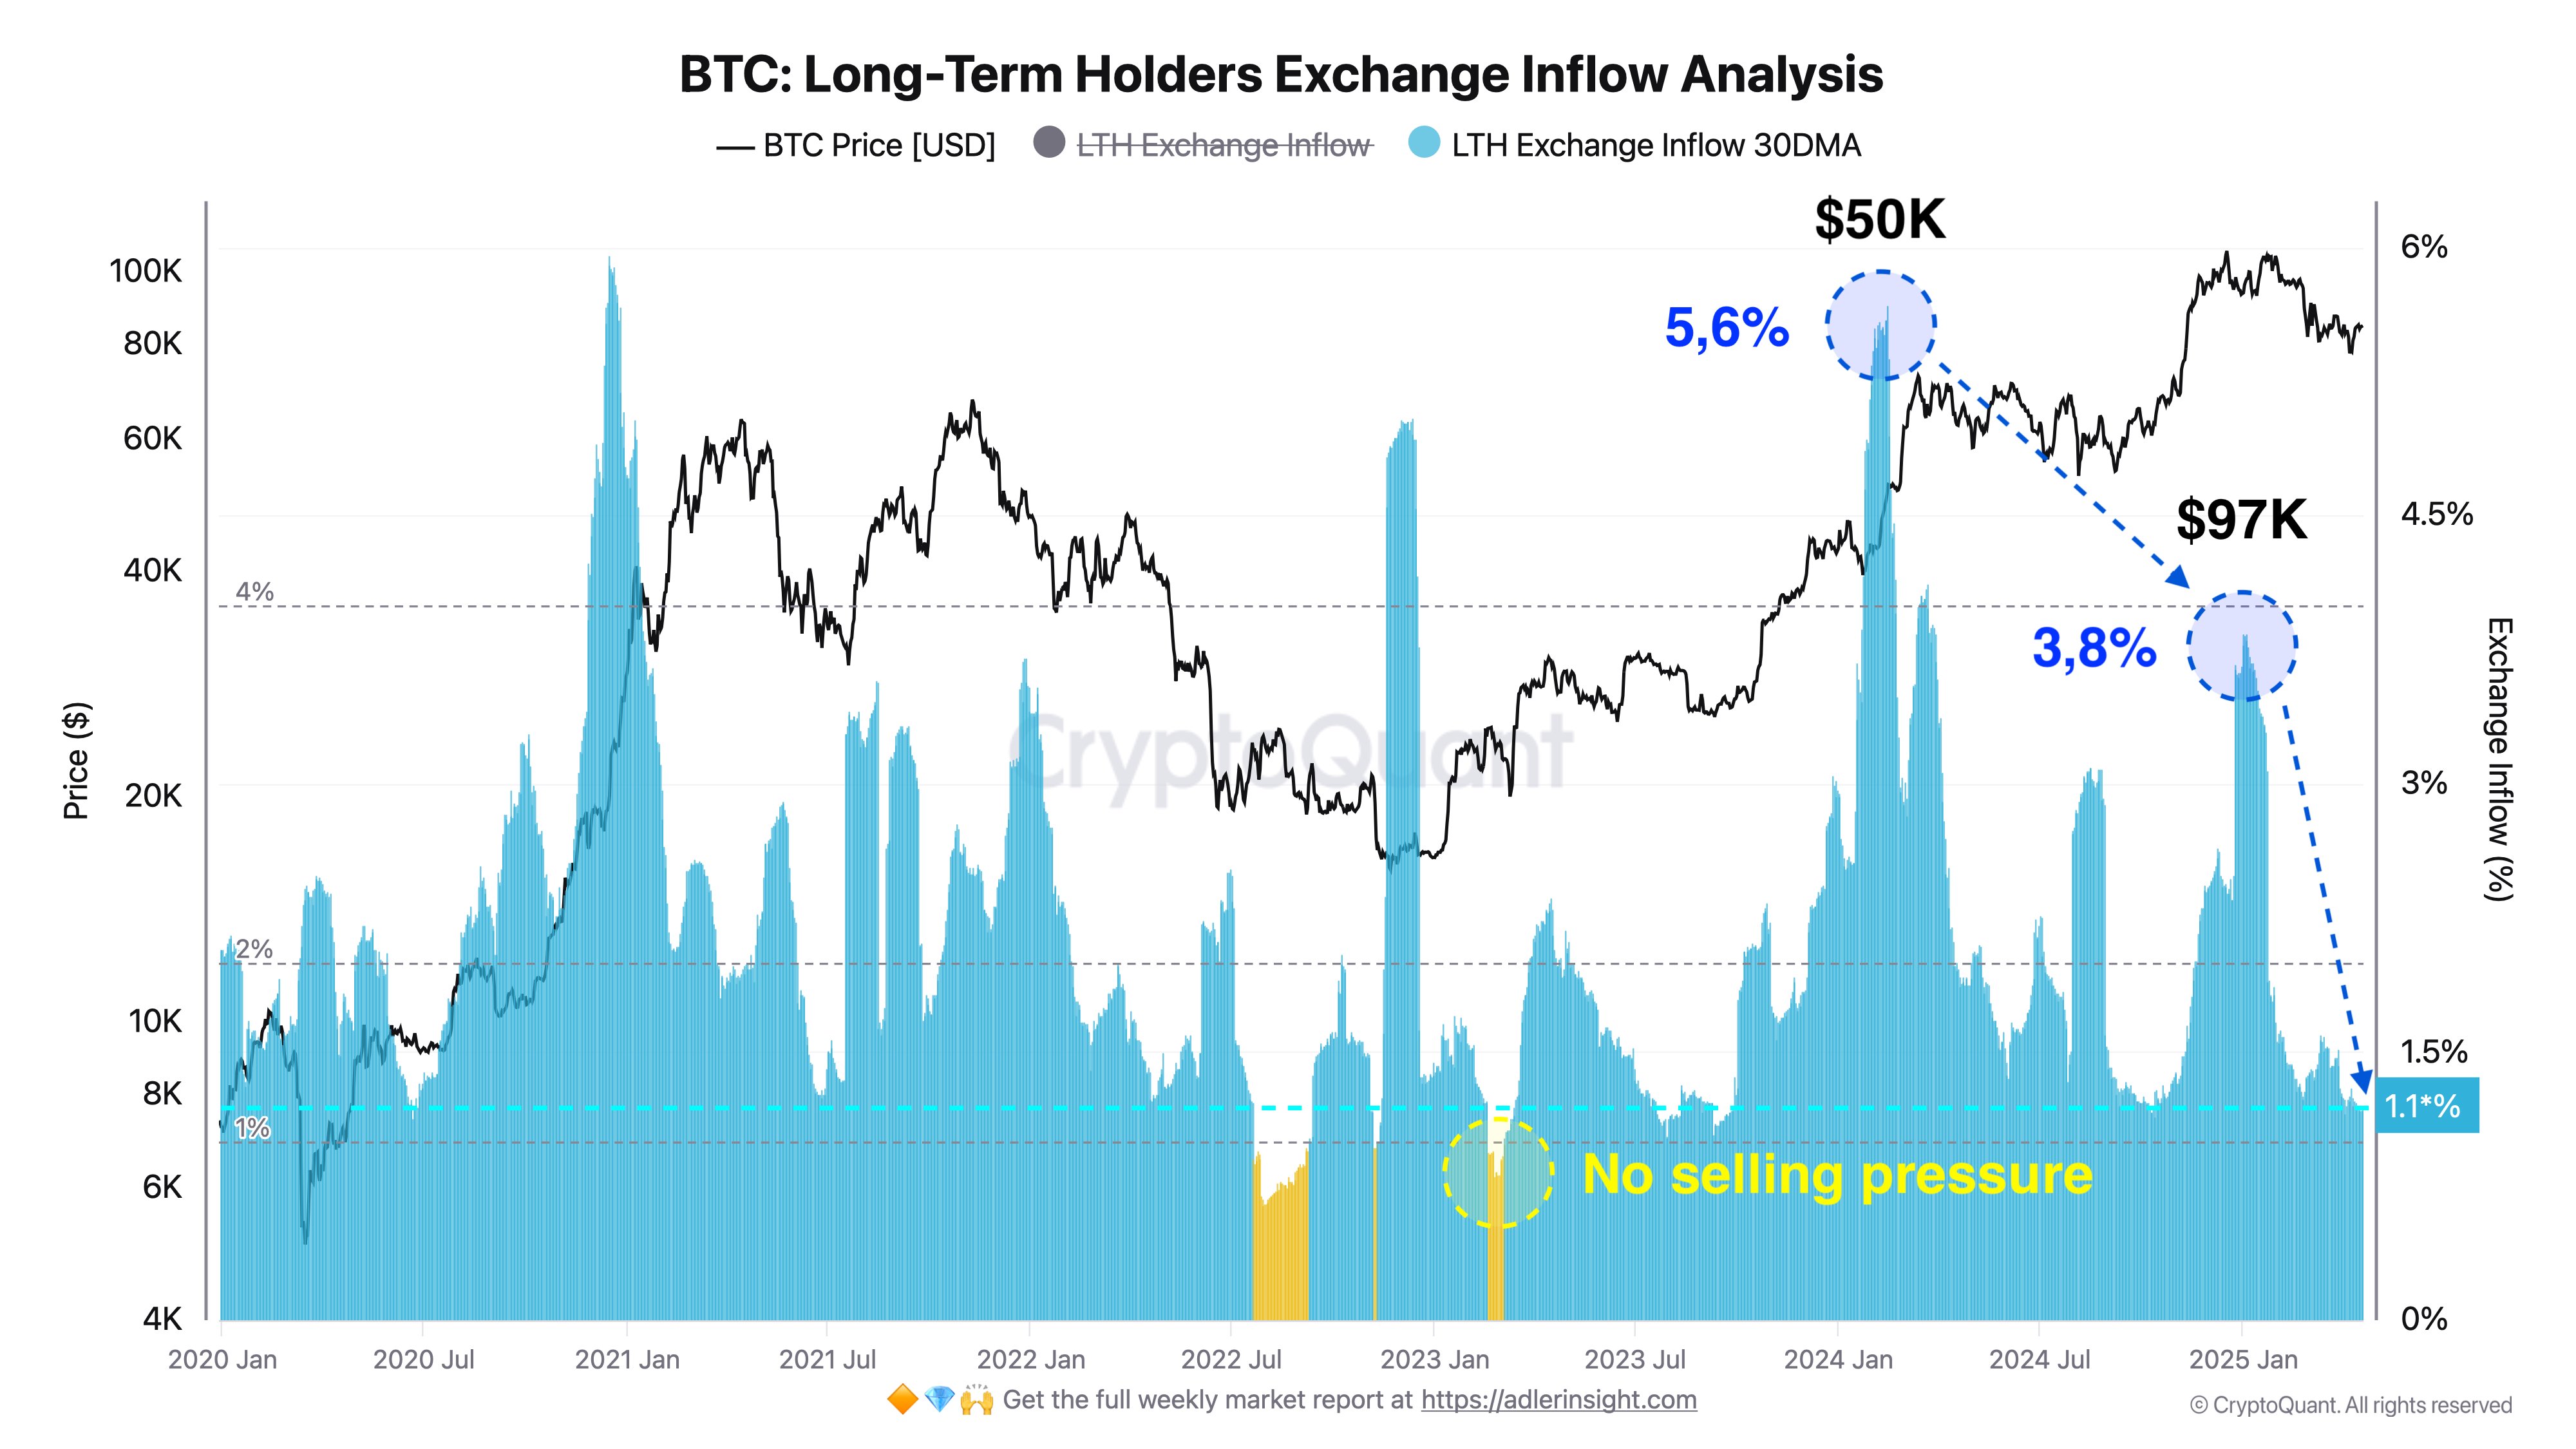
Adler explains that a further decline in these LTH exchange holdings to 1.0% would signal the total absence of selling pressure. Notably, this development could encourage new market entry and sustained accumulation, creating a strong bullish momentum in the BTC market.
Importantly, Alder highlights that the majority of the Bitcoin LTH entered the market at an average price of $25,000, Since then, CryptoQuant has recorded the highest LTH selling pressure of 5.6% at $50,000 in early 2024 and 3.8% at $97,000 in early 2025.
According to Adler, these two instances likely represent the primary profit-taking phases for long-term holders who intended to exit the market. Therefore, a resurgence in selling pressure from this cohort of BTC investors is unlikely in the short-term, which supports a building bullish case as long-term holders currently control 77.5% of Bitcoin in circulation.
BTC Price Overview
At the time of writing, Bitcoin was trading at $85,226 following a 0.36% gain in the past day and a 0.02% loss in the past week. Both metrics only reflect the ongoing market consolidation as BTC continues to struggle to achieve a convincing price breakout beyond $86,000.
Meanwhile, the asset’s performance on the monthly chat now reflects a 1.97% gain, indicating a potential trend reversal as the market correction ceases. Nevertheless, BTC remains in need of a strong market catalyst to ignite any sustainable price rally. With a market cap of $1.67 trillion, Bitcoin is ranked as the largest digital asset, controlling 62.9% of the crypto market.
Featured image from Adobe Stock, chart from Tradingview
Editorial Process for bitcoinist is centered on delivering thoroughly researched, accurate, and unbiased content. We uphold strict sourcing standards, and each page undergoes diligent review by our team of top technology experts and seasoned editors. This process ensures the integrity, relevance, and value of our content for our readers.

The Bitcoin price seems stuck in a consolidation range, ricocheting off the $83,000 and $86,000 levels over the past week. With no clear direction for the premier cryptocurrency, investors are left wondering what phase the market cycle is in—bullish or bearish.
According to a popular crypto analyst on the social media platform X, the Bitcoin price could be preparing for its next big move in either direction over the next few weeks. In any case, here are the important levels to watch out for in the next few days.
Crucial Levels To Watch For BTC’s Next Move
In an April 19 post on the X platform, crypto analyst Ali Martinez shared an interesting analysis of the Bitcoin price while highlighting the current layout of the world’s largest cryptocurrency by market cap. The online pundit noted that BTC bears and bulls are locked in a battle, leading to a choppy market condition.
Notably, the premier cryptocurrency appears to have entered the $83,000 – $86,000 range on Saturday, April 12. Hence, Martinez’s analysis basically revolves around the price of BTC bouncing off the support and resistance levels on its one-hour timeframe.

Source: @ali_charts on X
As shown in the chart above, the Bitcoin price attempted multiple times to breach the resistance zone around the $86,000 region over the past week. However, the bulls’ optimism was met with the staunch resilience of the Bitcoin bears, as the price of BTC almost always found its way back toward the $83,000 mark.
Most recently, the flagship cryptocurrency made its way toward the $86,000 level on Wednesday, April 16, but failed to break the significant resistance zone after the US Federal Reserve (Fed) chair Jerome Powell suggested that interest rate cuts might not be coming as early as anticipated by crypto traders.
Martinez noted in his post that the next significant move for the Bitcoin price depends primarily on the $83,000 and $86,000 levels. According to the crypto pundit, a breakout above the $86,000 mark could spell the start of a bullish run for Bitcoin, while a break below $83,000 could mean further correction for the market leader.
Bitcoin Price Overview
After reaching its all-time high of $108,786 in January 2025, the price of BTC has been on a steady decline in the past few months. According to data from CoinGecko, the flagship cryptocurrency has losst more than 22% of its value since hitting its record-high price.
As of this writing, the price of Bitcoin stands at around $84,530, reflecting a 0.3% decline in the past 24 hours. Meanwhile, the Bitcoin price is up by more than 1% on the weekly timeframe.
The price of BTC on the daily timeframe | Source: BTCUSDT chart on TradingView
Featured image from iStock, chart from TradingView
Editorial Process for bitcoinist is centered on delivering thoroughly researched, accurate, and unbiased content. We uphold strict sourcing standards, and each page undergoes diligent review by our team of top technology experts and seasoned editors. This process ensures the integrity, relevance, and value of our content for our readers.

Here Are The Bitcoin Levels To Watch For The Short Term

Bitcoin LTH Selling Pressure Hits Yearly Low — Bull Market Ready For Take Off?

Will XRP Break Support and Drop Below $2?

Expert Predicts Pi Network To Reach $5 As Whales Move 41M Pi Coins Off Exchanges

Dogecoin Defies Bullish Bets During Dogeday Celebration

Tokens Big Players Are Buying

2.52 Million Altcoins Are Ruining Crypto’s Future

Animoca Brands Valuation Tanks 75% In Two Years, Here’s Why

Crypto exchange BingX hacked for $43 million

Are The Big Players Losing Interest?

Hong Kong’s Securities Association Tips Authorities On Crypto Self-Regulation

Coinbase cbBTC Set to go Live on Solana
2.52 Million Altcoins Are Ruining Crypto’s Future
Animoca Brands Valuation Tanks 75% In Two Years, Here’s Why
Crypto exchange BingX hacked for $43 million
Are The Big Players Losing Interest?
Hong Kong’s Securities Association Tips Authorities On Crypto Self-Regulation
Coinbase cbBTC Set to go Live on Solana
-
 Altcoin21 hours ago
Uniswap Founder Urges Ethereum To Pursue Layer 2 Scaling To Compete With Solana
-

 Market17 hours ago
Today’s $1K XRP Bag May Become Tomorrow’s Jackpot, Crypto Founder Says
-

 Ethereum18 hours ago
Ethereum Consolidates In Symmetrical Triangle: Expert Predicts 17% Price Move
-
 Altcoin20 hours ago
What’s Up With BTC, XRP, ETH?
-
 Market11 hours ago
1 Year After Bitcoin Halving: What’s Different This Time?
-

 Market15 hours ago
MELANIA Crashes to All-Time Low Amid Insiders Continued Sales
-

 Ethereum20 hours ago
Ethereum Accumulators At A Crucial Moment: ETH Realized Price Tests Make-Or-Break Point
-

 Ethereum17 hours ago
Ethereum Enters Historic Buy Zone As Price Dips Below Key Level – Insights