
Bitcoin
Bitcoin Price Surge Could Cause $1 Billion in Losses

Bitcoin’s (BTC) price faced immense volatility over the weekend, dropping to $66,680 at one point. As the coin recovers, traders in the market are taking positions to profit from the price action.
Drawing insights from derivatives market activity, this analysis pinpoints price levels that could cause a cascade of liquidations and focuses on BTC’s potential price movement.
Bitcoin Price Spike Threatens Major Bear Liquidations
Bitcoin’s see-saw movement in the last two days could be linked to Donald Trump’s appearance and speech at the 2024 Bitcoin conference in Nashville. Before the event, traders were optimistic that the U.S. former president’s presence could accelerate the coin’s price.
However, the opposite happened as it was a “sell the news” event. At press time, BTC’s price is $69,450 and is close to reaching $70,000 in almost 50 days. Some comments online suggest that this movement could be the one that takes the coin back to its all-time high.
But what will happen if Bitcoin’s price surpasses $73,000? According to the Bitcoin Exchange Liquidation Map, short positions valued at $1.35 billion will be liquidated if BTC reaches $73,132.
Read more: Who Owns the Most Bitcoin in 2024?
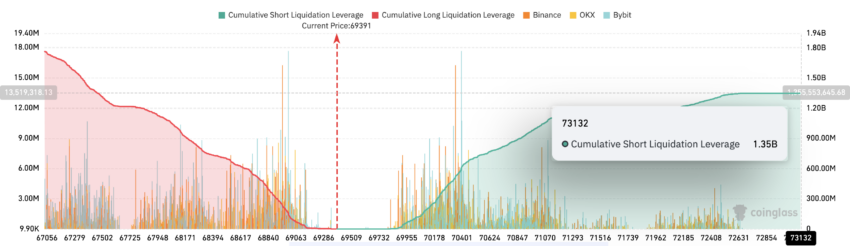
Liq. map, as it is commonly called, shows the cascading effect on open positions when prices hit a certain level. Therefore, a price increase for the coin could force exchanges to close the positions of traders betting on a decrease.
While it remains uncertain how quickly Bitcoin will retest its previous highs, the Hodler Net Position Change shows that a price increase is likely. This change shows whether long-term investors are accumulating or cashing out.
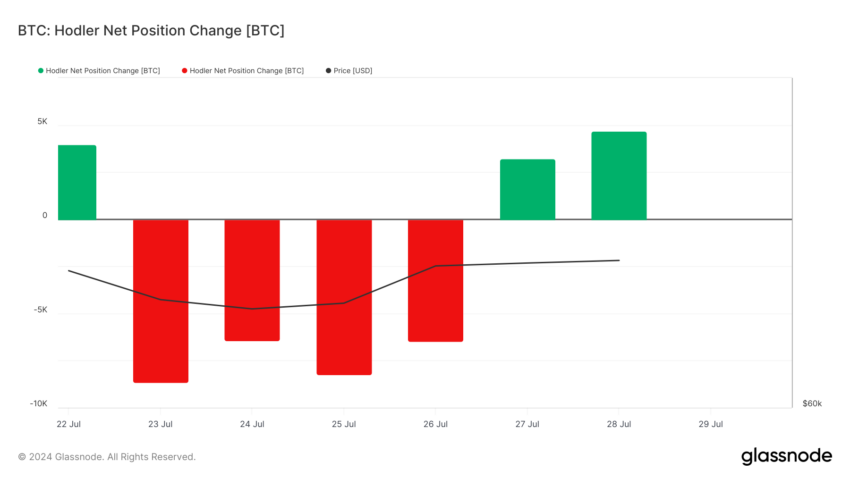
Between July 23 and 26, long-term holders cashed out a total of 29,781 BTC, putting downward pressure on the price. However, on July 28, investors bought 4,689 BTC in addition to the 3,213 coins purchased on July 27. If this continues, Bitcoin may resist a move to the downside and keep up with its upswing,
BTC Price Prediction: $71,000 Before $68,000?
The daily BTC/USD chart reveals that the coin has formed a rising wedge pattern. This pattern is bearish and signals a possible reversal during an uptrend. From the chart shown below, the rising wedge could help BTC surpass $70,000 and possibly reach $71,967.
However, Bitcoin may initiate a downtrend once the converging trendlines meet. If that happens, the next level for BTC to reach could be around $68,022. Also, bulls may try to defend the region and trigger a rebound. If successful, BTC will resume its uptrend. However, failure to defend the zone could send the coin down to $64,925.
The Relative Strength Index (RSI) also supports a drawdown, especially as it approaches overbought levels. The RSI uses price changes and size to measure a cryptocurrency’s momentum.
Read more: 7 Best Crypto Exchanges in the USA for Bitcoin (BTC) Trading
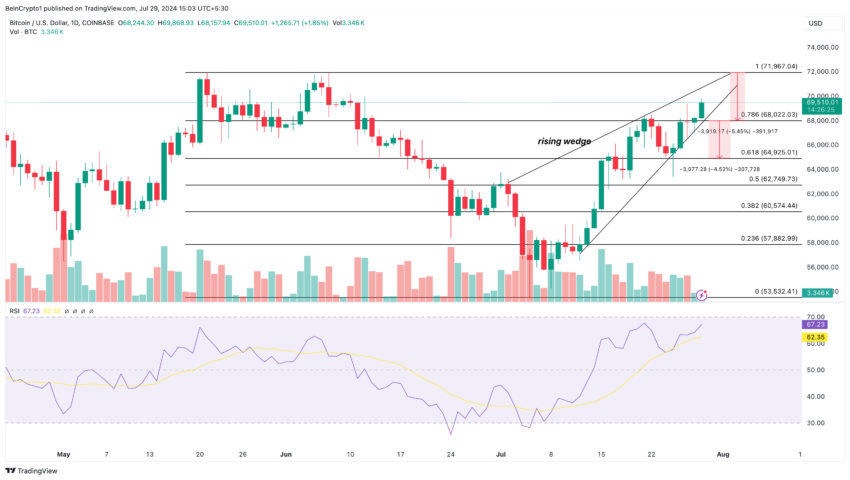
Readings at 70.00 or above indicate overbought levels, while rating at 30.00 suggests oversold levels. As of this writing, the RSI on Bitcoin’s chart shows a bullish momentum, indicating that the price may continue to appreciate.
However, it also reveals that the coin is not free from a decline if the reading increases. Should Bitcoin price decline to $68,000, long positions worth $1.13 billion will be liquidated.
Disclaimer
In line with the Trust Project guidelines, this price analysis article is for informational purposes only and should not be considered financial or investment advice. BeInCrypto is committed to accurate, unbiased reporting, but market conditions are subject to change without notice. Always conduct your own research and consult with a professional before making any financial decisions. Please note that our Terms and Conditions, Privacy Policy, and Disclaimers have been updated.


The US Dollar Index (DXY) has dropped to a three-year low amid reports that President Donald Trump is considering removing Federal Reserve Chairman Jerome Powell.
Meanwhile, the development positively affected Bitcoin’s (BTC) price, pushing it to its highest level since President Trump’s Liberation Day.
Trump’s Push Against Powell Adds Pressure on the Dollar
According to the latest data, DXY has plunged below 99. At press time, it stood at 98.2, representing the lowest value since March 2022.

Economist Peter Schiff highlighted the severity of the situation in the latest post on X (formerly Twitter).
“Gold is up over $50, hitting a record high of $3,380. The euro is above $1.15. The dollar has also fallen below 141 Japanese yen and .81 Swiss francs (a new 14-year low, just 3% above a record low). The dollar Index is below 98.5, a new three-year low. This is getting serious,” Schiff posted.
The dollar’s steep fall comes amid the latest comments made by National Economic Council Director Kevin Hassett on Friday, April 18. Hassett revealed that Trump and his team are actively exploring the possibility of ousting Powell.
His statement was in response to a reporter’s question about whether removing Powell was an option.
“The president and his team will continue to study that matter,” Hassett replied.
In addition, he called out the Federal Reserve for politically motivated actions under Powell’s leadership. Specifically, Hassett criticized the Fed for raising interest rates shortly after Trump’s election and cutting them ahead of the election, moves he claims favored the Democratic Party.
Notably, the growing contempt towards Powell is a response to the Fed’s stance on interest rates. BeInCrypto reported earlier that the Fed will likely not cut rates in May amid rising inflation and President Trump’s tariff pause.
Recently, Trump also blamed the Fed Chair for being slow to act on interest rate cuts. In a post on social media, Trump compared Powell’s actions unfavorably to the European Central Bank (ECB), which is set to implement its seventh interest rate cut.
Trump argued that Powell, whom he described as “always too late and wrong,” should have taken similar measures long ago to address economic conditions.
“Powell’s termination cannot come fast enough!” the President wrote.
The Fed Chair’s potential removal raises serious questions about the Federal Reserve’s independence and its implications for global markets. Powell, whose term as chair extends to May 2026, has previously stated that legal protections prevent his removal and that he intends to serve out his term.
Will Dollar Weakness Drive Bitcoin to New Heights?
Nonetheless, it’s worth noting that if Powell is removed and President Trump successfully persuades the Federal Reserve to cut interest rates, it could likely lead to a crypto market rally. Generally, when the Fed lowers interest rates, the US dollar tends to weaken.
Therefore, investors prefer cryptocurrencies, especially Bitcoin, which is often seen as a hedge against inflation and the weakening of fiat currencies. The inverse relation between the DXY and BTC further solidifies the case for a rally if the dollar depreciates.
In fact, the latest decline in the dollar index has coincided with a notable increase in Bitcoin’s price. The largest cryptocurrency surged to over $87,000 for the first time since April 2.
“USD weakness is driving the rally in crypto,” Sean McNulty, Derivatives Trading Lead at FalconX, told Bloomberg.
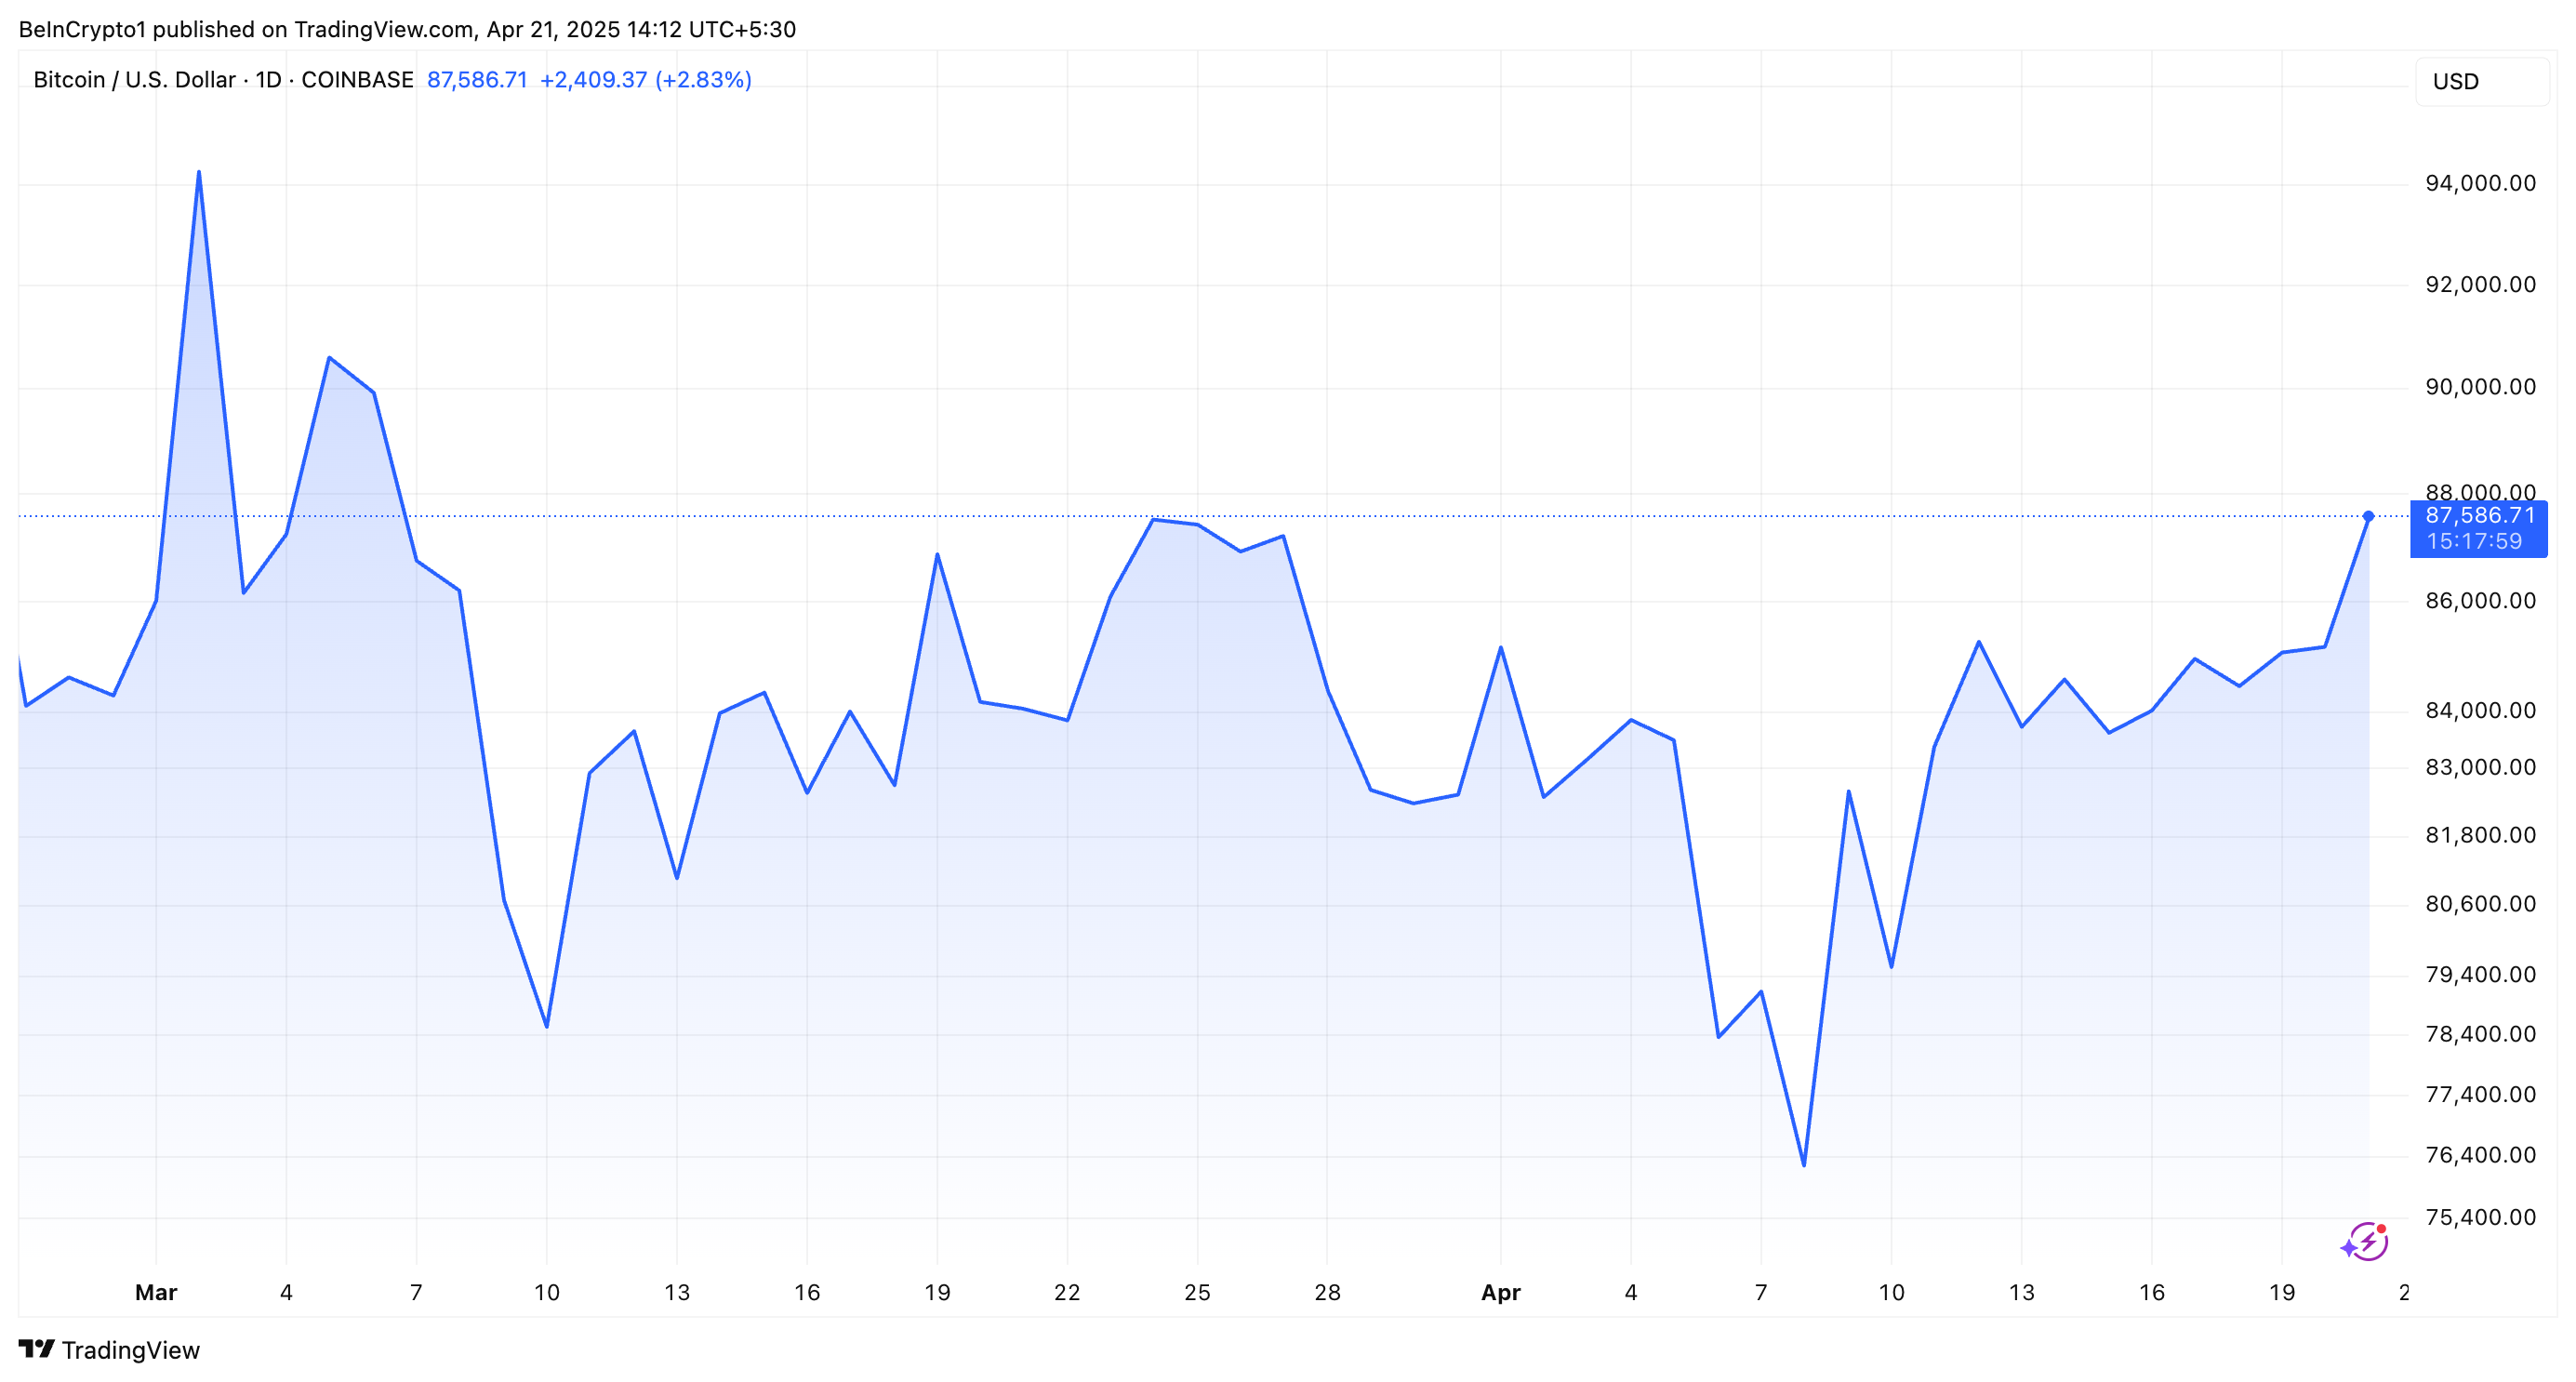
At the time of writing, BTC was trading at $87,586. BeInCrypto data showed that this represented an appreciation of 3.5% over the past day. As markets celebrate these gains, the focus remains on Trump’s next moves and their broader economic consequences.
Disclaimer
In adherence to the Trust Project guidelines, BeInCrypto is committed to unbiased, transparent reporting. This news article aims to provide accurate, timely information. However, readers are advised to verify facts independently and consult with a professional before making any decisions based on this content. Please note that our Terms and Conditions, Privacy Policy, and Disclaimers have been updated.

Several top crypto news stories are in the lineup this week in crypto, spanning various ecosystems with the potential to drive volatility.
This week, traders looking to capitalize on event-specific volatility should monitor the following developments.
This week, the Solana Community Conference, or Breakpoint, is among the top crypto news stories. It kicks off on April 25 and is Solana’s flagship gathering of developers, investors, and innovators.
Historically, Solana Breakpoint is a stage for major announcements, such as new project launches, partnerships, or technological advancements. In recent years, key announcements in similar gatherings have included the Solana Seeker phone or the Firedancer validator client.
According to Solscan data, Solana’s ecosystem boasts nearly 4 million active wallets. Meanwhile, DefiLlama data shows up to $7.37 billion in total value locked (TVL). With these numbers, the Solana community conference could drive positive sentiment for SOL, which was trading at $141.05 at press time.
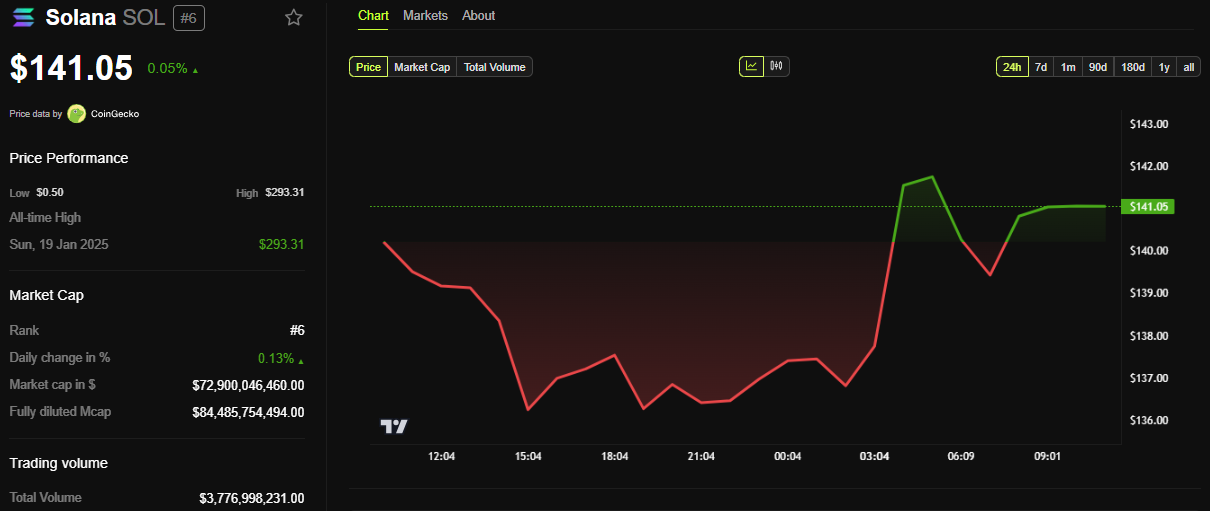
Traders should brace for potential price volatility, as positive news could spark short-term spikes. In the same way, any underwhelming news or network concerns, like past outages, might temper enthusiasm.
Texas Bitcoin Reserve Hearing
Another top crypto news story this week concerns a strategic crypto reserve. On April 23, Texas will hold a strategic Bitcoin reserve hearing, marking a significant event given the state’s pro-crypto stance.
The bill, introduced four months ago, passed the committee with a 9-0 vote and received senate approval with 80% support. Similarly, Dan Patrick, Lieutenant Governor for the State of Texas, listed Bitcoin Reserve as a top priority for 2025.
“My statement announcing the first round of top 40 priority Bills for the 2025 legislative session,” he shared on X (Twitter) in January.
Against these backdrops, the Wednesday hearing could clarify Texas’s approach to institutional Bitcoin adoption. This could set a precedent for other states or federal policy.
A favorable outcome might bolster Bitcoin’s legitimacy, driving demand from institutional investors and positively influencing the BTC price.

Initia’s Mainnet and INIT Token Launch
Also in the headlines, this week in crypto, Initia’s mainnet launch and its token, INIT, debut on Thursday, April 24. This comes after the network revealed a 50 million token airdrop three weeks ago.
The Thursday event will mark a key milestone for the layer-1 blockchain, which is focused on interoperability and user experience. The launch could attract attention from decentralized finance (DeFi) and cross-chain enthusiasts, as Initia aims to simplify dApp interactions.
For traders, INIT’s initial price action will be critical, as new token launches often experience high volatility due to speculative trading.
“Initia INIT Binance Spot Listing Date Announced! Listing on: 24th April 2025. Mainnet will also officially launch on the same day. Airdrop claim date and exact time are yet to be announced,” the network stated recently.
Investors should evaluate Initia’s partnerships and developer adoption, as its success hinges on ecosystem growth.
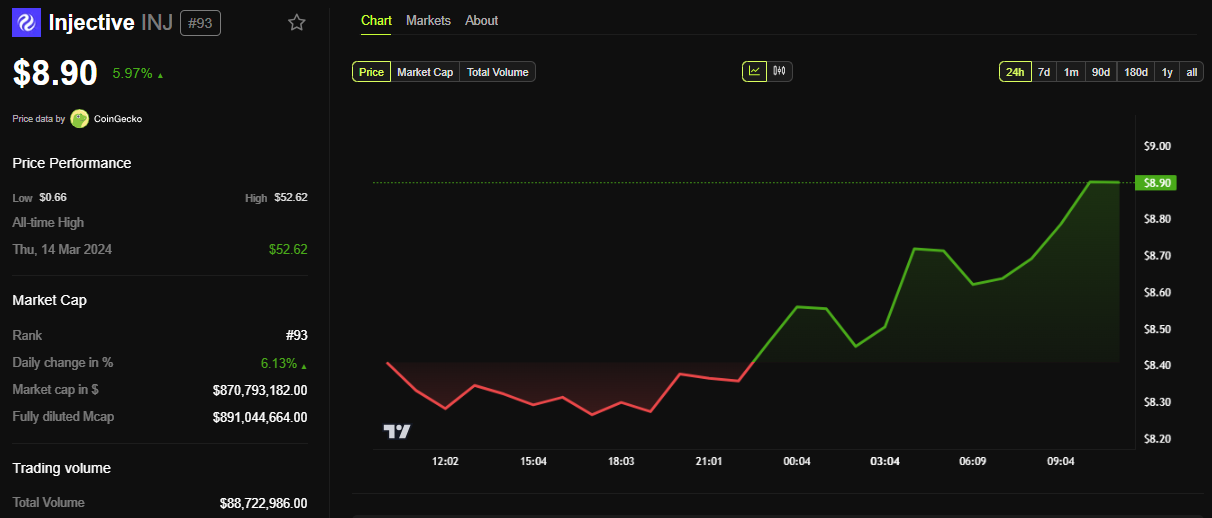
Injective’s Lyora Mainnet Upgrade
Injective’s Lyora mainnet upgrade, scheduled for Tuesday, April 22, aims to enhance network performance and transaction speed. It would strengthen its position as a DeFi-focused layer-1 chain.
“The Injective Lyora Mainnet is nearly here! Vote today to dramatically enhance Injective infrastructure, performance, and transaction speeds. The official launch is on April 22,” Injective said.
This upgrade could improve user experience and attract developers to Injective’s ecosystem, particularly for derivatives and trading platforms.
Traders should watch INJ’s price for short-term momentum, as successful upgrades often drive positive sentiment.
At the same time, investors should consider Injective’s growing TVL (total value locked) and partnerships, like its collaboration with Sonic for AI agent platforms, as indicators of long-term potential.
Disclaimer
In adherence to the Trust Project guidelines, BeInCrypto is committed to unbiased, transparent reporting. This news article aims to provide accurate, timely information. However, readers are advised to verify facts independently and consult with a professional before making any decisions based on this content. Please note that our Terms and Conditions, Privacy Policy, and Disclaimers have been updated.

Several US economic indicators are in the pipeline this week, with potential implications for Bitcoin and crypto.
US macroeconomic data have broadly influenced sentiment in the cryptocurrency market over the past several months. Therefore, it is imperative that traders and investors adjust their portfolios and align their trading strategies to capitalize on key economic events.
US Economic Events This Week
Several factors, including macroeconomic sentiment, monetary policy expectations, and Bitcoin’s growing narrative as a hedge or risk asset, influence Bitcoin’s price dynamics. These make the following indicators particularly relevant this week.
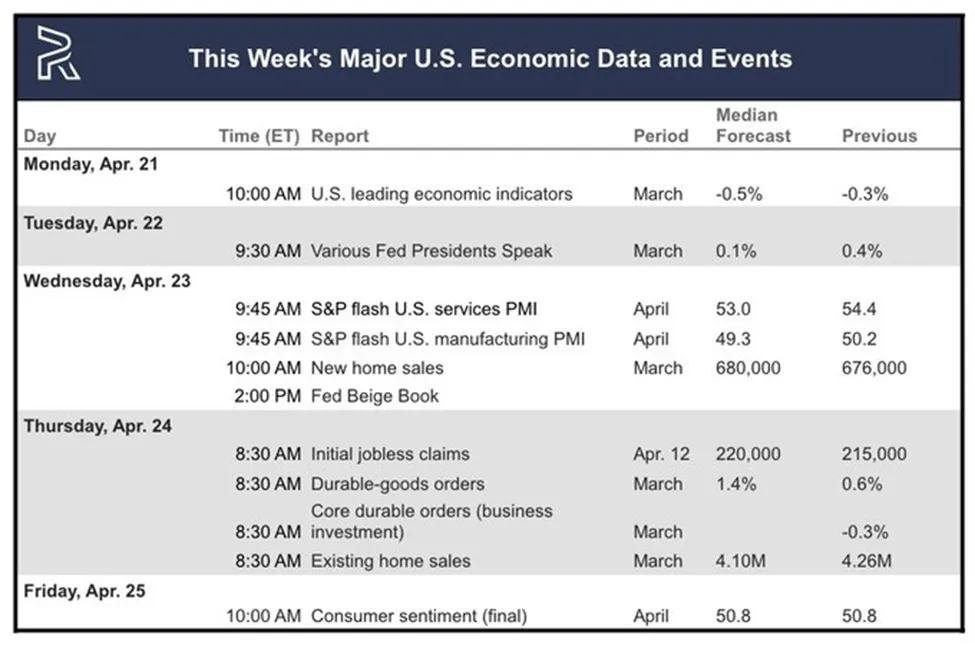
US Leading Economic Indicators
The first US economic indicator that could influence Bitcoin price is March’s leading economic indicator, due today, Monday, April 21.
The Conference Board Leading Economic Index (LEI), last reported for February 2025, declined by 0.3% month-over-month (MoM) after a revised 0.1% increase in December 2024.
This drop, driven by pessimistic consumer expectations and weaker manufacturing orders, continued a trend of negative signals. However, the six-month growth rate is improving, suggesting less severe headwinds than in 2024.
There is a median forecast of a 0.5% decline for the March report, versus a consensus of -0.6%. While these data points to economic slowdown, stabilizing trends and a projected 2.0% GDP growth for 2025 offer some optimism.
However, policy uncertainties, such as Trump’s tariffs, could exacerbate risks. For Bitcoin, declining LEI may dampen risk appetite, pushing investors toward safer assets like bonds and pressuring prices in the short term.
Conversely, Bitcoin’s “digital gold” narrative could gain traction if economic uncertainty fuels distrust in fiat systems. However, this is less likely unless broader trade tensions or policy shocks amplify the effect.
Services PMI
The S&P Global US Services PMI for March 2025 climbed to 54.4 from 51.0 in February, signaling strong expansion in the services sector. This rise, paired with a composite PMI 53.5, reflects resilient consumer demand.
This strength bolsters the US dollar, reducing expectations for Federal Reserve (Fed) rate cuts, which could challenge Bitcoin’s appeal. A stronger dollar and higher yields typically weigh on Bitcoin, as seen in past cycles when real yields rise.
However, rising input costs and tariff concerns temper business confidence. For the April Services PMI, the median forecast is 53.0.
Strong services activity may support broader risk-on sentiment, potentially lifting Bitcoin if equity markets rally, given its occasional correlation with indices like the Nasdaq.
Still, tariff uncertainties could cap any negative pressure, keeping the impact neutral to slightly bearish, as dollar strength overshadows marginal risk-on gains.
Manufacturing PMI
In contrast, the S&P Global US Manufacturing PMI for March 2025 fell to 50.2 from 52.7, hovering near stagnation. Meanwhile, the ISM Manufacturing PMI contracted to 49.0 from 50.3, with new orders, production, and employment declines.
This weakness, consistent with October 2024’s ISM reading 46.5, reflects high interest rates, weak global demand, and tariff-related uncertainty.
Moody’s Analytics and Statista highlight manufacturing’s struggles, warning of broader slowdown risks, especially with trade policy volatility under the Trump administration.
For Bitcoin, weak manufacturing data signals reduced risk appetite, likely exerting downward pressure, particularly given its equity market correlation.
While a sharp manufacturing decline could theoretically spur rate-cut expectations, persistent inflation and tariff-driven cost pressures make this unlikely. The outlook here is bearish, as fears of economic slowdown dominate.
“S&P Global Services/ManufacturingPMI (Wednesday): The pulse of the economy. Watch for a dip or rise in the numbers…it could hint at whether the recovery is running out of gas or shifting into overdrive,” one user remarked.
Initial Jobless Claims
Initial Jobless Claims for the week ending April 19 recorded 215,000, down from 223,000 the week before.
It indicates a slight improvement but still reflects a labor market under pressure, suggesting ongoing challenges. High interest rates, cautious business investment, and uncertainties surrounding tariff policies likely drive this sentiment by eroding employer confidence.
“…66% of Americans expect higher unemployment in the next 12 months, the highest share since the Great Financial Crisis. Such sharp spikes have never occurred outside of recessions. The job market is set to get worse pretty quickly,” one analyst noted recently.
Nevertheless, despite reduced hiring and economic pressures, the decline suggests some layoff stabilization.
Analysts note that lower claims could ease concerns about rapid deterioration, persistent inflation, and policy uncertainties, which limit expectations for Fed rate cuts.
Meanwhile, jobless claims are a critical driver of Bitcoin sentiment. The modest drop in claims may temper economic weakness signals. If claims continue to decline significantly, sparking hopes of monetary easing, Bitcoin could benefit from increased liquidity and lower yields.
Consumer Sentiment
Consumer Sentiment, as measured by the University of Michigan’s index, was 50.8 in March 2025. This was a modest drop from February’s reading, reflecting tariff-related pessimism and inflation fears despite solid economic conditions.
Preliminary March data suggests a reading of 50.8, with sentiment still sour, per TradingEconomics estimates.
“US consumer sentiment is lower than in the great financial crisis. Consumer sentiment fell to 50.8, the 2nd-lowest level in history. The sentiment is lower than during every US recession over the last 50 years…This is a crisis,” a global markets investor noted.
Consumer sentiment is a gauge of retail investor confidence, critical for Bitcoin’s retail-driven market. Lower sentiment could sap enthusiasm for speculative assets, pushing Bitcoin lower, especially if risk-off sentiment dominates.
Conversely, if sentiment stabilizes or tariff fears ease, Bitcoin could ride a risk-on wave, though this seems unlikely given current trends.
The probable effect is bearish, as declining confidence aligns with broader economic caution.
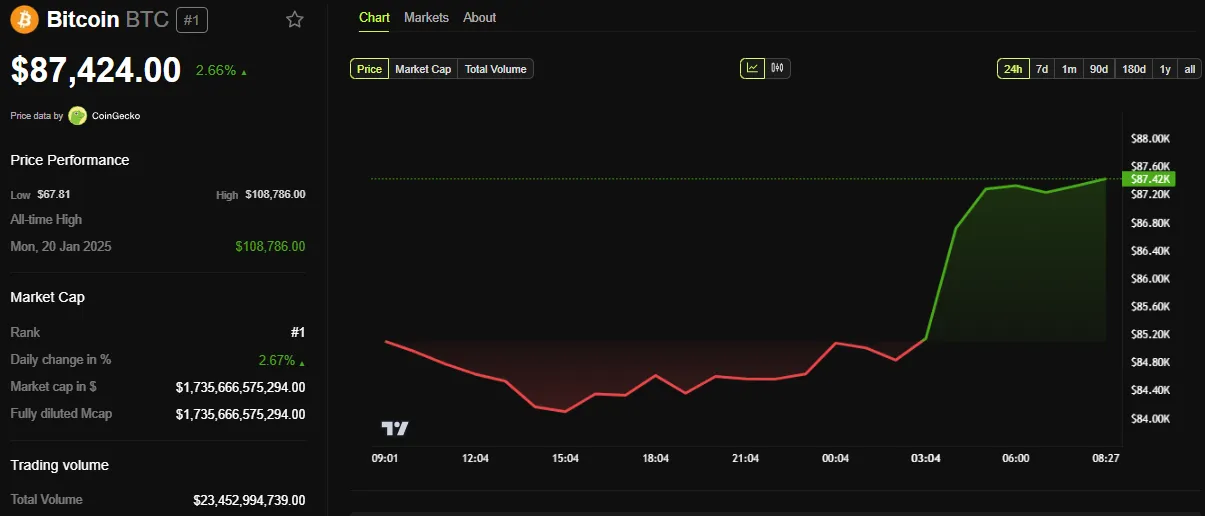
BeInCrypto data shows Bitcoin (BTC) was trading for $87,424 as of this writing. This represents a modest 2.66% gain in the last 24 hours.
Disclaimer
In adherence to the Trust Project guidelines, BeInCrypto is committed to unbiased, transparent reporting. This news article aims to provide accurate, timely information. However, readers are advised to verify facts independently and consult with a professional before making any decisions based on this content. Please note that our Terms and Conditions, Privacy Policy, and Disclaimers have been updated.

Will Cardano Price Break Out Soon? Triangle Pattern Hints at 27% ADA Surge

BNB Springs Back From $531 With Unshaken Bullish Conviction

XRP Futures Traders Increase Bets on Upside

Optimism, Aztec, and Huma Finance

Solana Staking Cap Surpasses Ethereum, But Is This Sustainable?

Dollar Dips While Bitcoin Hits New Heights

2.52 Million Altcoins Are Ruining Crypto’s Future

Animoca Brands Valuation Tanks 75% In Two Years, Here’s Why

Crypto exchange BingX hacked for $43 million

Are The Big Players Losing Interest?

Hong Kong’s Securities Association Tips Authorities On Crypto Self-Regulation

Coinbase cbBTC Set to go Live on Solana
2.52 Million Altcoins Are Ruining Crypto’s Future
Animoca Brands Valuation Tanks 75% In Two Years, Here’s Why
Crypto exchange BingX hacked for $43 million
Are The Big Players Losing Interest?
Hong Kong’s Securities Association Tips Authorities On Crypto Self-Regulation
Coinbase cbBTC Set to go Live on Solana
-
 Market22 hours ago
1 Year After Bitcoin Halving: What’s Different This Time?
-

 Market23 hours ago
VOXEL Climbs 200% After Suspected Bitget Bot Glitch
-

 Market21 hours ago
Tokens Big Players Are Buying
-

 Market20 hours ago
Dogecoin Defies Bullish Bets During Dogeday Celebration
-

 Market18 hours ago
Will XRP Break Support and Drop Below $2?
-

 Market24 hours ago
How Token Launch Frenzy Is Delaying 2025 Altcoin Season
-
 Altcoin24 hours ago
Binance Traders Go Big On Dogecoin—Majority Holding Long Positions
-
 Altcoin19 hours ago
Expert Predicts Pi Network To Reach $5 As Whales Move 41M Pi Coins Off Exchanges