
Bitcoin
Bitcoin (BTC) Price Teeters Below Key Support: Is $60,000 Next?
History shows that Bitcoin (BTC) price correction is inevitable whether it is a bull market or not. However, this cycle has been different, especially as BTC reached a new all-time high before the halving in April.
Since the boom in the first quarter of 2024, the cryptocurrency’s price has been downhill. On-chain analysis dives into Bitcoin’s price prediction. Will respite appear, or are we in for another round of decline?
Bitcoin Slides Down Crucial Point
In Q1, the inflows into the approved Bitcoin ETFs drove the price to $73,750. Over the past few months, there has been a dearth of institutional capital. Thus, the ETFs no longer dictate the direction of the coin.
Instead, the activities of Short-Term Holders (STH) move BTC. STH refers to investors who purchased Bitcoin within the last 155 days. To assess Bitcoin’s potential in the short term, we will analyze the STH Realized Price.
The STH-Realized Price, also known as the on-chain cost basis, refers to the average price of the STH supply, valued at the period each coin last transacted on-chain.
As of this writing, BTC trades at $62,367. However, according to Glassnode, the STH-Realized Price is $64,410.
Read More: Who Owns the Most Bitcoin in 2024?
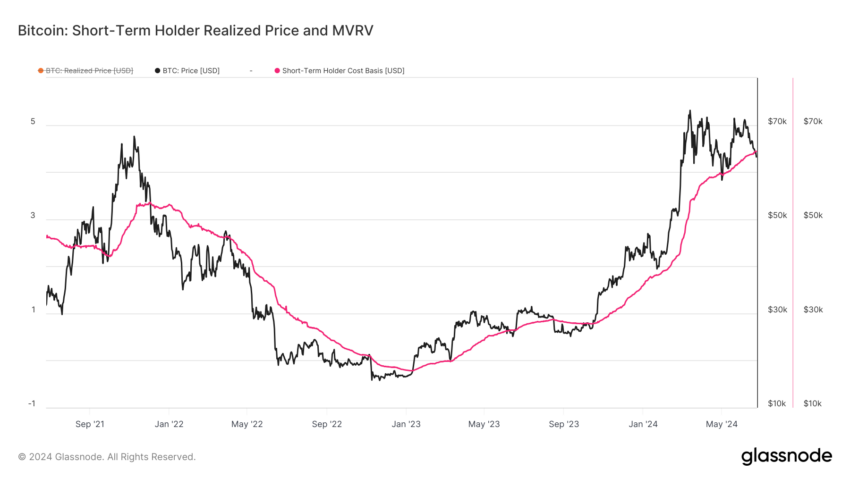
Historically, when the metric falls below the coin value, it supports the price. Hence, it leads to a higher value within a short period. On the other hand, a rise above Bitcoin’s price leads the cryptocurrency to a further decline.
BeInCrypto found evidence of this after examining the performance in 2018 and 2021. For instance, in December 2021, the STH Realized Price was $52,967. At that time, BTC changed hands at $50,492.
In less than two months, the price fell to $42,721. In January 2018, it was no different, with a Realized Price of $11,012 and BTC at $9,965. Before March, the price plunged to $7,852.
Whales, Retail Pass Vote of No-Confidence
Should Bitcoin fail to rise above the metric mentioned above, a further decline toward $60,000 could be next. While Bitcoin’s price has been falling for some time, whale accumulation has prevented it from another notable correction.
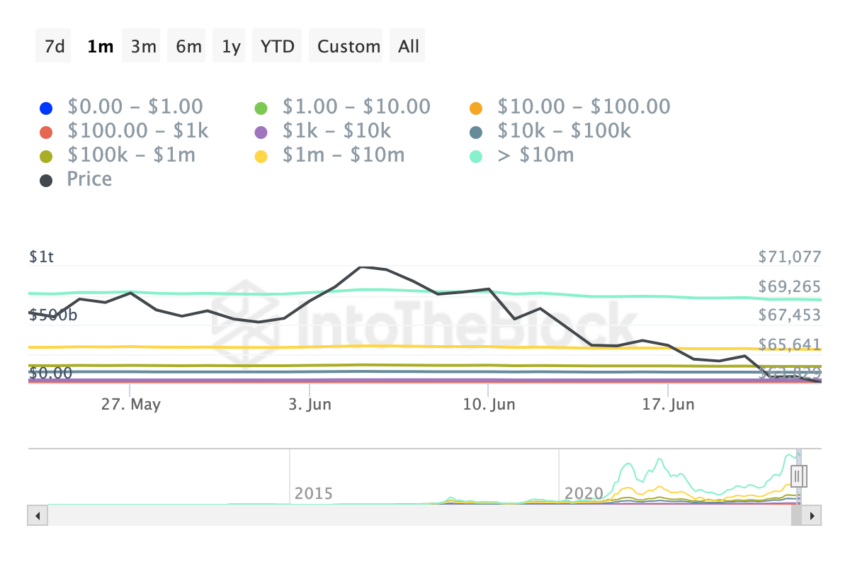
However, that position seemed to have changed based on the Balance By Holdings indicator. This on-chain metric tells if holders are adding to their balance and selling some coins. But this time, it’s not just whales letting go of some of their coins. The retail cohort is doing the same.
In the last 30 days, addresses holding BTC worth $100 to $10 million have been selling. Using the basic laws of demand and supply, these sell-offs put Bitcoin at risk of a major decline.
Meanwhile, Checkmatey, a pseudonymous analyst, posted on X that consolidation and correction are necessary before the price increases again.
“After 18 months of pure up-only price action, a period of several months of consolidating and correcting is not only expected but required.” He wrote.
BTC Price Prediction: No Support in Sight
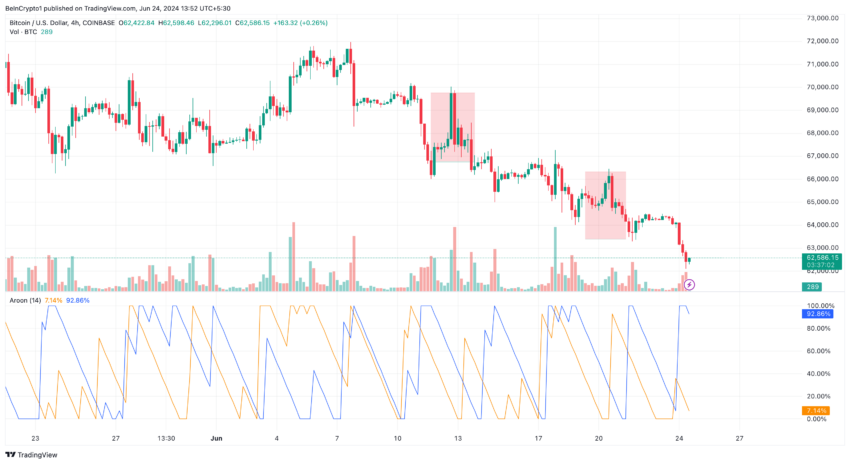
On the 4-hour timeframe, Bitcoin mirrors a pattern that led to a price decrease on June 12. Around that time, BTC fell from $69,747 to $66,633. On June 20, a similar thing occurred as the price dropped from $66,292 to $63,811.
Validation of the movement may send BTC to $61,560 for a start. If bulls fail to defend this, the coin’s price might slip below the $60,000 threshold.
Further, the Aroon indicator suggests a decline. The Aroon indicator allows traders to identify the direction in which a cryptocurrency trends. The indicator is divided into — Aroon Up (orange) and Aroon Down (blue).
When the Aroon Up is higher, it means the price will move upward. Conversely, the price will decrease if the Aroon Down outpaces its opposite number. At press time, the Aroon Down is much higher, indicating that Bitcoin will continue to fall.
Read More: What Is a Bitcoin ETF?
However, inflows in Bitcoin ETFs can invalidate this prediction. Last week, the financial products registered a net outflow, helping to put downward pressure on BTC’s price.
If capital flows into the products this week increase, Bitcoin will rebound. Another possible catalyst is retail participation and network growth. Compared to previous bull markets, the coin lacks these. The decreasing number of new unique addresses shows proof of this.
Should an influx of retail market participants start to buy BTC in large numbers, the price may not fall to $60,000. Instead, it may bounce to $66,000 or $67,000 in the short term.
Disclaimer
In line with the Trust Project guidelines, this price analysis article is for informational purposes only and should not be considered financial or investment advice. BeInCrypto is committed to accurate, unbiased reporting, but market conditions are subject to change without notice. Always conduct your own research and consult with a professional before making any financial decisions. Please note that our Terms and Conditions, Privacy Policy, and Disclaimers have been updated.


On Good Friday, over $2.2 billion worth of Bitcoin and Ethereum options contracts expire today.
It comes as crypto markets continue to reel from macroeconomic uncertainty. President Donald Trump is pressuring the Federal Reserve (Fed) to cut interest rates, but the chair, Jerome Powell, will not budge.
Over $2.2 Billion Options Expire Today
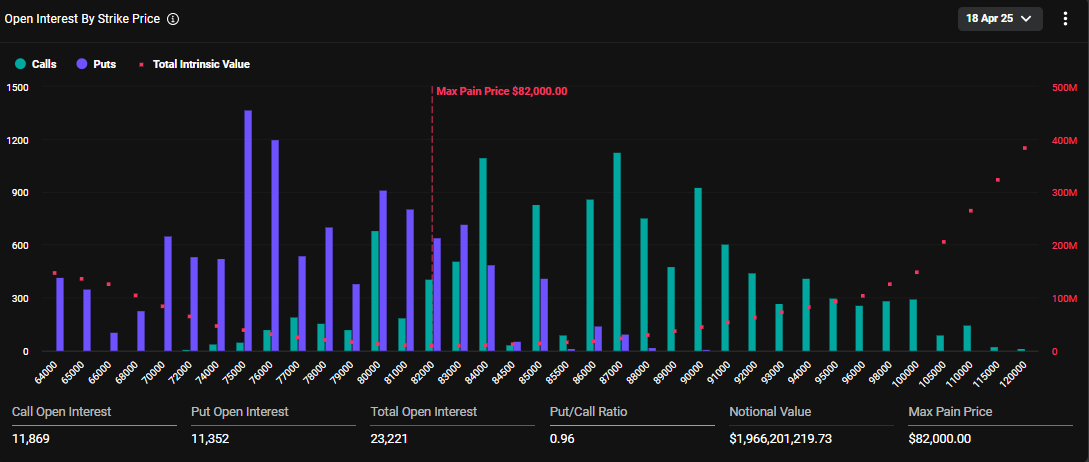
Today, April 18, amid Good Friday celebrations, 23,221 Bitcoin (BTC) options contracts will expire. The notional value for this Friday’s tranche of expiring Bitcoin options contracts is $1.966 billion, according to data on Deribit.
The put/call ratio is 0.96, suggesting a prevalence of purchase options (calls) over sales options (puts).
As the Bitcoin options expire, they have a maximum pain or strike price of $82,000; at this point, the asset will cause the greatest number of holders’ financial losses.
Similarly, crypto markets will witness the expiry of 177,130 Ethereum contracts, with a notional value of $279.789 million. The put-to-call ratio for these expiring Ethereum options is 0.84, with a maximum pain of $1,600.
This week’s options expiry event is slightly smaller than what crypto markets witnessed last week on Friday. As BeInCrypto reported, approximately $2.5 billion worth of BTC and ETH options expired then, with short-term dips bringing put demand.

Traders and investors must closely monitor today’s developments as options expiry could lead to price volatility. Nevertheless, put-to-call ratios below 1 for Bitcoin and Ethereum in options trading indicate optimism in the market. It suggests that more traders are betting on price increases.
Meanwhile, analysts at Deribit highlight low volatility and flat skew. While this suggests a calm market, historical data from CoinGlass suggests post-expiry price swings are common, potentially signaling an upcoming move.
“With volatility crushed and skew flat, is the market setting up for a post-expiry move?” they posed.
Blackswan Event Likely, Greeks.live Analysts Say
Analysts at Greeks.live shed light on current market sentiment, echoing the calm outlook. However, they note that the market is predominantly bearish to neutral. Traders expect continued choppy action before potentially revisiting $80,000 to $82,000.
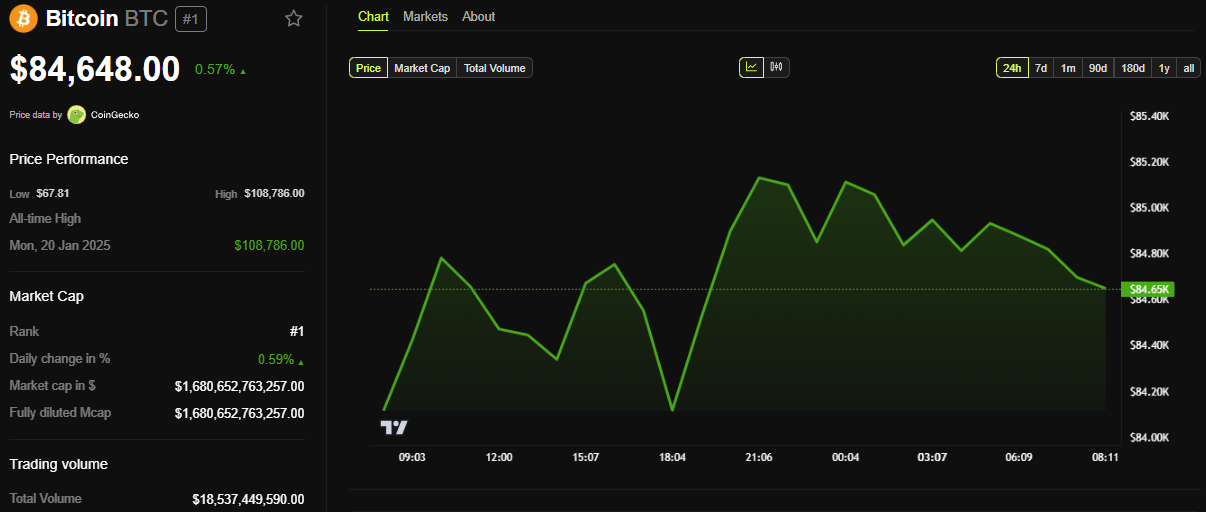
As of this writing, Bitcoin was trading for $84,648, slightly above its strike price of $82,000. Based on the Max Pain theory, prices will likely move toward this strike price as options near expiry.
Citing a mild sentiment, Greek.live analysts ascribe the calm to Trump not putting out a lot of news this week. Nevertheless, they anticipate more trade wars, heightened uncertainty, and volatility.
“We expect the trade and tariff wars to be far from over, and the uncertainty in the market will continue for a long time, as will the volatility in the market,” Greeks.live wrote.
They also ascribe the outlook to Powell’s comments, which created downward pressure as 100 bps rate cut expectations for the year were reduced. This led to crypto correlation with traditional markets.
Against this backdrop, Greeks.live says the probability of a black swan event is higher, where a rare, unexpected event that has a significant and often disruptive impact on the market occurs.
“…it is now a period of pain when the bulls have completely turned to bears, and investor sentiment is relatively low. In this worse market of bulls turning to bears, the probability of a black swan will be significantly higher,” they explained.
They urge traders to buy out-of-the-money (OTM) put options. An option is classified as out-of-the-money when its strike price is less favorable than the current market price of the underlying asset. This means it has no intrinsic value, only time value (the potential for it to become valuable before expiration).
Disclaimer
In adherence to the Trust Project guidelines, BeInCrypto is committed to unbiased, transparent reporting. This news article aims to provide accurate, timely information. However, readers are advised to verify facts independently and consult with a professional before making any decisions based on this content. Please note that our Terms and Conditions, Privacy Policy, and Disclaimers have been updated.


A quantum‑computing collective known as Project Eleven has thrown down a public gauntlet to the global cryptography community, offering a reward of one Bitcoin to the first team that can break a deliberately down‑scaled version of Bitcoin’s elliptic‑curve cryptography using a genuine quantum computer before 5 April 2026.
Announcing what it calls the “Q‑Day Prize” on X, the group wrote: “We just launched the Q‑Day Prize. 1 BTC to the first team to break a toy version of Bitcoin’s cryptography using a quantum computer. Deadline: April 5, 2026. Mission: Protect 6 M BTC (over $500 B).” The post crystallises a concern that has hovered over the Bitcoin ecosystem for more than a decade: the eventual arrival of large‑scale, error‑corrected quantum hardware capable of running Shor’s algorithm against real‑world keys.
Project Eleven is not asking contestants to shatter Bitcoin’s 256‑bit curve directly. Instead, teams must demonstrate Shor’s algorithm against elliptic‑curve keys ranging from one to twenty‑five bits—sizes derisively called “toy” by professional cryptographers but still orders of magnitude beyond what has been publicly achieved on physical quantum processors. The organisers argue that even a three‑bit break would be “big news,” because it would provide the first quantitatively verifiable benchmark of quantum progress on the elliptic‑curve discrete‑log problem (ECDLP). In their words, “Nobody has rigorously benchmarked this threat yet.”
To qualify, a submission must include gate‑level code or explicit instructions runnable on actual quantum hardware, along with a narrative of methods employed, error‑rates managed and the classical post‑processing required. Hybrid attacks that lean on classical shortcuts are disallowed. All entries will be published, a decision the group frames as an exercise in radical transparency: “Instead of waiting for breakthroughs to happen behind closed doors, we believe in facing this challenge head‑on, in a transparent and rigorous manner.”
Why 1 Bitcoin—And Why Now?
Bitcoin’s security ultimately rests on the hardness of the discrete‑logarithm problem over the secp256k1 curve. While classical attacks scale exponentially, Peter Shor’s 1994 quantum algorithm could in principle solve the problem in polynomial time, collapsing the cost from cosmic to merely gargantuan. Current research estimates that on the order of two thousand fully error‑corrected logical qubits—perhaps backed by millions of physical qubits—would be sufficient to threaten a 256‑bit key. Firms such as Google, IBM, IonQ and newcomer QuEra are racing to cross the four‑digit logical‑qubit threshold, though none has publicly demonstrated anything close to that capability today.
Project Eleven says its prize is intended less as a bounty and more as a diagnostic. More than ten million Bitcoin addresses, holding over six million coins, have already exposed their public keys through prior spending activity. If quantum technology crosses the critical threshold before those coins are migrated to post‑quantum addresses, the funds would be vulnerable to immediate theft. “Quantum computing is steadily progressing,” the group warns. “When that happens, we need to know.”
The initiative lands amid a flurry of quantum‑resilience proposals within the wider Bitcoin ecosystem. Earlier this month, a group of developers submitted the Quantum‑Resistant Address Migration Protocol (QRAMP), a Bitcoin Improvement Proposal that would orchestrate a network‑wide move to post‑quantum key formats. Because QRAMP would require a consensus‑breaking hard fork, its political prospects remain uncertain.
Separately, Canadian startup BTQ has pitched an exotic proof‑of‑work alternative called Coarse‑Grained Boson Sampling, which would substitute today’s hash‑based mining puzzles with photonic sampling tasks executed on quantum hardware. Like QRAMP, BTQ’s concept demands a hard fork and has yet to garner broad support.
From a technical standpoint, running even a five‑bit elliptic‑curve version of Shor’s algorithm is brutally unforgiving: qubits with fidelities above 99.9 %, coherent for hundreds of microseconds, and orchestrated through deep circuits numbering in the thousands of two‑qubit gates would be required. Error‑correction overhead further compounds the engineering burden, meaning that contenders will likely have to employ small‑code logical qubits and impressive compilation techniques merely to keep noise under control.
Yet the prize may prove irresistible for university labs and corporate R&D teams eager to demonstrate practical quantum advantage. Cloud‑accessible devices from IBM’s Quantum System Two, Quantinuum’s H‑series and OQC’s superconducting platforms already allow limited, pay‑per‑shot access to dozens—or in IBM’s case, hundreds—of physical qubits. Whether any of those machines can sustain the circuit depth necessary remains to be seen.
Either outcome supplies invaluable data. In the words of Project Eleven’s launch tweet, the objective is stark: “Break the biggest ECC key with Shor’s algorithm. The reward: 1 BTC + go down in cryptography history.”
At press time, BTC traded at $84,771.
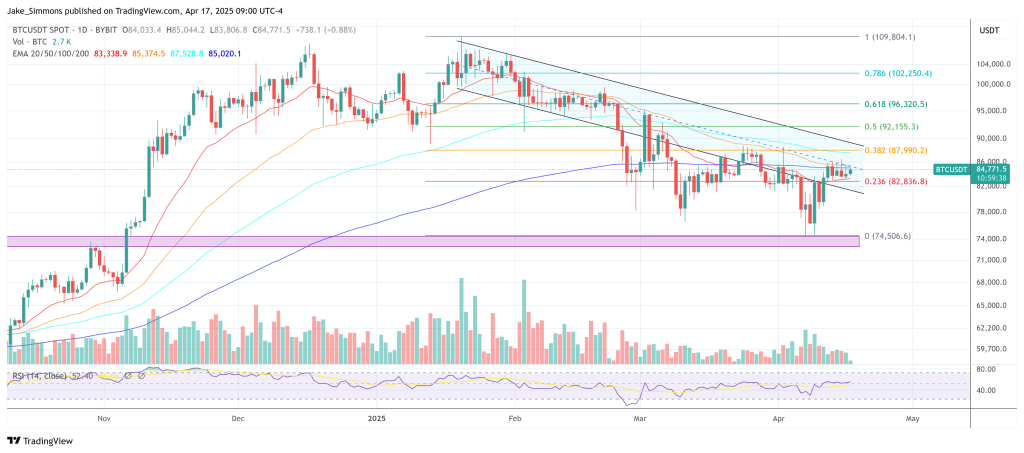
Featured image created with DALL.E, chart from TradingView.com
Editorial Process for bitcoinist is centered on delivering thoroughly researched, accurate, and unbiased content. We uphold strict sourcing standards, and each page undergoes diligent review by our team of top technology experts and seasoned editors. This process ensures the integrity, relevance, and value of our content for our readers.


Former US Securities and Exchange Commission (SEC) Chair Gary Gensler has stated that Bitcoin (BTC) could continue to exist and thrive for a long time.
However, Gensler emphasized that this may not be the case for most altcoins, as they lack solid fundamentals.
Why Gary Gensler Believes in Bitcoin
In a recent interview with CNBC, Gensler mentioned that Bitcoin’s enduring presence could be attributed to its strong global interest.
“Something like Bitcoin may persist for a long time because there’s 7 billion people around the globe, a real keen interest in it,” he stated.
Gensler, who served as SEC Chair from 2021 to 2025, made these remarks in response to questions about the crypto industry’s reaction to the dismissal of lawsuits and investigations initiated during his tenure.
While at the SEC, Gensler took a hard stance on cryptocurrency regulation. He launched multiple enforcement actions targeting several exchanges, token issuers, and other crypto entities.
While he refrained from commenting directly on the dismissal of these cases, he shifted focus to broader trends within the cryptocurrency market.
“I’m going to step back a little bit from any individual cases and just say this again to your viewing public. This is a very small part of the financial markets, but if you were interested in this, think about every financial asset sort of trades on a bit of fundamentals and sentiment. But this field is almost 99, or maybe one might say 100% sentiment and very little on fundamentals,” said Gensler.
The former SEC chair advocated for careful asset risk assessment. He noted that the primary focus should be the project’s fundamentals. Moreover, he warned that many assets are driven predominantly by sentiment. As a result, he suggested that such tokens are generally unsustainable and likely to lose value over time.
When pressed on whether Bitcoin should be grouped with other cryptocurrencies, Gensler drew an analogy to precious metals. He implied that Bitcoin holds a unique position in the cryptocurrency world.
“There’s only two or three precious metals. We humans have a certain fascination with two or three precious metals like gold,” he remarked.
Gensler believes that the vast majority of cryptocurrencies, especially those driven by trends, memes, or social sentiment, will not attract lasting interest. He stressed that only a few, like Bitcoin, will stand the test of time.
These comments align with Gensler’s previous statements on the crypto market. In a January 2025 interview with CNBC, he acknowledged BTC’s volatility yet showed faith in its long-term prospects.
“With 7 billion people around the globe, 7 billion people want to trade it just like we do have gold for 10,000 years. We have Bitcoin. It might be something else in the future as well,” Gensler noted.
Despite the optimistic outlook, Gensler disclosed that he did not own any Bitcoin or other crypto assets.
Gensler’s remarks reflect ongoing debates about the legitimacy and sustainability of cryptocurrencies. While Bitcoin has gained traction as a store of value, many altcoins struggle to demonstrate the same level of acceptance.
Disclaimer
In adherence to the Trust Project guidelines, BeInCrypto is committed to unbiased, transparent reporting. This news article aims to provide accurate, timely information. However, readers are advised to verify facts independently and consult with a professional before making any decisions based on this content. Please note that our Terms and Conditions, Privacy Policy, and Disclaimers have been updated.

HashKey Launches First XRP Tracker Fund With Ripple’s Backing

Circle Introduces On-Chain Refund Protocol to Strengthen USDC Payments

What Good Friday Options Expiry Means for Bitcoin & Ethereum

Ethereum Fee Plunges To 5-Year Low—Is This A Bottom Signal?

Dogecoin (DOGE) Under Pressure—Bearish Setup Could Trigger Sell-Off

Quantum Researchers Offer 1 Bitcoin To Break ‘Toy Version’

2.52 Million Altcoins Are Ruining Crypto’s Future

Animoca Brands Valuation Tanks 75% In Two Years, Here’s Why

Crypto exchange BingX hacked for $43 million

Are The Big Players Losing Interest?

Hong Kong’s Securities Association Tips Authorities On Crypto Self-Regulation

Coinbase cbBTC Set to go Live on Solana
2.52 Million Altcoins Are Ruining Crypto’s Future
Animoca Brands Valuation Tanks 75% In Two Years, Here’s Why
Crypto exchange BingX hacked for $43 million
Are The Big Players Losing Interest?
Hong Kong’s Securities Association Tips Authorities On Crypto Self-Regulation
Coinbase cbBTC Set to go Live on Solana
-
 Altcoin23 hours ago
How Rising Solana Network Inflows Could Drive SOL Price to $150?
-
Bitcoin22 hours ago
Gary Gensler Explains Why Bitcoin Will Outlast Altcoins
-

 Market22 hours ago
Bitcoin Whales Withdraw $280 Million: Bullish Signal?
-

 Altcoin14 hours ago
CZ Honors Nearly $1 Billion Token Burn Promise
-

 Market23 hours ago
XRP’s $2.00 Pivot Point—A Launchpad or Breakdown Zone?
-

 Market14 hours ago
Over $700 Million In XRP Moved In April, What Are Crypto Whales Up To?
-
 Altcoin22 hours ago
How Crypto Traders Made $666K from $4.5K in One Trade?
-

 Market20 hours ago
Expanding Blockspace and Enhancing Privacy