
Bitcoin
Bitcoin (BTC) Price Jumps 7.5% in 24 Hours: Key Factors Behind the Surge
Bitcoin (BTC) closed the daily candle with a robust 7.5% gain, signaling strong bullish momentum.
Let’s examine why the $60,000 price has been a crucial entry point for investors and traders.
Bitcoin Price Analysis: Breaking Down Key Technical Indicators
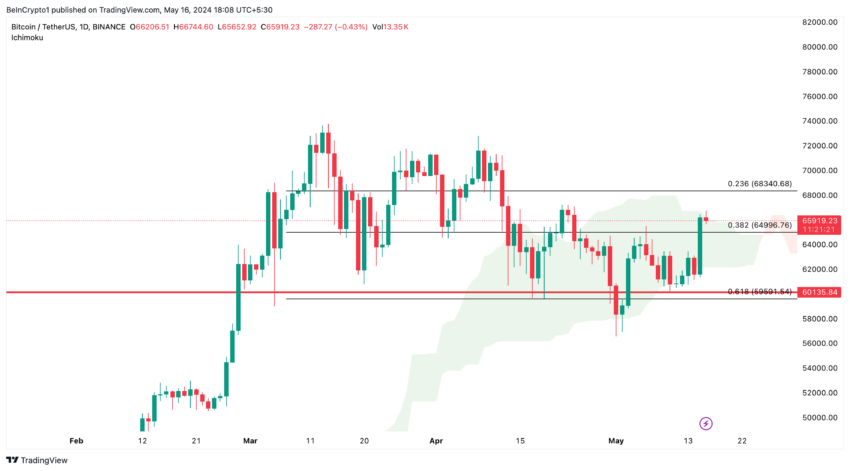
The price is currently navigating within the daily Ichimoku Cloud, a critical technical indicator of market sentiment. A breakout above the cloud’s upper boundary would signify a potential continuation of the upward trend.
Conversely, the cloud’s lower boundary around $62,000 and the 0.618 Fibonacci retracement level at $60,135 provide strong support levels.
The chart shows that the price has tested the $60,000 level multiple times, establishing it as a strong support. Let’s explore the reasons behind this.
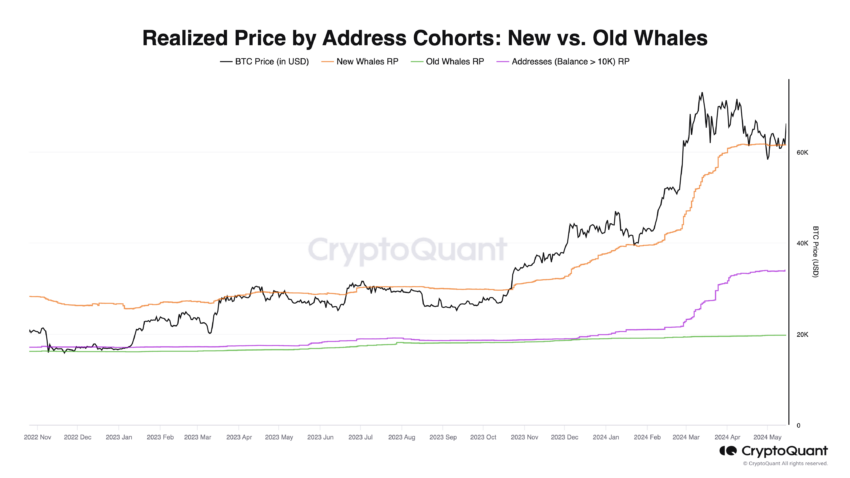
Realized Price by Address Cohorts: New vs. Old Whales:
- New Whales’ Realized Price: New whales—addresses holding over 1,000 BTC with a coin detention time of less than 6 months—have been significantly accumulating Bitcoin around the $60,000 mark. This buying activity is crucial, solidifying $60,000 as a major support level. The continuous accumulation at this price demonstrates strong confidence among new whales, reinforcing the support level for Bitcoin’s price. The average acquisition price, or realized price, of these new whales, indicates that each Bitcoin they have bought was, on average, acquired at $60,000.
- Old Whales’ Realized Price: Long-term whales, holding more than 1,000 BTC for over 6 months, have a stable realized price. This stability reflects their confidence and lower turnover, suggesting a strategic long-term investment approach.
Read More: Who Owns the Most Bitcoin in 2024?
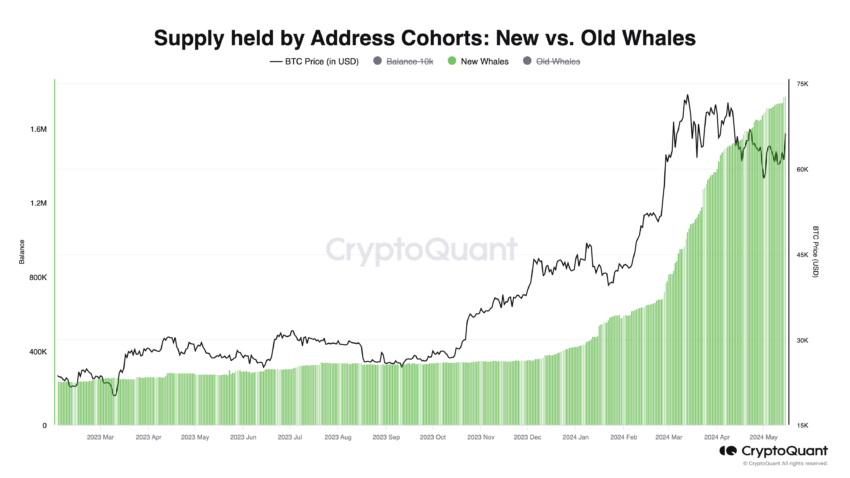
Supply Held by New Bitcoin Whales:
- Accumulation Trend: The graph shows a sustained increase in the supply held by new whales. Indicating their active accumulation over the past month. This trend aligns with significant price increases, suggesting a correlation between their buying activity and upward price momentum.
- Market Confidence: New whales consistently accumulate, even during price corrections. This underscores their bullish outlook and reinforces $60,000 as a critical support level. This behavior indicates that new whales view current levels as attractive entry points, contributing to market stability and potential upward movement.
Bitcoin’s upward momentum is strongly supported by the aggressive rise in supply held by new whales. A cohort of large holders who have significantly increased their accumulation. This trend is evident as the realized price for these new whales is a major support level.
Bitcoin consistently marks $60,000 as a critical threshold. Each time Bitcoin hits this price, new whales step in to accumulate, reinforcing $60,000 as a robust support level and underpinning Bitcoin’s continued rise.
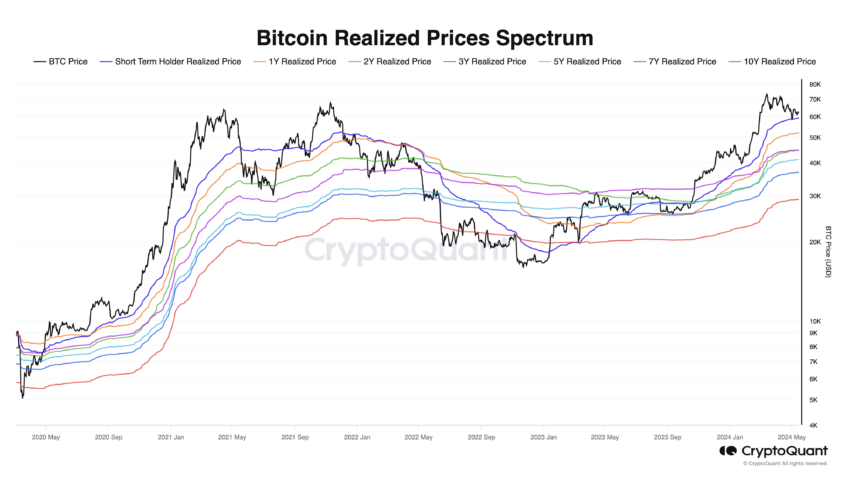
Bitcoin Realized Prices Spectrum
The realized price spectrum is a crucial tool for navigating bull markets. Providing insights into average acquisition prices across different holder cohorts. The short-term holders’ realized price, representing the average acquisition price for short-term holders, is acting as a support level, effectively timing market lows during this bull market.
The realized price spectrum helps monitor Bitcoin’s risk during market cycles. Currently, Bitcoin’s price is trading above all realized prices in the spectrum, which is a bullish signal indicative of a strong upward trend.
This positioning highlights market confidence and potential for further gains.
Read more: Bitcoin Price Prediction 2024/2025/2030
Strategic Recommendations Amid Bitcoin’s Influence
- Bullish Outlook: The outlook for Bitcoin remains bullish. This assessment is based on recent price movements and the underlying support levels formed by new whale accumulations.
- Conditional Support at $60,000: Bitcoin has strong conditional support at the $60,000 level. This support is primarily due to new whales, who have been consistently accumulating Bitcoin at this price point, reinforcing it as a significant threshold.
- Price Projections and Recommendations: If Bitcoin breaks above the daily Ichimoku Cloud, we could see prices reach the $78,000 to $80,000 range in the mid-term. However, this bullish projection is contingent upon several factors: – Continued accumulation of new whales.
– Miners refrain from selling off their holdings, as they are currently profitable.
– Absence of adverse macroeconomic or geopolitical events that could disrupt the bullish momentum.
The post Bitcoin (BTC) Price Jumps 7.5% in 24 Hours: Key Factors Behind the Surge appeared first on BeInCrypto.


Bitcoin’s (BTC) market dominance has surged to 64%, reaching its highest level in over four years.
However, experts remain divided on what this means for the future. Some predict an impending altcoin season, and others caution that Bitcoin’s dominance could continue to suppress altcoins.
What Does Bitcoin’s Rising Dominance Mean?
For context, Bitcoin dominance (BTC.D) refers to the percentage of the total cryptocurrency market capitalization that BTC holds. It is a key indicator of Bitcoin’s market strength relative to other cryptocurrencies. A rising dominance suggests that Bitcoin is outperforming altcoins, while a decrease may signal growing interest or investment in other digital assets.
The metric has been steadily increasing since late 2022. As of the latest data, it surged to 64%, marking highs last seen in early 2021.

Notably, Benjamin Cowen, founder of Into The Cryptoverse, highlighted that the number is much higher when excluding stablecoins.
“Excluding stable coins, Bitcoin dominance is now at 69%,” Cowen revealed.
The rise in Bitcoin dominance has sparked debate among analysts about its implications for altcoins. Cowen believes there will be a correction or downward movement in altcoins before any substantial gains can be expected in the market. This implies that the altcoin season may not be imminent yet.
“I think ALT/ BTC pairs need to go down before they can go up,” he stated.
Nordin, founder of Nour Group, also expressed caution. He stressed that Bitcoin dominance is nearing the levels seen during the peak of the 2020 bear market.
“This isn’t just a BTC move. Its capital rotating out of alts,” he noted.
Moreover, Nordin warned that a break above 66% could intensify selling pressure on altcoins. This, in turn, could delay the altcoin season.
“Bitcoin dominance back to 64%. No Alt seasons in 2024 or 2025,” analyst, Alessandro Ottaviani, predicted.
On the other hand, analyst Mister Crypto predicts that Bitcoin’s dominance may follow a long-term descending triangle pattern. A descending triangle typically suggests bearish momentum, where the price or dominance gradually decreases as lower highs are formed.
However, this could prolong its market control before a broader correction allows altcoins to gain traction.
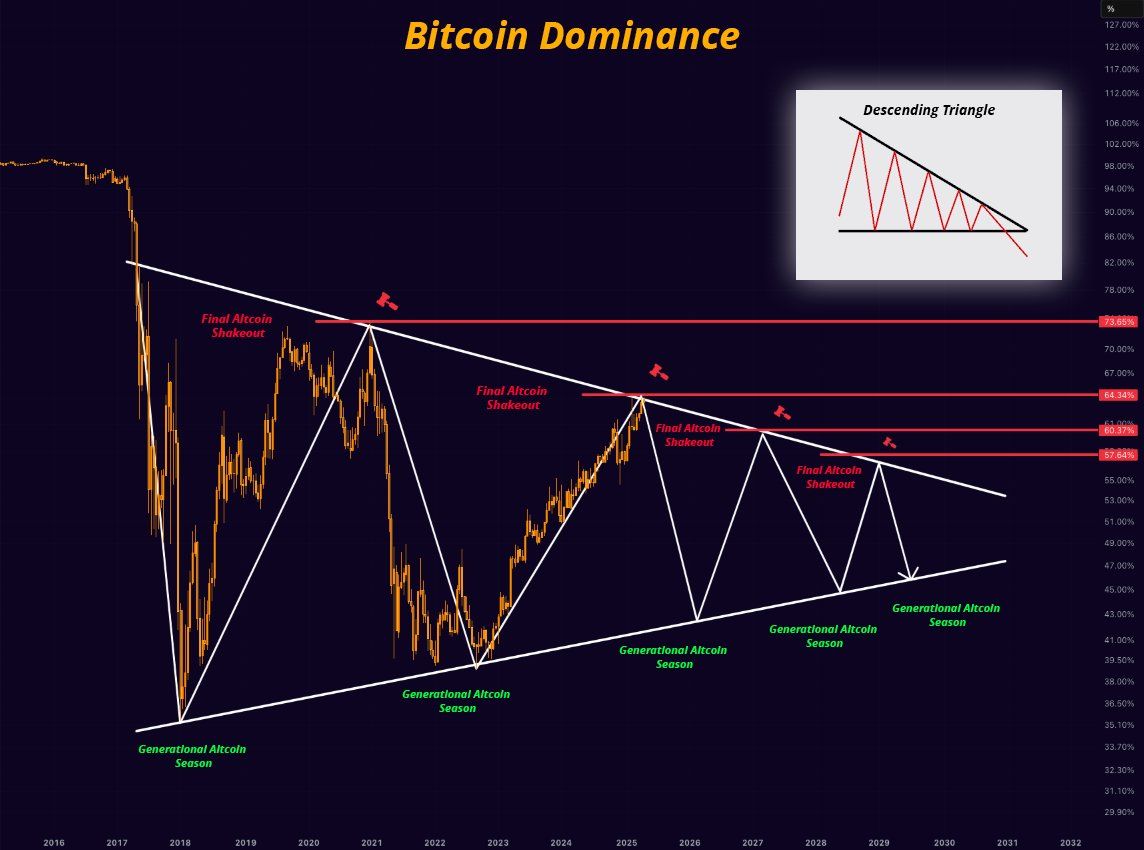
Another analyst mentioned that Bitcoin dominance is currently testing the resistance zone between 64% and 64.3%. Therefore, a possible retracement may be on the horizon. Should this retracement occur, altcoins could begin to gain traction, with some potentially emerging as top performers in the market as capital shifts away from Bitcoin.
“However, a breakout from this zone could mean further declines for alts,” the analyst remarked.
Finally, Junaid Dar, CEO of Bitwardinvest, offered a more optimistic view. According to Dar’s analysis, if Bitcoin’s dominance drops below 63.45%, it could trigger a strong upward movement in altcoins. This, he believes, would create an ideal opportunity to profit from altcoin positions.
“For now, alts are stuck. Just a matter of time,” Dar added.
Tether Dominance Signals Potential Altcoin Season
Meanwhile, many analysts believe that the trends in Tether dominance (USDT.D) signal a potential altcoin season. From a technical analysis standpoint, USDT.D has reached a resistance zone and may be due for a correction, suggesting the possibility of capital flowing from USDT into altcoins.
“The USDTD is in a rejection zone, as long as it does not close above 6.75% it will be favorable for the market,” a technical analyst wrote.
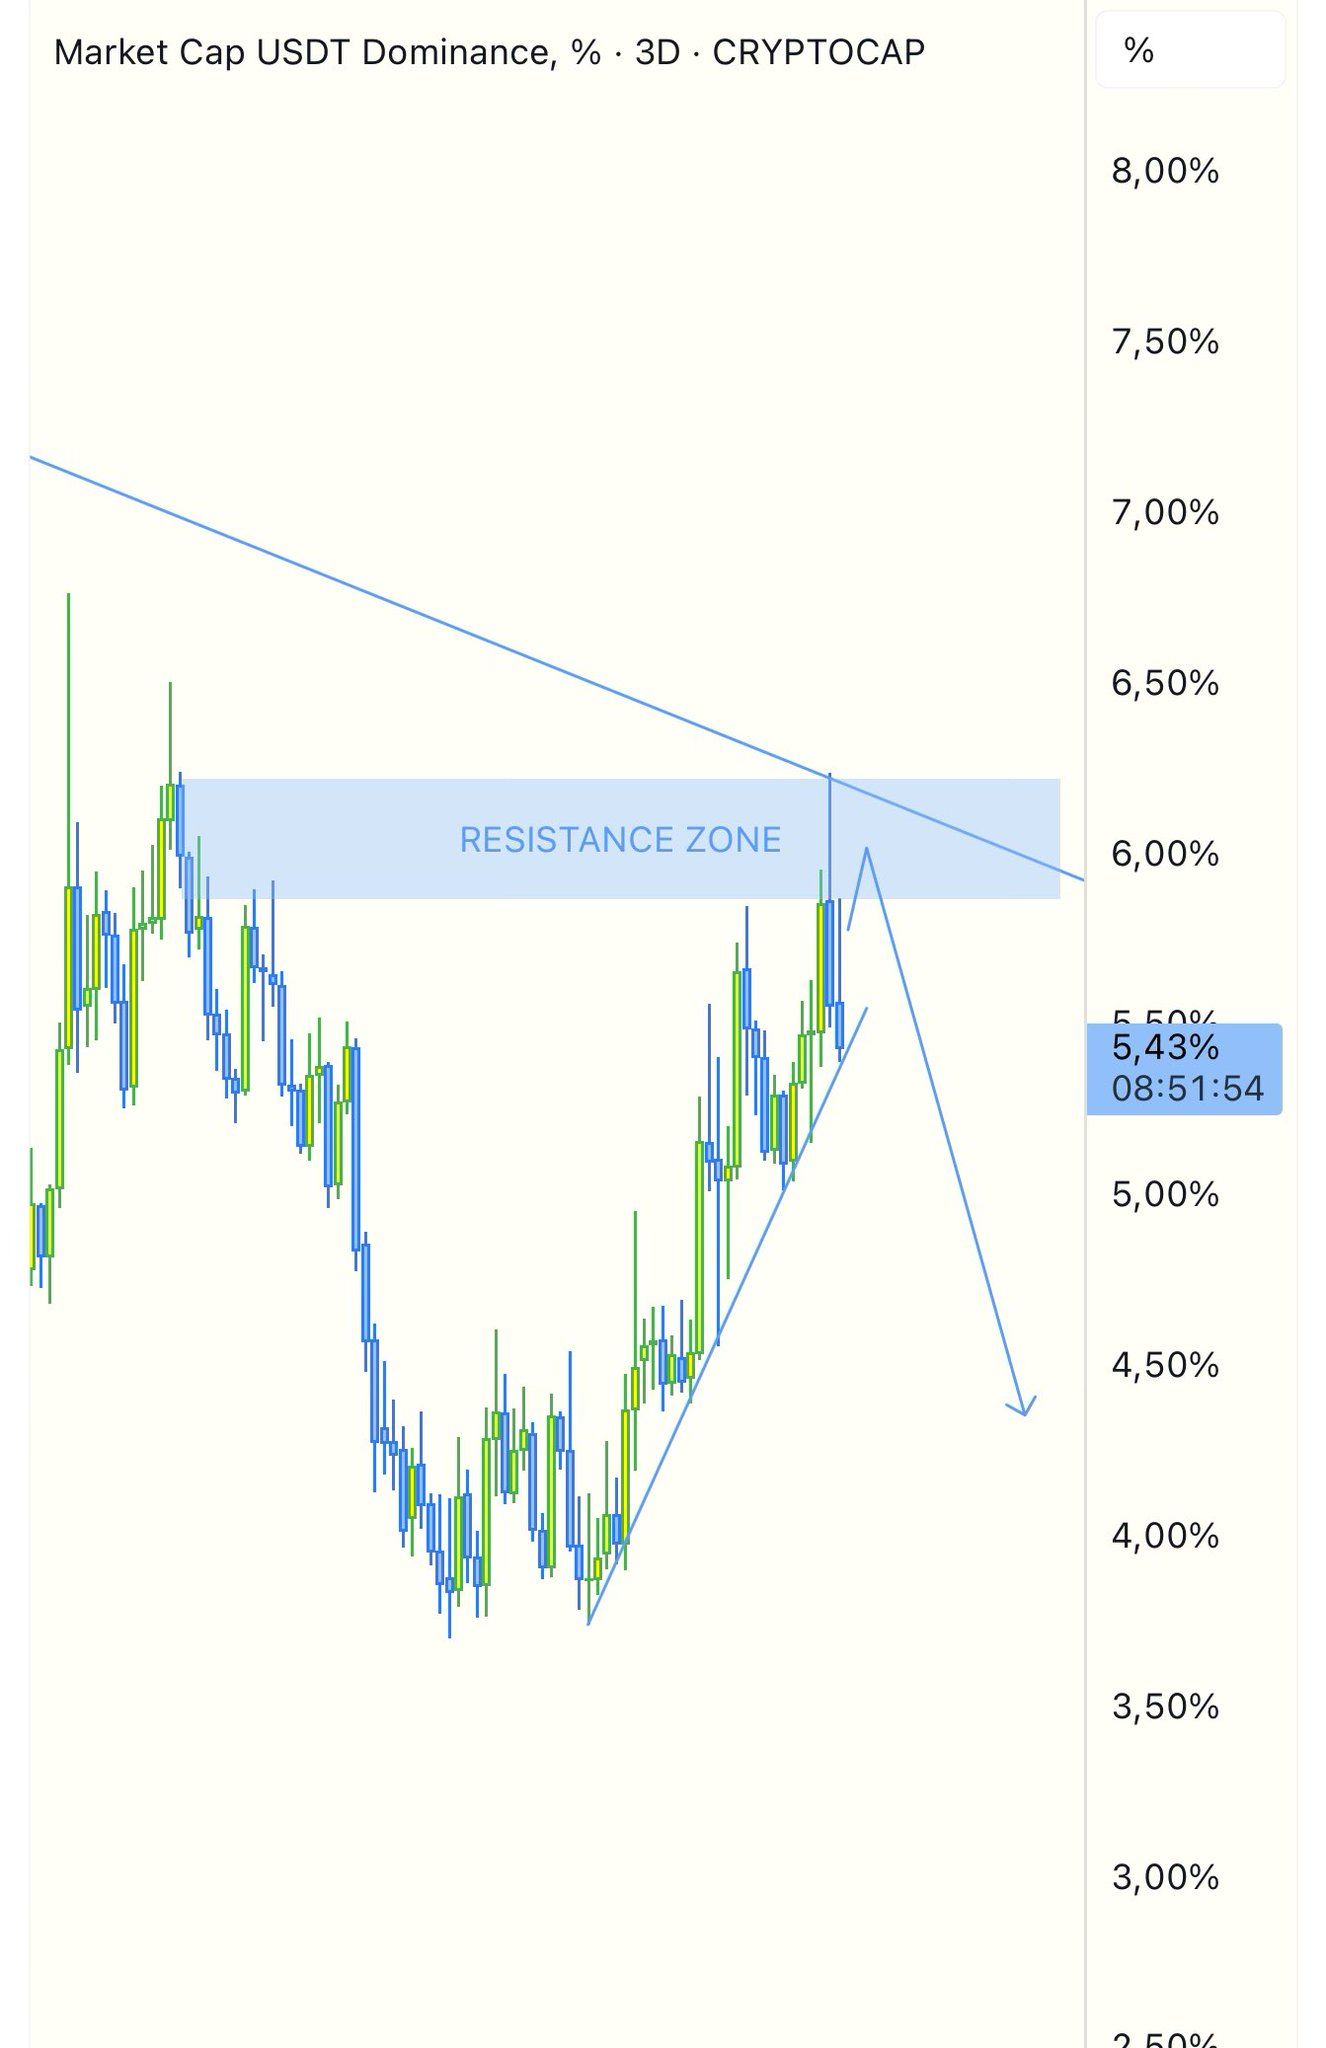
Another analyst also stressed that the USDT.D and USD Coin dominance (USDC.D) have reached resistance, forecasting an incoming altcoin season. Doğu Tekinoğlu drew similar conclusions by observing the combined chart of BTC.D, USDT.D, and USDC.D.
As Bitcoin’s dominance climbs, investors are closely monitoring these technical and on-chain signals. The interplay between Bitcoin’s strength and stablecoin dynamics could dictate whether altcoins stage a comeback this summer or face further consolidation. For now, Bitcoin’s grip on the market remains firm.
Disclaimer
In adherence to the Trust Project guidelines, BeInCrypto is committed to unbiased, transparent reporting. This news article aims to provide accurate, timely information. However, readers are advised to verify facts independently and consult with a professional before making any decisions based on this content. Please note that our Terms and Conditions, Privacy Policy, and Disclaimers have been updated.

Babylon, a platform enabling native Bitcoin (BTC) staking, recorded a notable unstaking event on April 17. Approximately $1.26 billion worth of BTC was withdrawn from the protocol.
The move resulted in a significant decline in Babylon’s total value locked (TVL). Moreover, the price of its native token, BABY, also dipped.
Babylon’s TVL Drops 32% After Massive BTC Unstaking
Blockchain analytics firm Lookonchain alerted users about the unstaking on X (formerly Twitter).
“About 5 hours ago, 14,929 BTC($1.26 billion) was unstaked from Babylon,” the post read.
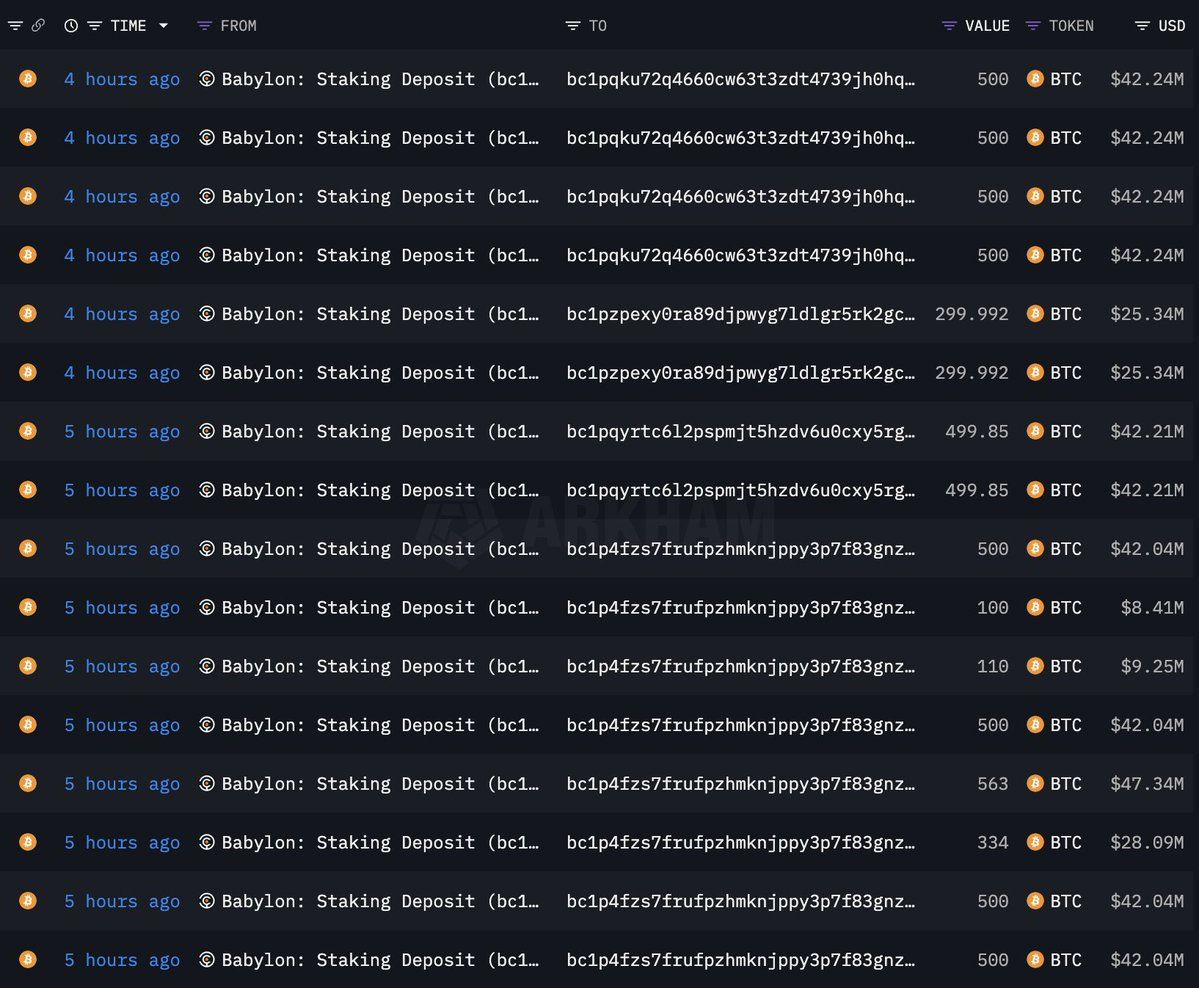
This move triggered a sharp drop in the platform’s TVL. According to data from DefiLama, Babylon’s TVL dropped from $3.9 billion to $2.6 billion in just a day, representing a decline of 32.7%. Moreover, only 31,502 BTC remain staked in the protocol at press time.
That’s not all. The BABY token was also not immune to market pressures. According to BeInCrypto data, the token depreciated by 9.8% over the past day alone. At the time of writing, the altcoin was trading at $0.8.

The unstaking led to widespread speculation about the platform’s stability and the broader implications for Bitcoin-based decentralized finance (DeFi) protocols.
“What’s going on. I don’t waste my time partaking in staking BTC, but this can be concerning. You don’t just see so much unstaking in such a short window,” a user said.
Nonetheless, Lombard Finance quickly moved to calm investor concerns. The Bitcoin restaking protocol, built on Babylon, clarified that the withdrawal was part of a planned transition to a new set of finality providers.
“To carry out the transition to our new set of Finality Providers, the Lombard Protocol has begun the process of unstaking BTC from the Lombard Finality Provider,” Lombard Finance stated.
The post emphasized that this process was a necessary step in the evolution of the platform. In addition, the company reassured investors that the withdrawn funds are expected to be restaked once the unbonding process concludes.
The unstaking event follows closely on the heels of Babylon’s airdrop earlier this month. 600 million BABY tokens—representing 6% of the token’s total supply—were distributed to early adopters, including Phase 1 stakers, Pioneer Pass NFT holders, and contributing developers.
Shortly after the airdrop, $21 million worth of Bitcoin was unstaked within 24 hours. This suggests a pattern of capital withdrawal that has intensified with the latest event.
Disclaimer
In adherence to the Trust Project guidelines, BeInCrypto is committed to unbiased, transparent reporting. This news article aims to provide accurate, timely information. However, readers are advised to verify facts independently and consult with a professional before making any decisions based on this content. Please note that our Terms and Conditions, Privacy Policy, and Disclaimers have been updated.
On Good Friday, over $2.2 billion worth of Bitcoin and Ethereum options contracts expire today.
It comes as crypto markets continue to reel from macroeconomic uncertainty. President Donald Trump is pressuring the Federal Reserve (Fed) to cut interest rates, but the chair, Jerome Powell, will not budge.
Over $2.2 Billion Options Expire Today
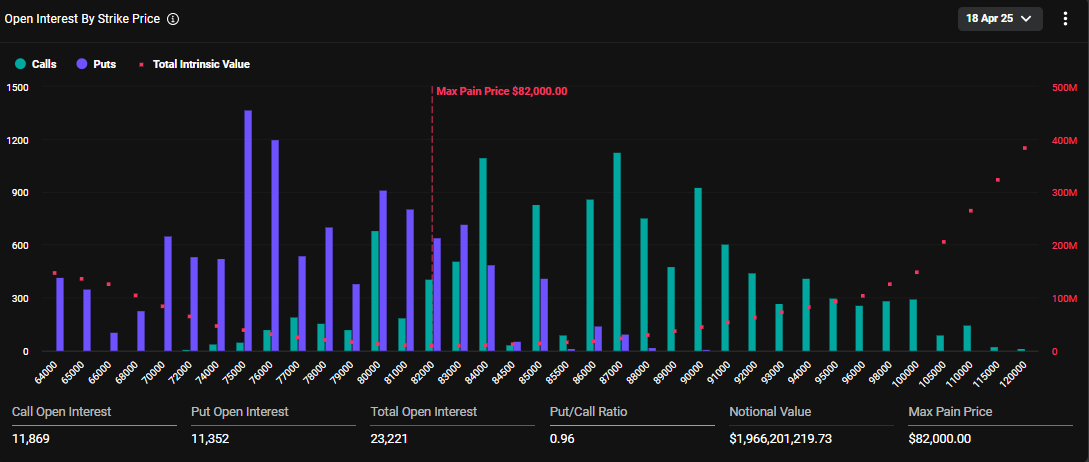
Today, April 18, amid Good Friday celebrations, 23,221 Bitcoin (BTC) options contracts will expire. The notional value for this Friday’s tranche of expiring Bitcoin options contracts is $1.966 billion, according to data on Deribit.
The put/call ratio is 0.96, suggesting a prevalence of purchase options (calls) over sales options (puts).
As the Bitcoin options expire, they have a maximum pain or strike price of $82,000; at this point, the asset will cause the greatest number of holders’ financial losses.
Similarly, crypto markets will witness the expiry of 177,130 Ethereum contracts, with a notional value of $279.789 million. The put-to-call ratio for these expiring Ethereum options is 0.84, with a maximum pain of $1,600.
This week’s options expiry event is slightly smaller than what crypto markets witnessed last week on Friday. As BeInCrypto reported, approximately $2.5 billion worth of BTC and ETH options expired then, with short-term dips bringing put demand.

Traders and investors must closely monitor today’s developments as options expiry could lead to price volatility. Nevertheless, put-to-call ratios below 1 for Bitcoin and Ethereum in options trading indicate optimism in the market. It suggests that more traders are betting on price increases.
Meanwhile, analysts at Deribit highlight low volatility and flat skew. While this suggests a calm market, historical data from CoinGlass suggests post-expiry price swings are common, potentially signaling an upcoming move.
“With volatility crushed and skew flat, is the market setting up for a post-expiry move?” they posed.
Blackswan Event Likely, Greeks.live Analysts Say
Analysts at Greeks.live shed light on current market sentiment, echoing the calm outlook. However, they note that the market is predominantly bearish to neutral. Traders expect continued choppy action before potentially revisiting $80,000 to $82,000.
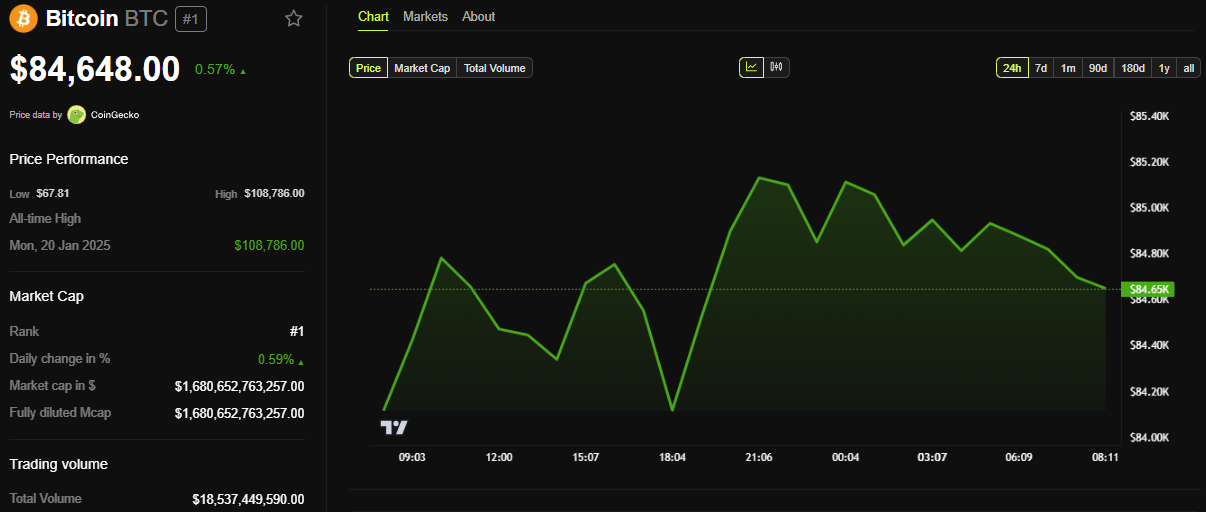
As of this writing, Bitcoin was trading for $84,648, slightly above its strike price of $82,000. Based on the Max Pain theory, prices will likely move toward this strike price as options near expiry.
Citing a mild sentiment, Greek.live analysts ascribe the calm to Trump not putting out a lot of news this week. Nevertheless, they anticipate more trade wars, heightened uncertainty, and volatility.
“We expect the trade and tariff wars to be far from over, and the uncertainty in the market will continue for a long time, as will the volatility in the market,” Greeks.live wrote.
They also ascribe the outlook to Powell’s comments, which created downward pressure as 100 bps rate cut expectations for the year were reduced. This led to crypto correlation with traditional markets.
Against this backdrop, Greeks.live says the probability of a black swan event is higher, where a rare, unexpected event that has a significant and often disruptive impact on the market occurs.
“…it is now a period of pain when the bulls have completely turned to bears, and investor sentiment is relatively low. In this worse market of bulls turning to bears, the probability of a black swan will be significantly higher,” they explained.
They urge traders to buy out-of-the-money (OTM) put options. An option is classified as out-of-the-money when its strike price is less favorable than the current market price of the underlying asset. This means it has no intrinsic value, only time value (the potential for it to become valuable before expiration).
Disclaimer
In adherence to the Trust Project guidelines, BeInCrypto is committed to unbiased, transparent reporting. This news article aims to provide accurate, timely information. However, readers are advised to verify facts independently and consult with a professional before making any decisions based on this content. Please note that our Terms and Conditions, Privacy Policy, and Disclaimers have been updated.

Cardano Price To Hit $4 If This Happens, Analyst Says Despite 180M ADA Dump

XRP Consolidation About To Reach A Bottom, Wave 5 Says $5.85 Is Coming

Chainlink Price To Hit $26 If LINK Breaks Past This Crucial Level

Despite an 18% Drop, XRP’s Exchange Supply Hits Lows—Bullish Setup Ahead?

Lorenzo Protocol (BANK) Price Rallies 150% After This Binance Announcement

Matchain’s Petrix Barbosa Talks the Future of Digital Identity

2.52 Million Altcoins Are Ruining Crypto’s Future

Animoca Brands Valuation Tanks 75% In Two Years, Here’s Why

Crypto exchange BingX hacked for $43 million

Are The Big Players Losing Interest?

Hong Kong’s Securities Association Tips Authorities On Crypto Self-Regulation

Coinbase cbBTC Set to go Live on Solana
2.52 Million Altcoins Are Ruining Crypto’s Future
Animoca Brands Valuation Tanks 75% In Two Years, Here’s Why
Crypto exchange BingX hacked for $43 million
Are The Big Players Losing Interest?
Hong Kong’s Securities Association Tips Authorities On Crypto Self-Regulation
Coinbase cbBTC Set to go Live on Solana
-

 Market13 hours ago
MEME Rallies 73%, BONE Follows
-

 Market24 hours ago
Vietnam Partners with Bybit to Launch Legal Crypto Exchange
-
 Market23 hours ago
100 Million Tokens Could Trigger Decline
-
 Altcoin20 hours ago
Ethereum ETFs Record $32M Weekly Outflow; ETH Price Crash To $1.1K Imminent?
-

 Market12 hours ago
Pi Network Roadmap Frustrates Users Over Missing Timeline
-

 Ethereum18 hours ago
Ethereum Price Stalls In Tight Range – Big Price Move Incoming?
-

 Market11 hours ago
Solana (SOL) Price Rises 13% But Fails to Break $136 Resistance
-
 Market18 hours ago
How $31 Trillion in US Bonds Could Impact Crypto Markets in 2025