
Bitcoin
Bitcoin (BTC) Liquidations Loom as Price Targets $68,000
Bitcoin (BTC) has consistently performed well in the last few days, as the price has increased by 10.77% within the previous week. While this is good news for some traders, others risk losing money if the coin sustains the uptrend.
This analysis pinpoints the potential price levels BTC can reach and the trend’s impact on open positions in the derivatives market.
Bitcoin’s Recent Ride Threatens Shorts Expectations
In the last 24 hours, Bitcoin has fluctuated between $65,000 and a little above the $66,000 range—currently, the price trades at $65,302. But before that, BTC reached $66,250 and then fell again.
However, according to data from Coinglass, short positions risk liquidations worth up to $1.32 billion if BTC hits $68,066.
This is according to the liquidation heatmap. For those unfamiliar with the terminology, liquidation occurs when an exchange closes a trader’s position due to insufficient margin balance to keep the contract open.
While this is done to prevent further losses, the action could also be due to high volatility as the price moves in the opposite direction of the trader’s prediction.
Specifically, longs are those betting on a price increase, while shorts are traders aligned with a decrease.
Read More: 7 Best Crypto Exchanges in the USA for Bitcoin (BTC) Trading
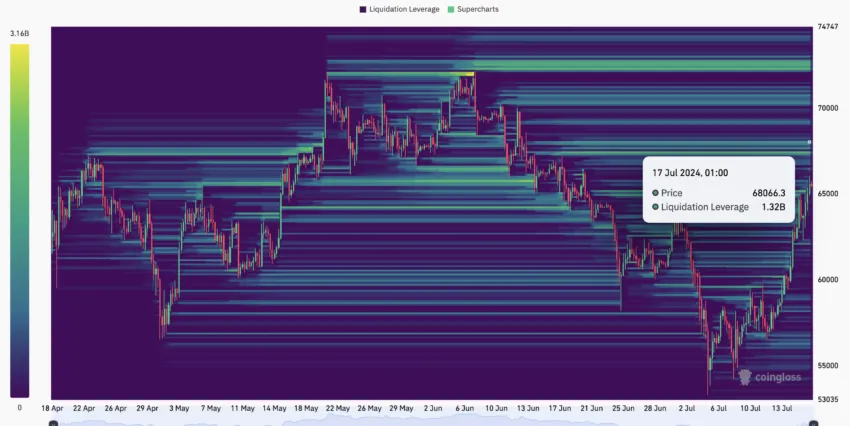
Therefore, the image above shows how much shorts will lose once Bitcoin reaches the above price. Further, the heatmap identifies zones where large-scale liquidation might occur and zones where there is a high concentration of liquidity.
If liquidity is concentrated in a particular area, the crypto price will likely move toward that region. According to data obtained from Coinglass, Bitcoin’s price may approach $67,469 and then $68,000.
Should the coin clear these regions, the next area of interest will be $72,599, bringing it closer to its All-Time High (ATH).
Major Players Cease Bitcoin Sell-Off
Apart from the heatmap, the massive inflow into the Bitcoin ETFs this week is another piece of data supporting a price increase. The significant flow of capital into these products played a huge role in Bitcoin’s surge to its ATH in March.
The dearth of liquidity in this aspect was also vital to the downturn experienced in the second quarter (Q2). Therefore, BTC may see a sustained upswing if more money continues flowing into the ETFs.
Concerning this development, analyst Timothy Peterson opined that BTC could hit $71,000 soon.
“Cumulative Net ETF Flows reached a new ATH last week. This is the second metric I have that prices Bitcoin at $71k. This marks 6 consecutive days of positive inflows totaling $1+ billion. This does not include today’s presumably whopping inflows.” He stated on X.
From an on-chain perspective, the Accumulation Trend Score shows that Bitcoin has exited the distribution phase. The trend score ranges from 0 to 1, providing insights into the behavior of the market’s large entities.
If the Accumulation Trend Score rating is close to 0, it means that, on average, market participants are selling.
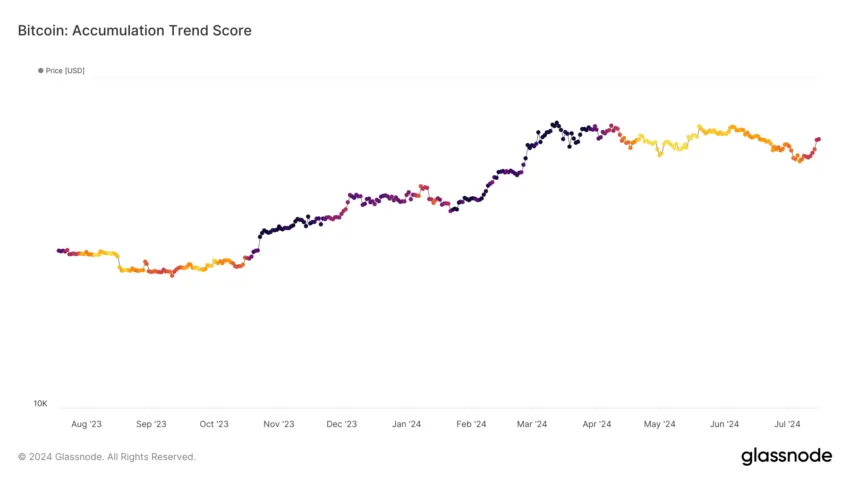
This is evident from the trend between April and June. However, at press time, the score is 0.55, indicating that the size of coins purchased on-chain is increasing.
BTC Price Prediction: Bullish Trend Confirmed
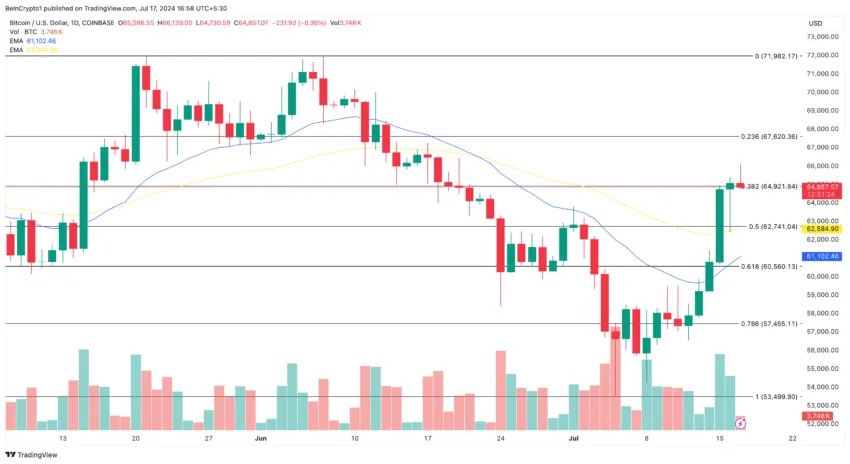
According to the daily chart, Bitcoin confirmed the bullish trend after the price rose above the 20 (blue) and 50 (yellow) EMAs.
EMA stands for Exponential Moving Average and shows trend direction over some time. If the EMA is above the price, the trend is bearish.
However, since it is the other way around, it is bullish for BTC, suggesting that the price can trade higher. If sustained, the next price Bitcoin will reach could be around $68,235, as shown below.
In addition, the spot Cumulative Volume Delta (CVD) is positive. The CVD displays the net difference between buying and selling volume. When it is negative, it means that the BTC sold is higher than the amount bought.
Hence, the positive value implies that market participants have been buying more Bitcoin volume since July 13. This is also reiterated by the Moving Average Convergence Divergence (MACD).
The MACD is a technical tool that shows the relationship between the 12 EMA (blue) and 26 EMA (orange) to measure trend momentum and price acceleration. If the reading is negative, the trend is bearish, and the price can decrease.
Read More: How To Buy Bitcoin (BTC) and Everything You Need To Know
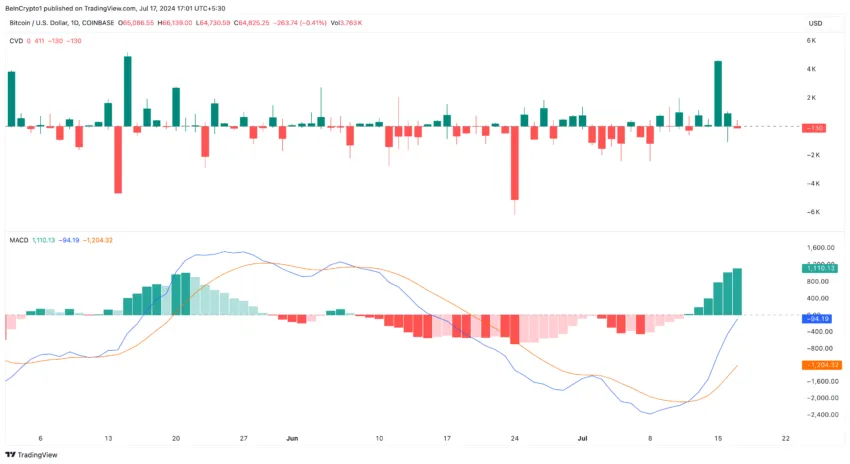
However, the MACD rating at press time is in the green zone, suggesting that Bitcoin’s price can continue its uptrend.
In conclusion, if large entities or whales begin to distribute the coin again, the potential price increase may be invalidated. If this is the situation, Bitcoin may drop to $60,899.
Disclaimer
In line with the Trust Project guidelines, this price analysis article is for informational purposes only and should not be considered financial or investment advice. BeInCrypto is committed to accurate, unbiased reporting, but market conditions are subject to change without notice. Always conduct your own research and consult with a professional before making any financial decisions. Please note that our Terms and Conditions, Privacy Policy, and Disclaimers have been updated.


Bitcoin is rebounding after tariff chaos, and public companies like Metaplanet are conducting major acquisitions. The firm bought $28.2 million worth of the asset, nearly a $2 million increase from last week.
However, despite this new confidence, Metaplanet’s stock has continued to perform shakily. The crypto market is showing cautious optimism, but that won’t immediately translate into major gains.
Although a few corporate Bitcoin whales briefly paused their big purchases recently, the markets are heating back up again. Metaplanet began buying the dip last week, and Bitcoin has been making steady progress since then.
Today, its CEO, Simon Gerovich, announced a new purchase as BTC rebounds:
“Metaplanet has acquired 330 BTC for ~$28.2 million at ~$85,605 per bitcoin and has achieved BTC Yield of 119.3% YTD 2025. As of 4/21/2025, we hold 4855 $BTC acquired for ~$414.5 million at ~$85,386 per bitcoin,” he claimed.
Trump’s tariff threats caused massive uncertainty and crypto liquidations in the last few weeks. However, since he announced a pause, crypto and industry-related stocks have been rallying.
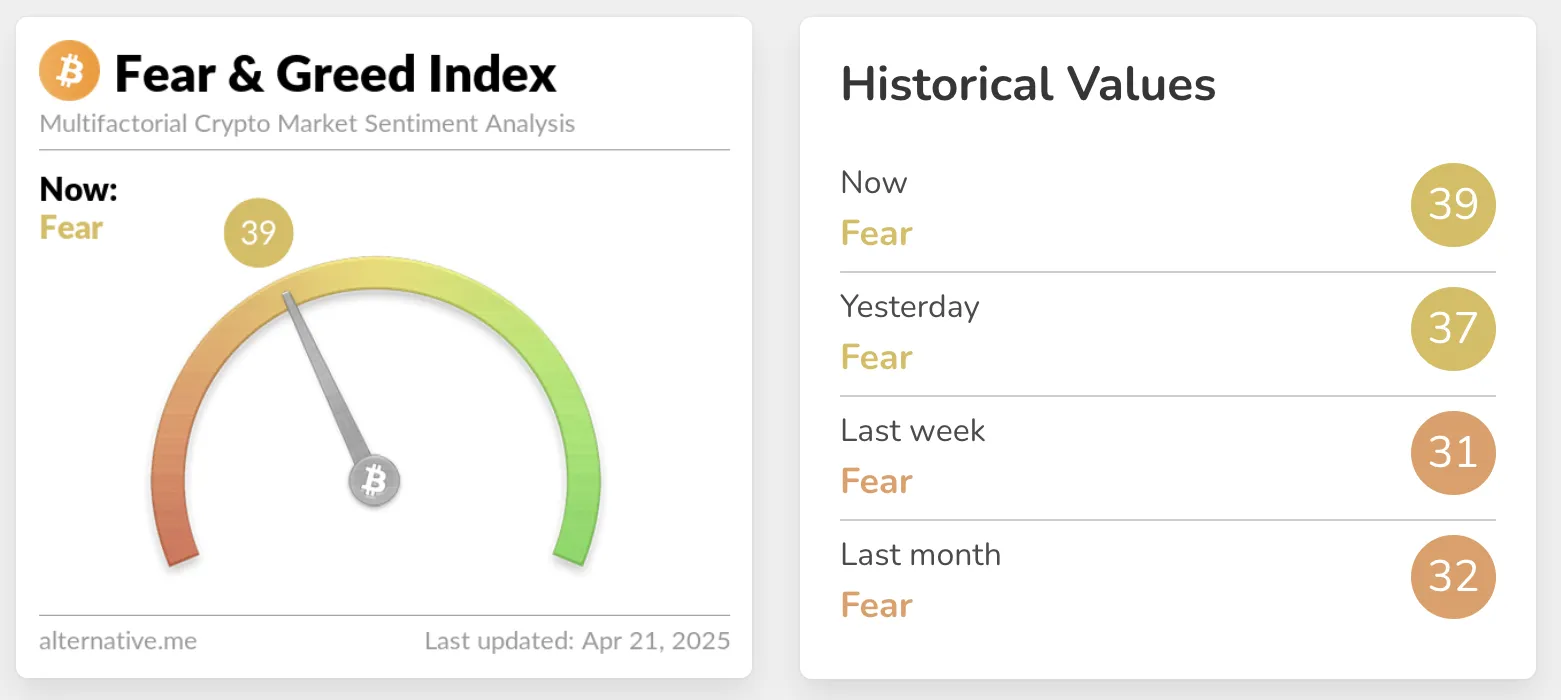
Whales like Metaplanet and MicroStrategy immediately began buying Bitcoin, and the whole market is rising. The Crypto Fear and Greed Index was recently in Extreme Fear but has since recovered greatly:
Still, markets are showing cautious optimism, not a full rally. A quick look at some major crypto-related stocks will paint a clearer picture.
MicroStrategy rose over 4% in the last five days and nearly 6% in the last month, but it’s a pillar of confidence in BTC. Metaplanet, a much smaller Bitcoin holder, only fell 1.89% in the last five days but over 20% in the last 30.
In other words, it can be difficult to cleanly connect Bitcoin’s recent successes with major holders like Metaplanet. Compare two prominent US-based crypto miners, Marathon and Riot.
The former recovered from its slump in early April, while the latter only continued to drop. Coinbase, too, has only made brief rallies on a trend of continual decline.
While Bitcoin’s adoption has surged dramatically over the past year, there’s still a lot of uncertainty about tariffs and recession. Metaplanet may be in shaky territory right now, but its confidence in Bitcoin can provide a long-term sense of stability.
Disclaimer
In adherence to the Trust Project guidelines, BeInCrypto is committed to unbiased, transparent reporting. This news article aims to provide accurate, timely information. However, readers are advised to verify facts independently and consult with a professional before making any decisions based on this content. Please note that our Terms and Conditions, Privacy Policy, and Disclaimers have been updated.

The US Dollar Index (DXY) has dropped to a three-year low amid reports that President Donald Trump is considering removing Federal Reserve Chairman Jerome Powell.
Meanwhile, the development positively affected Bitcoin’s (BTC) price, pushing it to its highest level since President Trump’s Liberation Day.
Trump’s Push Against Powell Adds Pressure on the Dollar
According to the latest data, DXY has plunged below 99. At press time, it stood at 98.2, representing the lowest value since March 2022.

Economist Peter Schiff highlighted the severity of the situation in the latest post on X (formerly Twitter).
“Gold is up over $50, hitting a record high of $3,380. The euro is above $1.15. The dollar has also fallen below 141 Japanese yen and .81 Swiss francs (a new 14-year low, just 3% above a record low). The dollar Index is below 98.5, a new three-year low. This is getting serious,” Schiff posted.
The dollar’s steep fall comes amid the latest comments made by National Economic Council Director Kevin Hassett on Friday, April 18. Hassett revealed that Trump and his team are actively exploring the possibility of ousting Powell.
His statement was in response to a reporter’s question about whether removing Powell was an option.
“The president and his team will continue to study that matter,” Hassett replied.
In addition, he called out the Federal Reserve for politically motivated actions under Powell’s leadership. Specifically, Hassett criticized the Fed for raising interest rates shortly after Trump’s election and cutting them ahead of the election, moves he claims favored the Democratic Party.
Notably, the growing contempt towards Powell is a response to the Fed’s stance on interest rates. BeInCrypto reported earlier that the Fed will likely not cut rates in May amid rising inflation and President Trump’s tariff pause.
Recently, Trump also blamed the Fed Chair for being slow to act on interest rate cuts. In a post on social media, Trump compared Powell’s actions unfavorably to the European Central Bank (ECB), which is set to implement its seventh interest rate cut.
Trump argued that Powell, whom he described as “always too late and wrong,” should have taken similar measures long ago to address economic conditions.
“Powell’s termination cannot come fast enough!” the President wrote.
The Fed Chair’s potential removal raises serious questions about the Federal Reserve’s independence and its implications for global markets. Powell, whose term as chair extends to May 2026, has previously stated that legal protections prevent his removal and that he intends to serve out his term.
Will Dollar Weakness Drive Bitcoin to New Heights?
Nonetheless, it’s worth noting that if Powell is removed and President Trump successfully persuades the Federal Reserve to cut interest rates, it could likely lead to a crypto market rally. Generally, when the Fed lowers interest rates, the US dollar tends to weaken.
Therefore, investors prefer cryptocurrencies, especially Bitcoin, which is often seen as a hedge against inflation and the weakening of fiat currencies. The inverse relation between the DXY and BTC further solidifies the case for a rally if the dollar depreciates.
In fact, the latest decline in the dollar index has coincided with a notable increase in Bitcoin’s price. The largest cryptocurrency surged to over $87,000 for the first time since April 2.
“USD weakness is driving the rally in crypto,” Sean McNulty, Derivatives Trading Lead at FalconX, told Bloomberg.
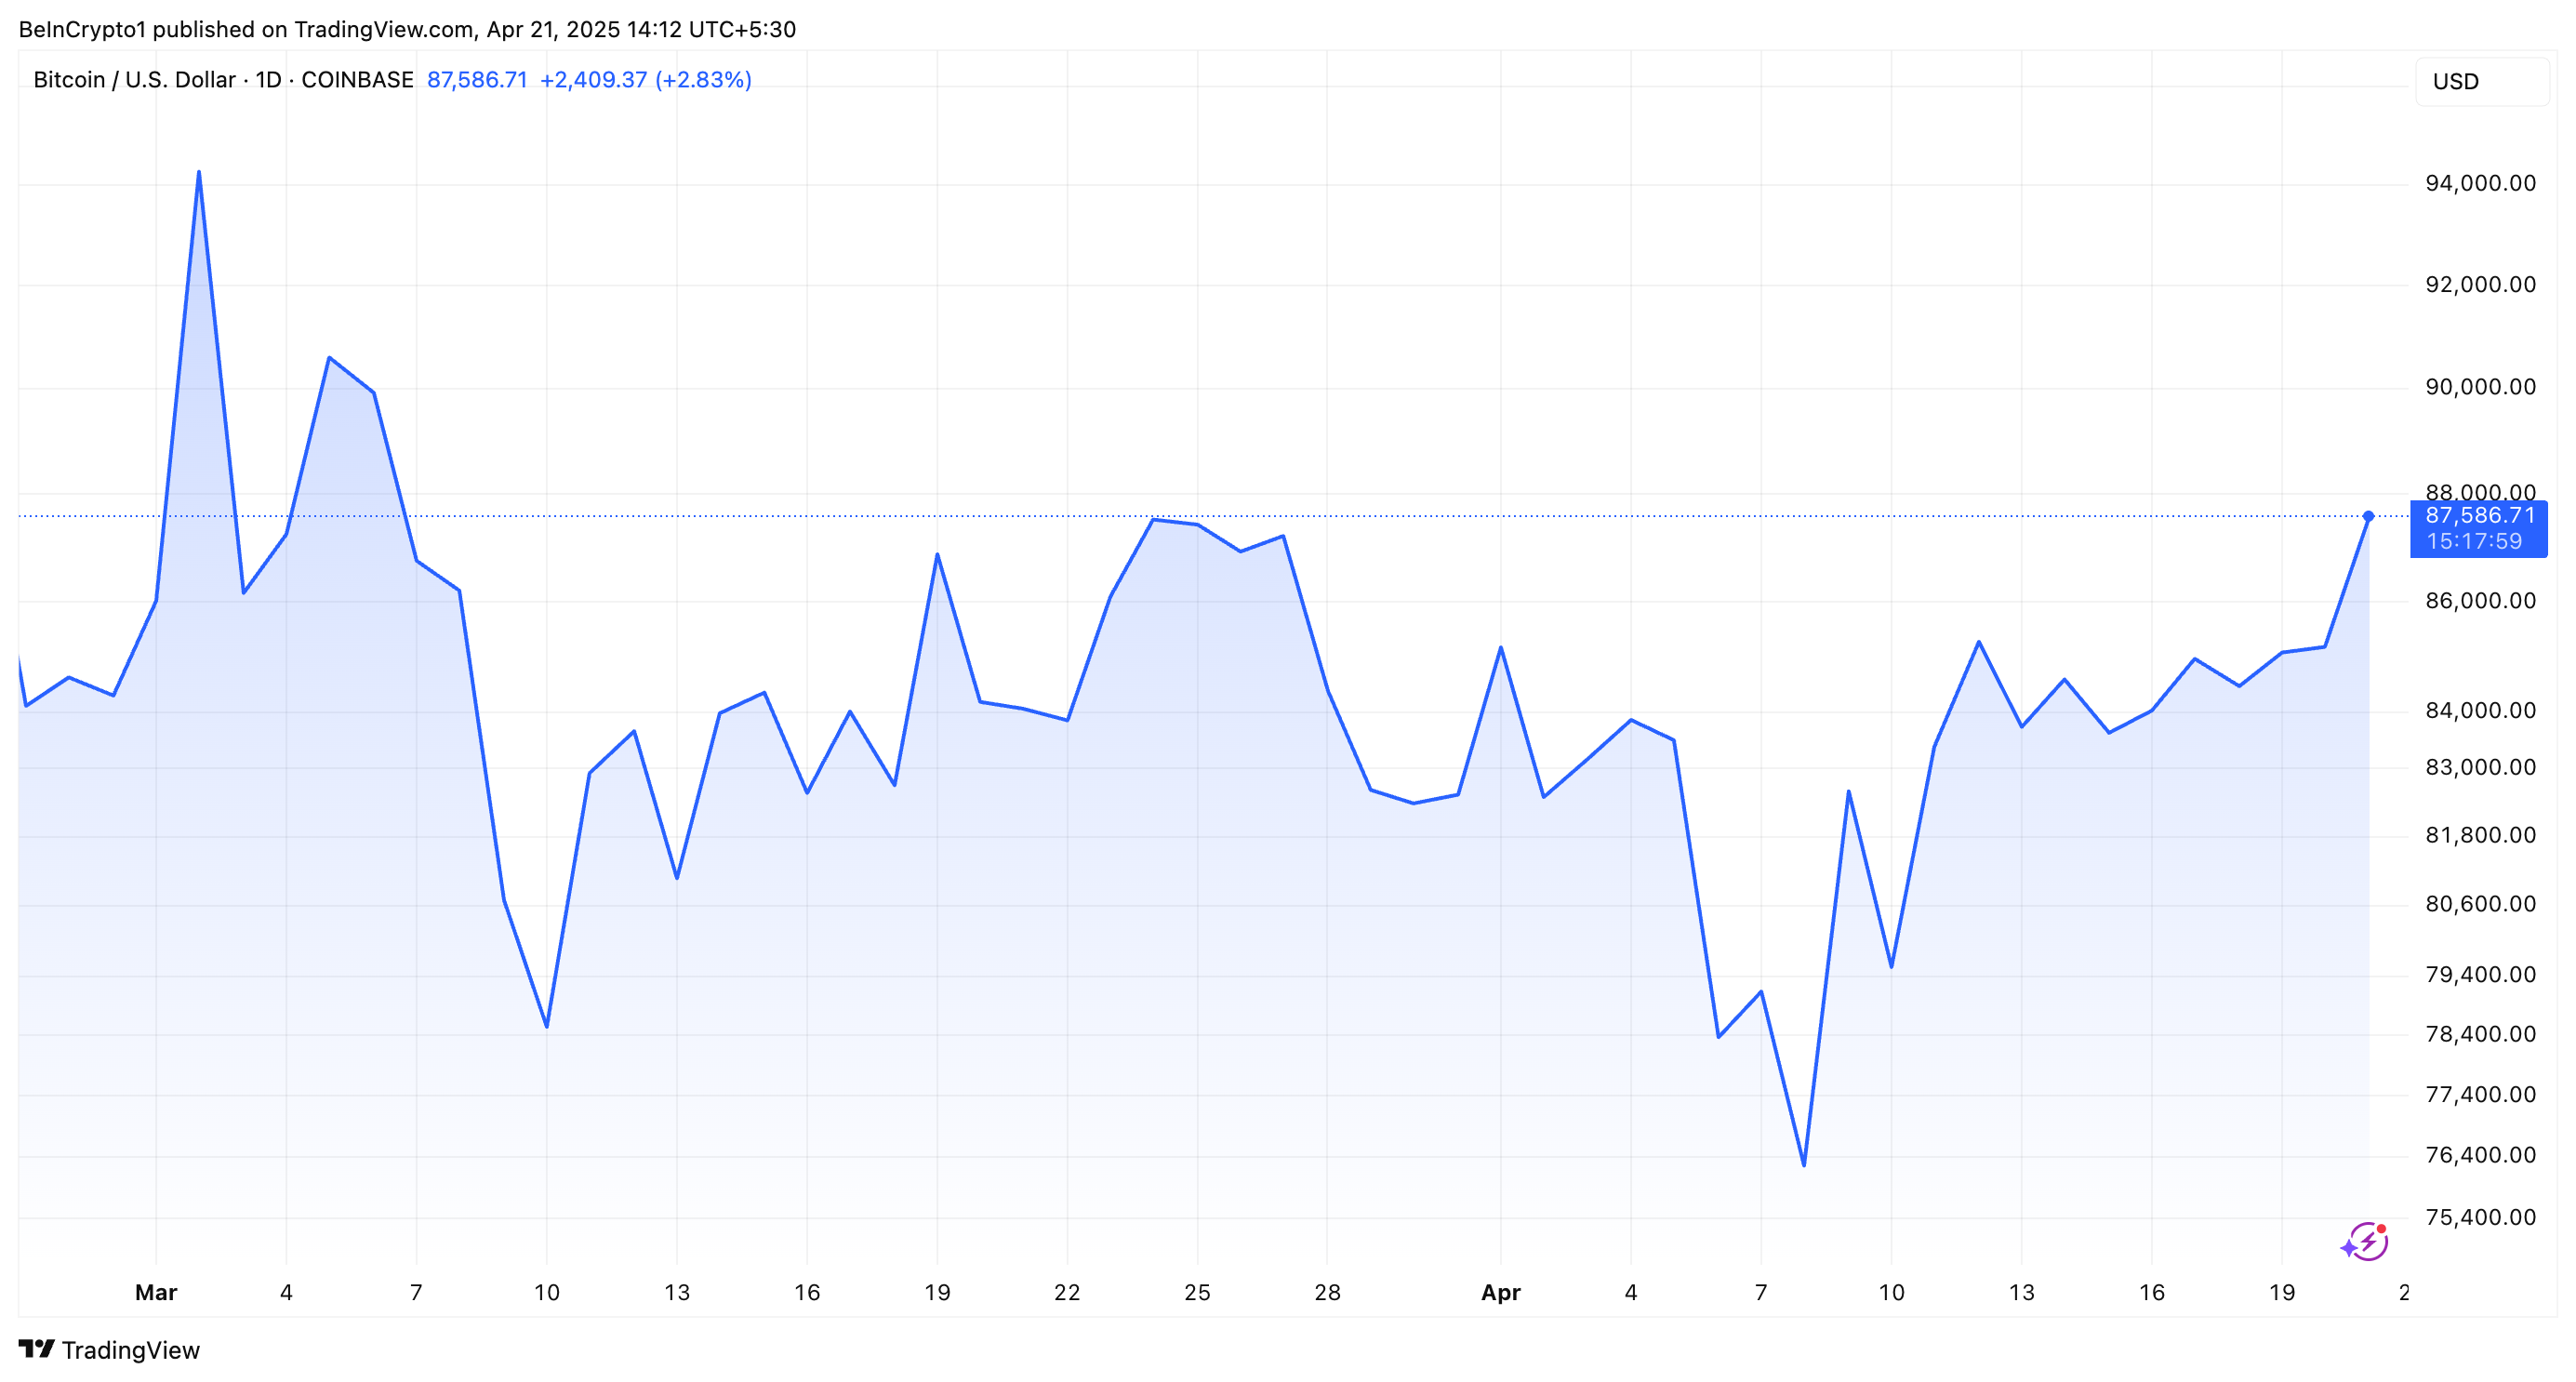
At the time of writing, BTC was trading at $87,586. BeInCrypto data showed that this represented an appreciation of 3.5% over the past day. As markets celebrate these gains, the focus remains on Trump’s next moves and their broader economic consequences.
Disclaimer
In adherence to the Trust Project guidelines, BeInCrypto is committed to unbiased, transparent reporting. This news article aims to provide accurate, timely information. However, readers are advised to verify facts independently and consult with a professional before making any decisions based on this content. Please note that our Terms and Conditions, Privacy Policy, and Disclaimers have been updated.

Several top crypto news stories are in the lineup this week in crypto, spanning various ecosystems with the potential to drive volatility.
This week, traders looking to capitalize on event-specific volatility should monitor the following developments.
This week, the Solana Community Conference, or Breakpoint, is among the top crypto news stories. It kicks off on April 25 and is Solana’s flagship gathering of developers, investors, and innovators.
Historically, Solana Breakpoint is a stage for major announcements, such as new project launches, partnerships, or technological advancements. In recent years, key announcements in similar gatherings have included the Solana Seeker phone or the Firedancer validator client.
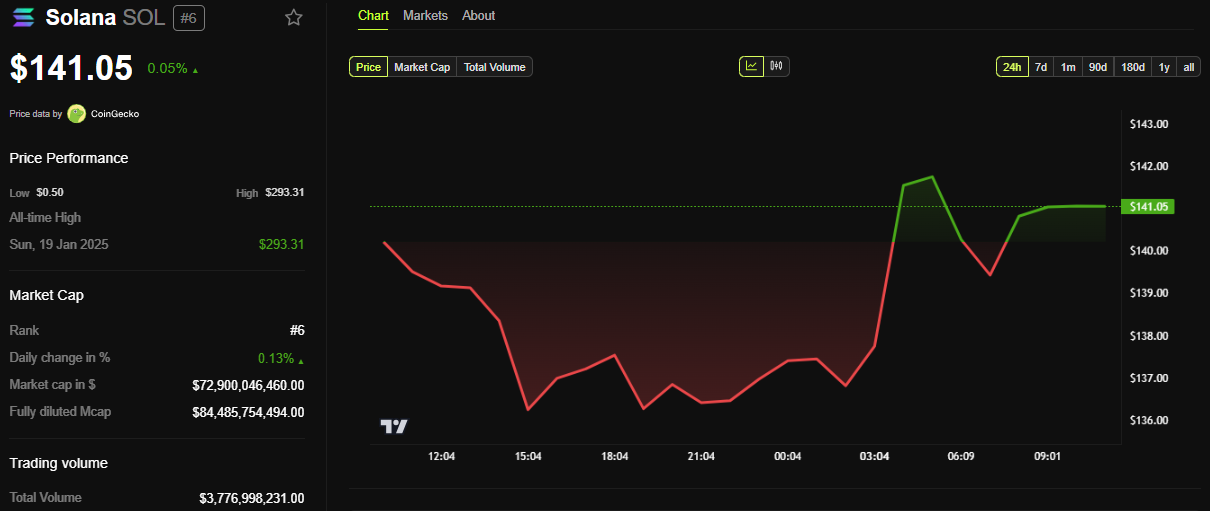
According to Solscan data, Solana’s ecosystem boasts nearly 4 million active wallets. Meanwhile, DefiLlama data shows up to $7.37 billion in total value locked (TVL). With these numbers, the Solana community conference could drive positive sentiment for SOL, which was trading at $141.05 at press time.
Traders should brace for potential price volatility, as positive news could spark short-term spikes. In the same way, any underwhelming news or network concerns, like past outages, might temper enthusiasm.
Texas Bitcoin Reserve Hearing
Another top crypto news story this week concerns a strategic crypto reserve. On April 23, Texas will hold a strategic Bitcoin reserve hearing, marking a significant event given the state’s pro-crypto stance.
The bill, introduced four months ago, passed the committee with a 9-0 vote and received senate approval with 80% support. Similarly, Dan Patrick, Lieutenant Governor for the State of Texas, listed Bitcoin Reserve as a top priority for 2025.
“My statement announcing the first round of top 40 priority Bills for the 2025 legislative session,” he shared on X (Twitter) in January.
Against these backdrops, the Wednesday hearing could clarify Texas’s approach to institutional Bitcoin adoption. This could set a precedent for other states or federal policy.
A favorable outcome might bolster Bitcoin’s legitimacy, driving demand from institutional investors and positively influencing the BTC price.

Initia’s Mainnet and INIT Token Launch
Also in the headlines, this week in crypto, Initia’s mainnet launch and its token, INIT, debut on Thursday, April 24. This comes after the network revealed a 50 million token airdrop three weeks ago.
The Thursday event will mark a key milestone for the layer-1 blockchain, which is focused on interoperability and user experience. The launch could attract attention from decentralized finance (DeFi) and cross-chain enthusiasts, as Initia aims to simplify dApp interactions.
For traders, INIT’s initial price action will be critical, as new token launches often experience high volatility due to speculative trading.
“Initia INIT Binance Spot Listing Date Announced! Listing on: 24th April 2025. Mainnet will also officially launch on the same day. Airdrop claim date and exact time are yet to be announced,” the network stated recently.
Investors should evaluate Initia’s partnerships and developer adoption, as its success hinges on ecosystem growth.
Injective’s Lyora Mainnet Upgrade
Injective’s Lyora mainnet upgrade, scheduled for Tuesday, April 22, aims to enhance network performance and transaction speed. It would strengthen its position as a DeFi-focused layer-1 chain.
“The Injective Lyora Mainnet is nearly here! Vote today to dramatically enhance Injective infrastructure, performance, and transaction speeds. The official launch is on April 22,” Injective said.
This upgrade could improve user experience and attract developers to Injective’s ecosystem, particularly for derivatives and trading platforms.
Traders should watch INJ’s price for short-term momentum, as successful upgrades often drive positive sentiment.
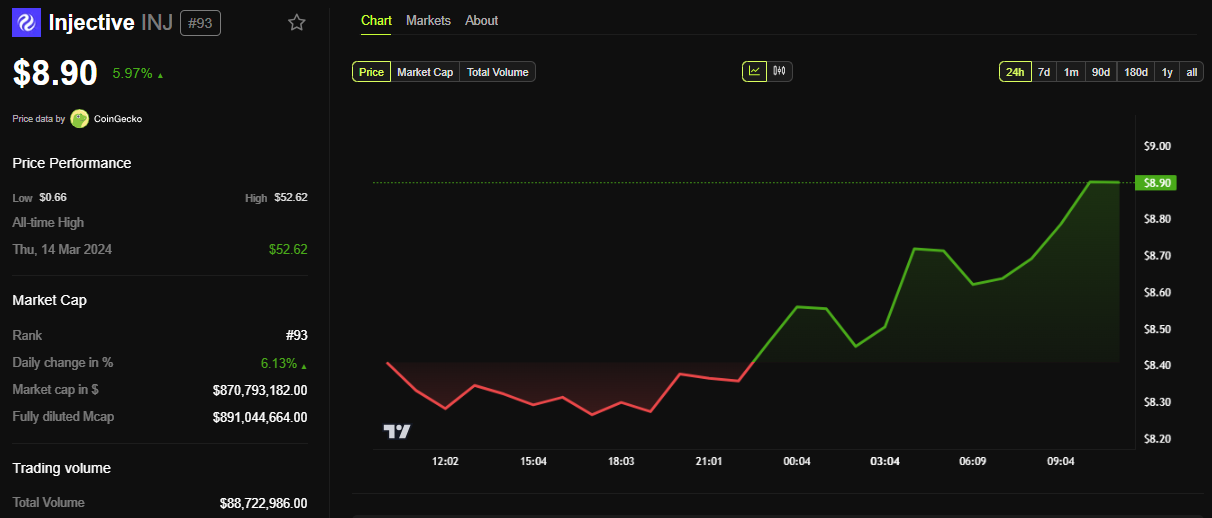
At the same time, investors should consider Injective’s growing TVL (total value locked) and partnerships, like its collaboration with Sonic for AI agent platforms, as indicators of long-term potential.
Disclaimer
In adherence to the Trust Project guidelines, BeInCrypto is committed to unbiased, transparent reporting. This news article aims to provide accurate, timely information. However, readers are advised to verify facts independently and consult with a professional before making any decisions based on this content. Please note that our Terms and Conditions, Privacy Policy, and Disclaimers have been updated.

Report Alleges Massive Meme Coin Sniping on Pump.fun

Solana Leads Blockchain Metrics as SOL Momentum Builds

Crypto Firms Donated $85 million in Trump’s Inauguration

Ethereum to Emphasize Layer-1 Efficiency and UX in Upcoming Protocol Upgrades

XRP Surpasses Ethereum In This Major Metric After Outperforming For 6 Months

PumpFun Moves $13M SOL To Kraken as Solana Price Consolidates, What Next?

2.52 Million Altcoins Are Ruining Crypto’s Future

Animoca Brands Valuation Tanks 75% In Two Years, Here’s Why

Crypto exchange BingX hacked for $43 million

Are The Big Players Losing Interest?

Hong Kong’s Securities Association Tips Authorities On Crypto Self-Regulation

Coinbase cbBTC Set to go Live on Solana
2.52 Million Altcoins Are Ruining Crypto’s Future
Animoca Brands Valuation Tanks 75% In Two Years, Here’s Why
Crypto exchange BingX hacked for $43 million
Are The Big Players Losing Interest?
Hong Kong’s Securities Association Tips Authorities On Crypto Self-Regulation
Coinbase cbBTC Set to go Live on Solana
-
 Bitcoin22 hours ago
US Economic Indicators to Watch & Potential Impact on Bitcoin
-

 Market22 hours ago
Vitalik Buterin Proposes to Replace EVM with RISC-V
-
 Altcoin20 hours ago
Expert Reveals Why BlackRock Hasn’t Pushed for an XRP ETF
-

 Market23 hours ago
Solana Rallies Past Bitcoin—Momentum Tilts In Favor of SOL
-
 Altcoin15 hours ago
Will Cardano Price Break Out Soon? Triangle Pattern Hints at 27% ADA Surge
-

 Market21 hours ago
XRP Bulls Defend $2.00—Is a Fresh Price Surge Loading?
-

 Bitcoin20 hours ago
Solana, Bitcoin in Texas, and Initia
-
 Market20 hours ago
Will Bittensor Surpass Bitcoin as a Store of Value? Expert Predicts