
Bitcoin
Bitcoin (BTC) Analyst Expects $100,000 By December – Details
Bitcoin is now in a consolidation phase after weeks of significant selling pressure and fear throughout the market. The price has dropped over 19% from local highs in late August and is currently testing resistance around $58,000. Despite this recent downturn, the broader outlook remains optimistic.
Top analysts and investors are projecting a price surge, with predictions of Bitcoin reaching $100,000 by the end of the year. One prominent analyst recently shared a chart with a technical prediction that points to a potential breakout in the coming weeks.
This consolidation period could be setting the stage for the next major rally as Bitcoin continues to test key resistance levels. Investors are keeping a close eye on these technical indicators to determine the future price direction of the leading cryptocurrency. With volatility still present, the next few weeks will be critical for Bitcoin’s trajectory.
Is Bitcoin Reaching $100,000 This Year?
Bitcoin is currently at a crucial level, aiming to reclaim higher prices and initiate a bullish trend. After weeks of fear and uncertainty dominating the market, optimism is slowly returning as top investors share more confident outlooks.
One of the leading voices in this shift is Kaleo, a respected investor and trader, who recently posted a technical analysis on X. His analysis draws a comparison between the current BTC chart and the one from January, a pivotal month when spot Bitcoin ETFs were approved and the price surged aggressively.
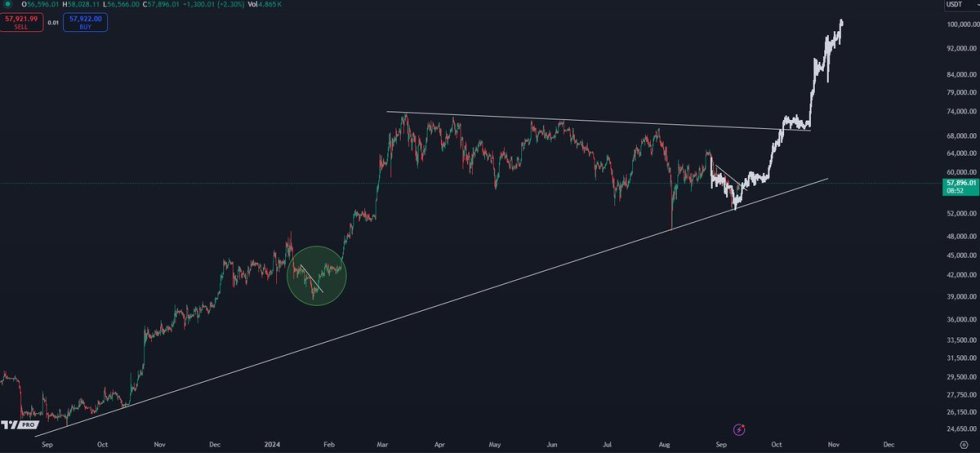
Kaleo’s bold prediction places Bitcoin at $100,000 by December, a figure that has been a key target for crypto investors since the last bull run. While the market has been recovering from a series of corrections since March, the idea of Bitcoin reaching this milestone by year-end is not far-fetched. Bitcoin rallies are historically fast and explosive, which makes this prediction feasible if the market momentum picks up soon.
The market is still navigating through a recovery phase, but many investors are eyeing this $100,000 target as a realistic possibility. Should Bitcoin break through key resistance levels, the coming months could see an accelerated push towards this milestone, setting the stage for another historic bull run.
BTC Price Action
BTC is currently trading at $56,443, following a 10% surge from $52,540. The price is now testing local resistance at $58,070. Despite this positive movement, BTC remains below the 4-hour 200 exponential moving average (EMA), currently at $58,820. This EMA has acted as a key resistance level since early August, influencing short-term momentum.

For bulls to regain control and initiate a stronger upward trend, BTC must break through the 4-hour 200 EMA and surpass the critical $60,000 level—a significant psychological barrier for crypto investors. Successfully overcoming these resistance points could position BTC to target mid-range prices around $65,000.
Conversely, if BTC fails to breach the 4-hour 200 EMA, we may see a period of ranging consolidation or even a deeper correction. The inability to clear this resistance could lead to a test of lower support levels, potentially impacting market sentiment and short-term price action. Investors should closely monitor these key levels to gauge Bitcoin’s next moves and adjust strategies accordingly.
Featured image from Dall-E, chart from TradingView


The Bitcoin price seems stuck in a consolidation range, ricocheting off the $83,000 and $86,000 levels over the past week. With no clear direction for the premier cryptocurrency, investors are left wondering what phase the market cycle is in—bullish or bearish.
According to a popular crypto analyst on the social media platform X, the Bitcoin price could be preparing for its next big move in either direction over the next few weeks. In any case, here are the important levels to watch out for in the next few days.
Crucial Levels To Watch For BTC’s Next Move
In an April 19 post on the X platform, crypto analyst Ali Martinez shared an interesting analysis of the Bitcoin price while highlighting the current layout of the world’s largest cryptocurrency by market cap. The online pundit noted that BTC bears and bulls are locked in a battle, leading to a choppy market condition.
Notably, the premier cryptocurrency appears to have entered the $83,000 – $86,000 range on Saturday, April 12. Hence, Martinez’s analysis basically revolves around the price of BTC bouncing off the support and resistance levels on its one-hour timeframe.

Source: @ali_charts on X
As shown in the chart above, the Bitcoin price attempted multiple times to breach the resistance zone around the $86,000 region over the past week. However, the bulls’ optimism was met with the staunch resilience of the Bitcoin bears, as the price of BTC almost always found its way back toward the $83,000 mark.
Most recently, the flagship cryptocurrency made its way toward the $86,000 level on Wednesday, April 16, but failed to break the significant resistance zone after the US Federal Reserve (Fed) chair Jerome Powell suggested that interest rate cuts might not be coming as early as anticipated by crypto traders.
Martinez noted in his post that the next significant move for the Bitcoin price depends primarily on the $83,000 and $86,000 levels. According to the crypto pundit, a breakout above the $86,000 mark could spell the start of a bullish run for Bitcoin, while a break below $83,000 could mean further correction for the market leader.
Bitcoin Price Overview
After reaching its all-time high of $108,786 in January 2025, the price of BTC has been on a steady decline in the past few months. According to data from CoinGecko, the flagship cryptocurrency has losst more than 22% of its value since hitting its record-high price.
As of this writing, the price of Bitcoin stands at around $84,530, reflecting a 0.3% decline in the past 24 hours. Meanwhile, the Bitcoin price is up by more than 1% on the weekly timeframe.
The price of BTC on the daily timeframe | Source: BTCUSDT chart on TradingView
Featured image from iStock, chart from TradingView
Editorial Process for bitcoinist is centered on delivering thoroughly researched, accurate, and unbiased content. We uphold strict sourcing standards, and each page undergoes diligent review by our team of top technology experts and seasoned editors. This process ensures the integrity, relevance, and value of our content for our readers.
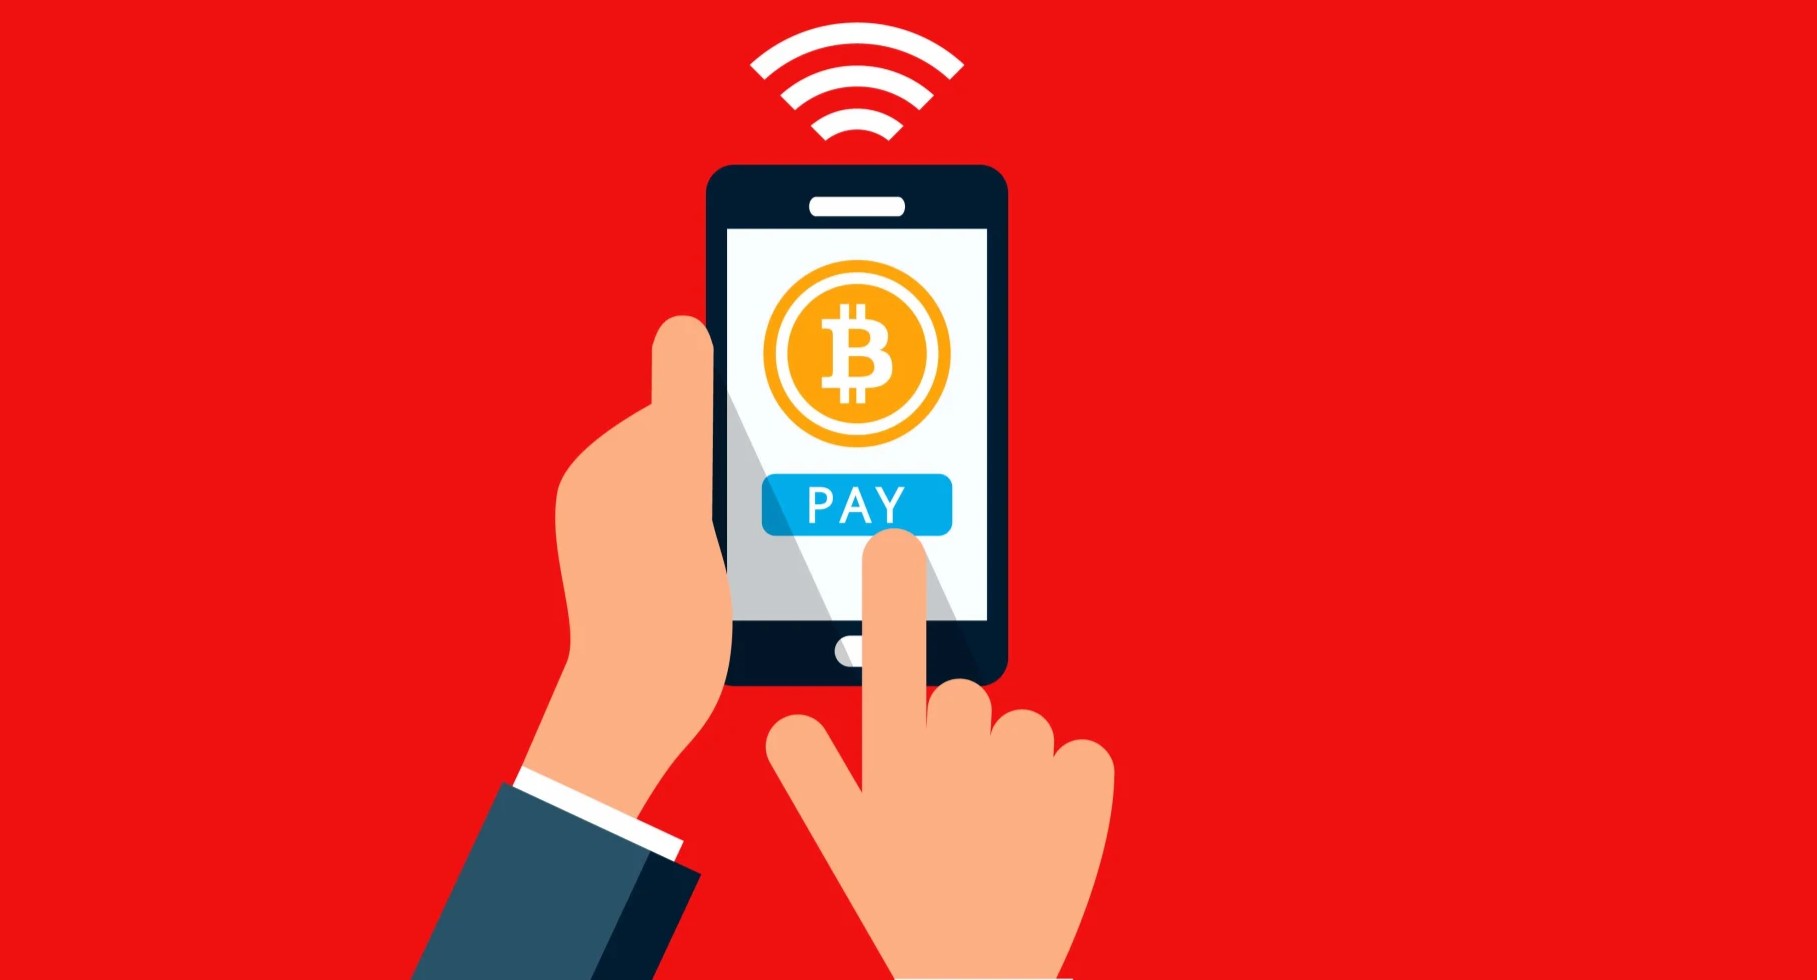
One of Zug, Switzerland’s Spar supermarkets has begun accepting Bitcoin as a form of payment, following an increasing number of enterprises welcoming cryptocurrency for day-to-day purchases. The move is a big development for the global grocery chain with almost 14,000 stores spread around the globe and catering to nearly 15 million customers every day.
Swiss Outlet Breaks Ground With Bitcoin Payment Option
This supermarket outlet in Zug has recently been added to the BTC Map, a community-powered platform that monitors businesses across the globe that accept Bitcoin payments, as reported by DFX.swiss, a Switzerland-based cryptocurrency startup. The system supports payment through Bitcoin Lightning Network technology, and customers can make payments by merely scanning a QR code.
Rahim Taghizadegan, a bitcoin economist who is the leader of the Bitcoin Association Switzerland, was a guest at the shop and verified the system functions correctly. In a video posted on LinkedIn, he explained how clients can pay using the cryptocurrency.
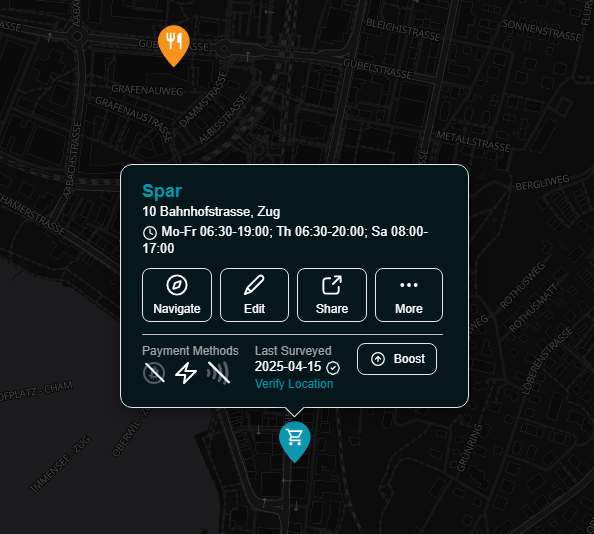
Spar on BTC Map.
Technical Solution Makes Transactions Quick
The payment system operates on the OpenCryptoPay protocol, created by DFX.swiss to support real-life crypto transactions. The system harnesses the peer-to-peer features of the Bitcoin Lightning Network, which accelerates transactions and makes them more feasible for use in retail outlets.
Switzerland has emerged as a hotbed of cryptocurrency acceptance, with more than 1,000 businesses accepting Bitcoin payments. The Swiss city of Lugano went as far as legalizing BTC and USDT as legal tender back in 2022, and lately, added a statue dedicated to the anonymous founder of Bitcoin, Satoshi Nakamoto.
Global Adoption Gaining Momentum
Although the Bitcoin payment option is now only offered at one Spar store, any rollout to the chain’s international network could have a massive impact on cryptocurrency usage in day-to-day shopping. Spar has an international presence in 48 countries, which means it has potential to bring millions of customers into contact with cryptocurrency payment.
Bitcoin at the checkout? It’s happening.
SPAR supermarket in Zug, Switzerland is now accepting Bitcoin via Lightning Network.
✅ Scan QR
✅ Pay in seconds
✅ No card, no cashIf this clicks, 13,900+ SPAR stores in 48 countries could follow.
Retail just got a crypto upgrade.— efiletax (@efile_tax) April 18, 2025
This move continues an increasing pattern of Bitcoin uptake among retail businesses across the globe. Pick n Pay, which operates as one of South Africa’s largest food grocery chains, accepted digital currency as of 2022. Sports car maker Ferrari is also on board with taking cryptocurrency payments, exhibiting adoption through numerous market sectors.
Education Sector Also Embracing Cryptocurrency
According to last week’s reports, the trend is extending beyond retail and high-end merchandise. Lomond School in the United Kingdom revealed that it would accept tuition fees in BTC from autumn 2025, introducing cryptocurrency payments into education.
As institutions and more businesses incorporate cryptocurrency payments, customers could find crypto used as a standard choice to make payments instead of the traditional way. The Spar rollout in Switzerland might be a pilot for other markets within the grocery chain’s wide network.
The move by Spar to bring this payment mechanism to Switzerland reaffirms the welcoming attitude of this nation toward innovations in cryptocurrency. With the endorsement of a reputable global retailer like Spar, Bitcoin continues its transition from being fundamentally an investment currency to a practical currency for everyday shopping.”
Featured image from Inc. Magazine, chart from TradingView
Editorial Process for bitcoinist is centered on delivering thoroughly researched, accurate, and unbiased content. We uphold strict sourcing standards, and each page undergoes diligent review by our team of top technology experts and seasoned editors. This process ensures the integrity, relevance, and value of our content for our readers.

Bitcoin’s (BTC) market dominance has surged to 64%, reaching its highest level in over four years.
However, experts remain divided on what this means for the future. Some predict an impending altcoin season, and others caution that Bitcoin’s dominance could continue to suppress altcoins.
What Does Bitcoin’s Rising Dominance Mean?
For context, Bitcoin dominance (BTC.D) refers to the percentage of the total cryptocurrency market capitalization that BTC holds. It is a key indicator of Bitcoin’s market strength relative to other cryptocurrencies. A rising dominance suggests that Bitcoin is outperforming altcoins, while a decrease may signal growing interest or investment in other digital assets.
The metric has been steadily increasing since late 2022. As of the latest data, it surged to 64%, marking highs last seen in early 2021.

Notably, Benjamin Cowen, founder of Into The Cryptoverse, highlighted that the number is much higher when excluding stablecoins.
“Excluding stable coins, Bitcoin dominance is now at 69%,” Cowen revealed.
The rise in Bitcoin dominance has sparked debate among analysts about its implications for altcoins. Cowen believes there will be a correction or downward movement in altcoins before any substantial gains can be expected in the market. This implies that the altcoin season may not be imminent yet.
“I think ALT/ BTC pairs need to go down before they can go up,” he stated.
Nordin, founder of Nour Group, also expressed caution. He stressed that Bitcoin dominance is nearing the levels seen during the peak of the 2020 bear market.
“This isn’t just a BTC move. Its capital rotating out of alts,” he noted.
Moreover, Nordin warned that a break above 66% could intensify selling pressure on altcoins. This, in turn, could delay the altcoin season.
“Bitcoin dominance back to 64%. No Alt seasons in 2024 or 2025,” analyst, Alessandro Ottaviani, predicted.
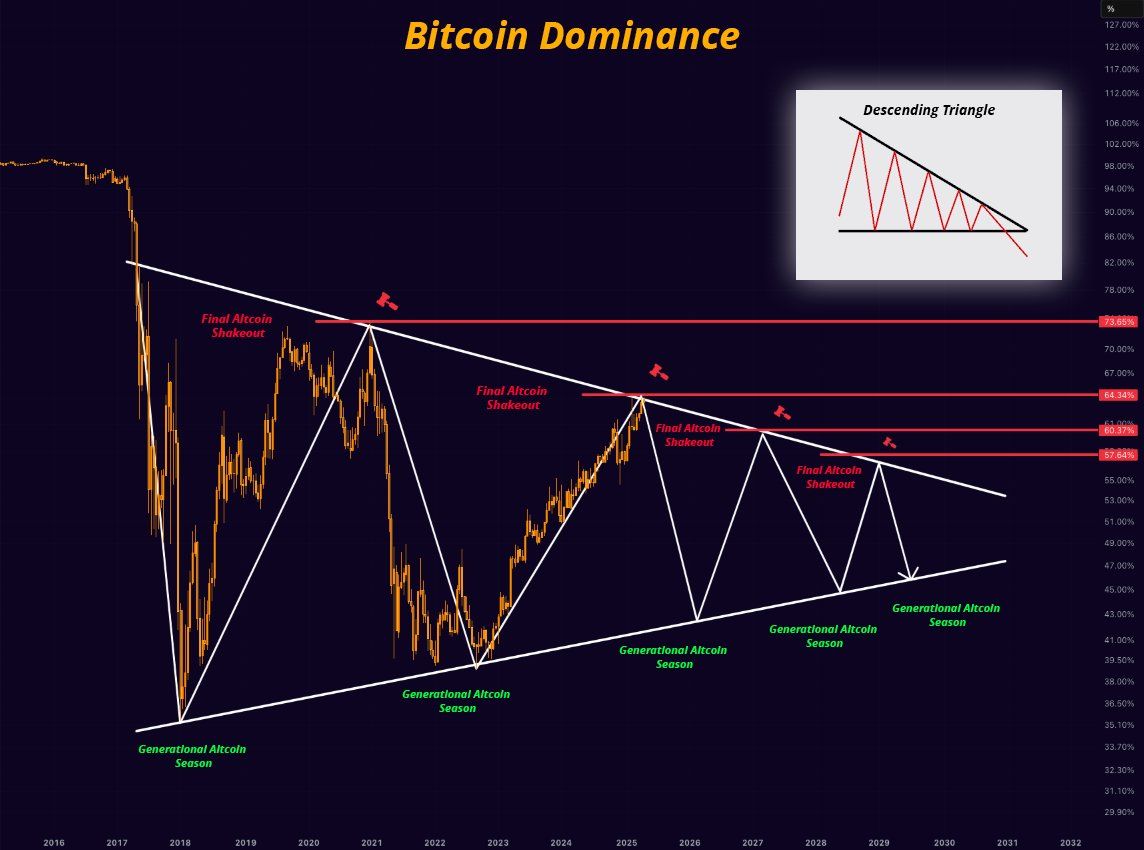
On the other hand, analyst Mister Crypto predicts that Bitcoin’s dominance may follow a long-term descending triangle pattern. A descending triangle typically suggests bearish momentum, where the price or dominance gradually decreases as lower highs are formed.
However, this could prolong its market control before a broader correction allows altcoins to gain traction.
Another analyst mentioned that Bitcoin dominance is currently testing the resistance zone between 64% and 64.3%. Therefore, a possible retracement may be on the horizon. Should this retracement occur, altcoins could begin to gain traction, with some potentially emerging as top performers in the market as capital shifts away from Bitcoin.
“However, a breakout from this zone could mean further declines for alts,” the analyst remarked.
Finally, Junaid Dar, CEO of Bitwardinvest, offered a more optimistic view. According to Dar’s analysis, if Bitcoin’s dominance drops below 63.45%, it could trigger a strong upward movement in altcoins. This, he believes, would create an ideal opportunity to profit from altcoin positions.
“For now, alts are stuck. Just a matter of time,” Dar added.
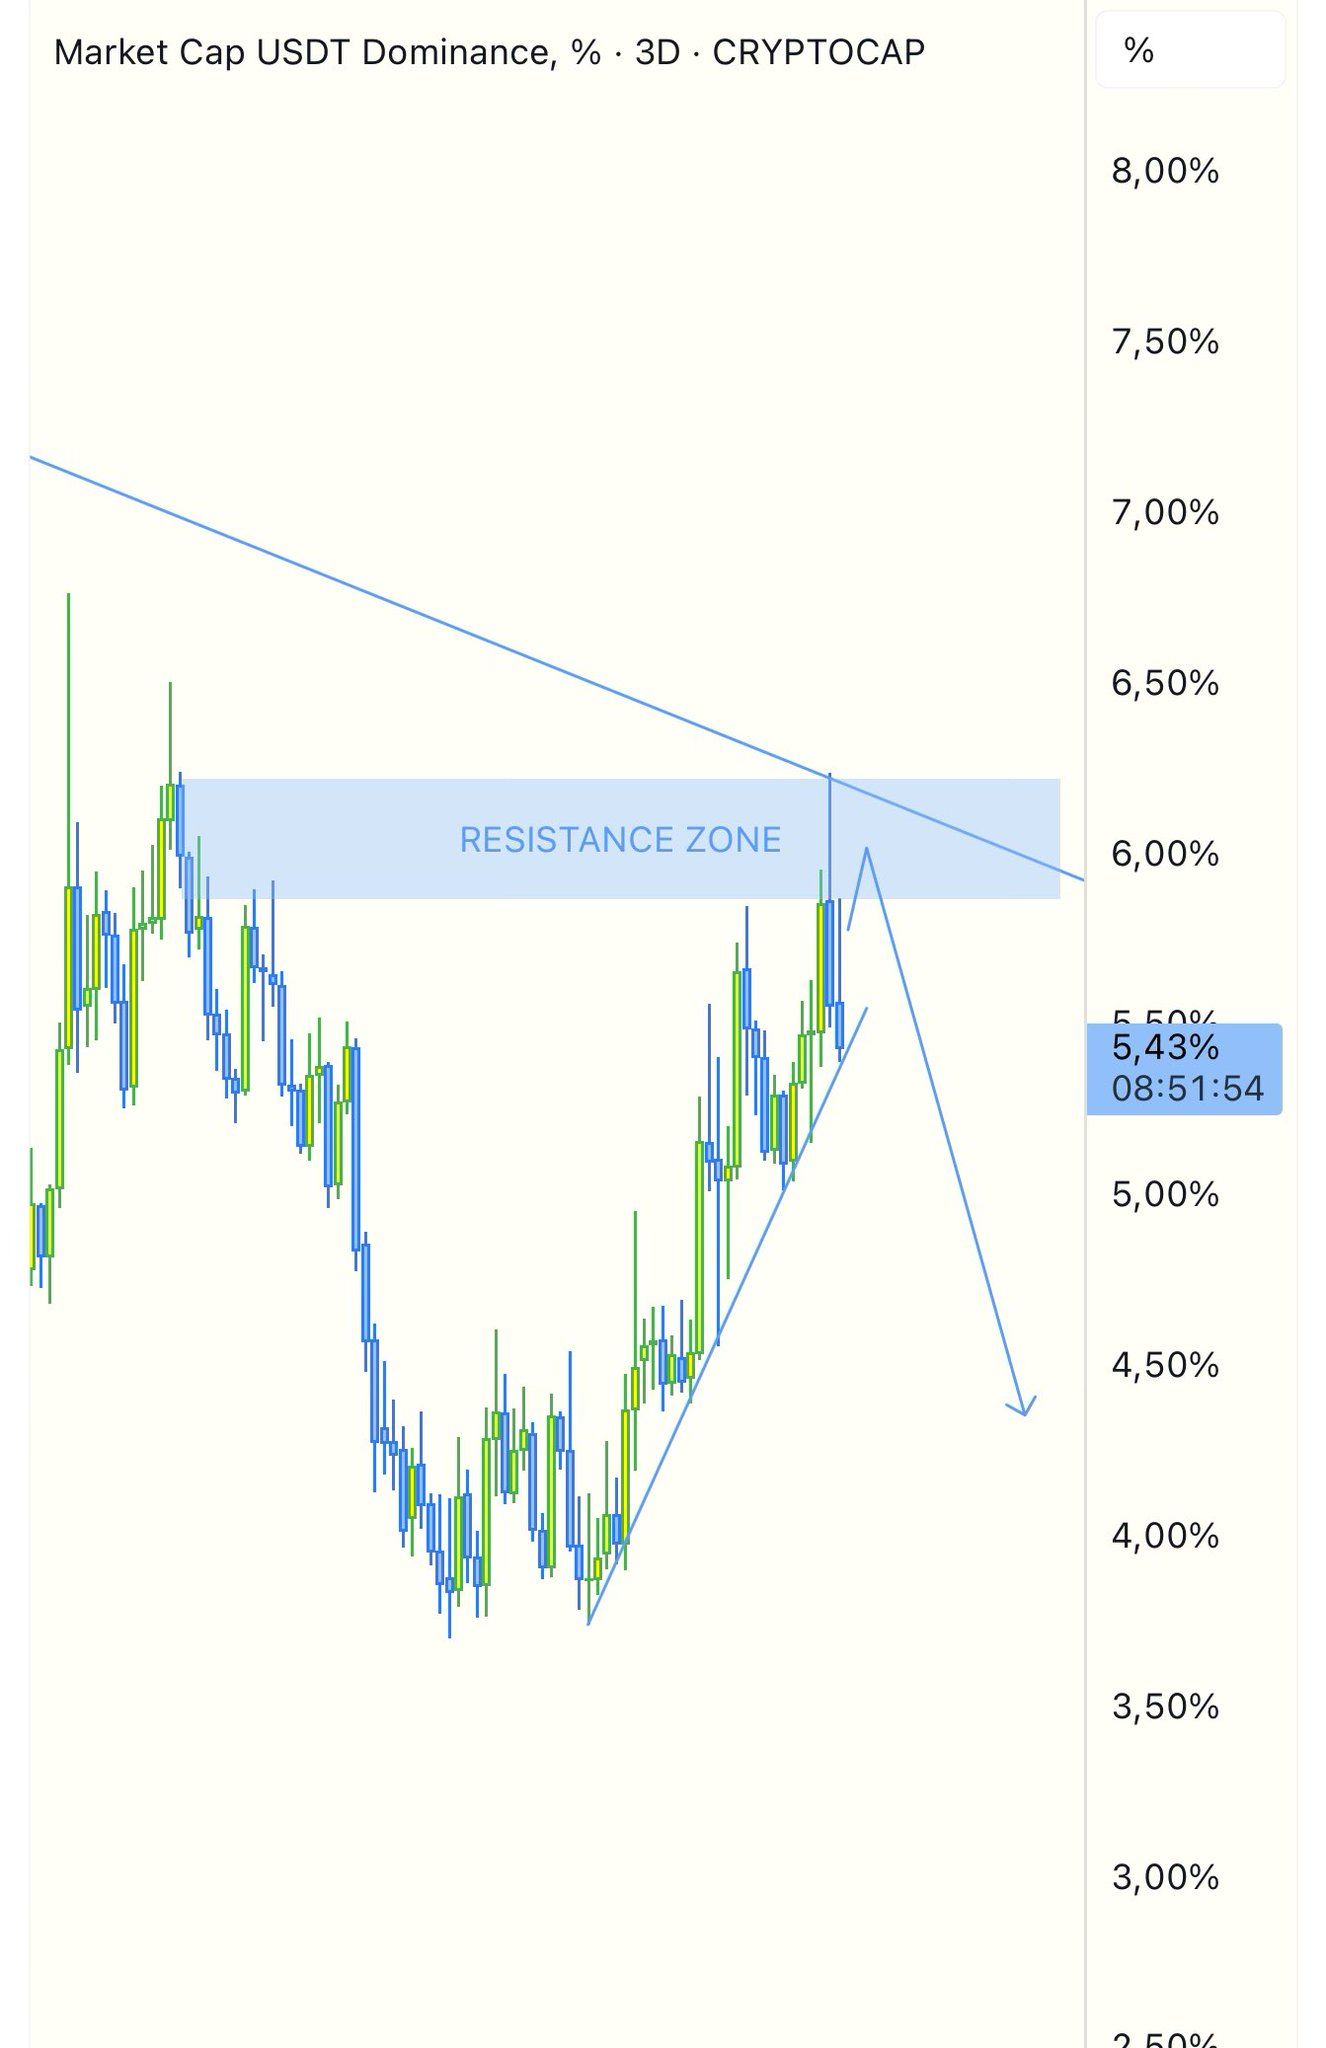
Tether Dominance Signals Potential Altcoin Season
Meanwhile, many analysts believe that the trends in Tether dominance (USDT.D) signal a potential altcoin season. From a technical analysis standpoint, USDT.D has reached a resistance zone and may be due for a correction, suggesting the possibility of capital flowing from USDT into altcoins.
“The USDTD is in a rejection zone, as long as it does not close above 6.75% it will be favorable for the market,” a technical analyst wrote.
Another analyst also stressed that the USDT.D and USD Coin dominance (USDC.D) have reached resistance, forecasting an incoming altcoin season. Doğu Tekinoğlu drew similar conclusions by observing the combined chart of BTC.D, USDT.D, and USDC.D.
As Bitcoin’s dominance climbs, investors are closely monitoring these technical and on-chain signals. The interplay between Bitcoin’s strength and stablecoin dynamics could dictate whether altcoins stage a comeback this summer or face further consolidation. For now, Bitcoin’s grip on the market remains firm.
Disclaimer
In adherence to the Trust Project guidelines, BeInCrypto is committed to unbiased, transparent reporting. This news article aims to provide accurate, timely information. However, readers are advised to verify facts independently and consult with a professional before making any decisions based on this content. Please note that our Terms and Conditions, Privacy Policy, and Disclaimers have been updated.

Ethereum Accumulators At A Crucial Moment: ETH Realized Price Tests Make-Or-Break Point

What’s Up With BTC, XRP, ETH?

Uniswap Founder Urges Ethereum To Pursue Layer 2 Scaling To Compete With Solana

Expert Reveals Why Consensus 2025 Will Be Pivotal For Pi Network

Analyst Says Bitcoin Price Might Be Gearing Up For Next Big Move — What To Know

Ripple Expands In Asia With Debut XRP Investment Tool

2.52 Million Altcoins Are Ruining Crypto’s Future

Animoca Brands Valuation Tanks 75% In Two Years, Here’s Why

Crypto exchange BingX hacked for $43 million

Are The Big Players Losing Interest?

Hong Kong’s Securities Association Tips Authorities On Crypto Self-Regulation

Coinbase cbBTC Set to go Live on Solana
2.52 Million Altcoins Are Ruining Crypto’s Future
Animoca Brands Valuation Tanks 75% In Two Years, Here’s Why
Crypto exchange BingX hacked for $43 million
Are The Big Players Losing Interest?
Hong Kong’s Securities Association Tips Authorities On Crypto Self-Regulation
Coinbase cbBTC Set to go Live on Solana
-
 Market20 hours ago
Cardano (ADA) Moves Sideways, But Bullish Shift May Be Brewing
-
 Market23 hours ago
XRP Consolidation About To Reach A Bottom, Wave 5 Says $5.85 Is Coming
-
 Altcoin16 hours ago
Analyst Reveals Dogecoin Price Can Reach New ATH In 55 Days If This Happens
-
Altcoin19 hours ago
Pi Coin Price Soars As Pi Network Reveals Massive Community Reward Plans.
-

 Altcoin11 hours ago
Cardano Bulls Secure Most Important Signal To Drive Price Rally
-

 Market16 hours ago
Binance Mandates KYC Re-Verification For India Users
-

 Market22 hours ago
Canary Capital Aims to Launch TRON-Focused ETF
-

 Market18 hours ago
SCR, PLUME, ALT Tokens Unlocking This Week