
Altcoin
VanEck’s Meme Coin Index Hits 195% As DOGE, SHIB, & PEPE Prices Rally
Amidst the cryptocurrency sector’s unprecedented performance this year, meme coins have once again seized the spotlight as Vaneck’s subsidiary’s meme coin index hit a staggering 195%, illustrating the immense potential of these coins to offer investors returns. Encompassing the top six meme cryptos by global market cap, DOGE, SHIB, PEPE, WIF, FLOKI, and BONK, the index serves as a market cap-weighted overview of the price performance of the mentioned meme coins.
Recently, the data streamlined by this index showcased that yearly charts hit 195%, underscoring the significant price gains noted by the abovementioned meme coins over a year. Here’s a closer look into this data and why it spiked whoppingly, a thrilling development for crypto market participants.
Meme Coin Index: Here’s Everything
VanEck’s subsidiary MarketVecto recently launched a meme coin index, streamlining the performance of six of the largest meme coins in the crypto industry. The index’s component weightings were capped at 30%, including Dogecoin (30.77%), Shiba Inu (28.34%), Pepe (14.51%), dogwifhat (12.54%), Floki Inu (7.14%), and BONK (6.7%).
Notably, charts rose as high as 195% when comparing the yearly performance of these tokens, stirring market optimism. In context, when looking at the abovementioned tokens’ yearly ‘price’ charts, it can be clearly seen that these coins noted phenomenal gains, with investors who entered the market at the right time making unprecedented profits in a year.
Although VanEck’s subsidiary’s meme coin index cautions against the turbulent nature of these coins, built for entertainment, the tokens have conversely gained significant traction in the broader market.

It’s also worth mentioning that the index’s graph uses UTC and not local time. Whereas, the year-to-date performance as of writing was evaluated to be 137.96%.
Also Read: Crypto Prices Today May 9: Bitcoin Drops To $61K, ETH Dips, Cardano Breaches Market Trend
DOGE, SHIB, PEPE & Others Rally
Coming in tandem with the meme coin index’s data, yearly charts of DOGE, SHIB, PEPE, WIF, FLOKI, and BONK show that the tokens experienced a phenomenal bull run over a year.
Dogecoin Price Rallies Over 100%
The largest meme crypto by global market cap, Dogecoin, saw a 102.82% surge in price over the past year. Although the token’s price slipped 1.92% in the past 24 hours, reaching $0.1476, the meme coin projected a bullish outlook for offering investors gains in the long- run.

Shiba Inu Rallies Over 150%
Meanwhile, Shiba Inu, the self-proclaimed Dogecoin killer, witnessed annual gains worth 159% and currently sits at $0.00002287, with a 0.76% dip in the past 24 hours. One of Dogecoin’s most prominent rivals and the second-largest meme crypto by global market cap, SHIB token’s yearly gains come riding the wave of the community’s monumental developmental endeavors.

Pepe Coin Upswings Over 300%
The third-largest meme crypto by market cap, PEPE, noted an attention-grabbing 338% yearly upswing. Currently trading at $0.000008309, the frog-themed meme token surged 4.26% in the past 24 hours with a price flux action.

‘dogwifhat’ Price Surges Over 1,600%
Marking not even a complete year following its launch, the Solana-based meme coin WIF rallied 1,615.28% since its inception in November last year. WIF jotted a 1.73% dip in its price in the past 24 hours, trading at $2.88.

FLOKI Price Jumps Over 400%
Annual charts for another dog-themed meme token brought by the members of the Shiba Inu community, Floki Inu, illustrated a yearly surge of 403.93%. As of writing, the token rested at $0.0001745 with a 2.17% upswing over the past day.

BONK Springs over 5,400%
Meanwhile, another dog-themed meme token on the Solana network, Bonk (BONK), rose 5,474.23% over the past year. While writing, the token stood at $0.00002406, with a 1.14% upswing in price over the past day.

The phenomenal price rallies witnessed by these tokens, as primarily pointed out by VanEck’s subsidiary’s meme coin index, has fueled immense optimism among investors surrounding the abovementioned tokens. A post-BTC halving is yet to come into play, further instilling hope for the coins’ future price movements.
Also Read: Donald Trump Seeks Votes From Crypto Lovers, Extends Full Support
The presented content may include the personal opinion of the author and is subject to market condition. Do your market research before investing in cryptocurrencies. The author or the publication does not hold any responsibility for your personal financial loss.


Solana (SOL) price has been under pressure recently, leading to concerns about a potential downtrend against Bitcoin (BTC). On the SOL/BTC price chart are signs that the cryptocurrency could be forming a “death cross,” a pattern that suggests a further decline in price.
This follows a period of weak performance for Solana relative to Bitcoin, sparking discussions on whether the altcoin can recover or continue to underperform.
Will Solana Form a Death Cross Against Bitcoin?
Over the past few months, Solana price has experienced a sharp decline when compared to Bitcoin. As of mid-April 2025, Solana is priced at 0.00158 BTC, down by 23% from earlier in the month. This comes after a significant 54% drop since January, showing a steady loss in value relative to Bitcoin.
The recent drop in Solana’s price has raised concerns among traders and analysts. Moving averages, which track price trends over time, have been narrowing, which is often a precursor to a potential death cross formation.

Specifically, the 23-day moving average is approaching the 200-day moving average in the weekly chart, a key level for technical analysts. If it crosses below the 200-day average, it would officially signal a death cross. This could indicate a further decline in Solana’s price against Bitcoin.
Solana’s Recent Performance and Market Trend
Nonetheless, Solana has had some strength, which can be attributed to the recent launch of Solana ETFs in Canada.
At the same time, institutional investors’ attention contributed to the altcoin’s success in surpassing the performance of numerous other cryptocurrencies, including Bitcoin. Solana delivered a 10.5% return within a week, while Bitcoin delivered a 1.8% return in the same time frame.
Nonetheless, the recent excitement about Solana appears to have subsided with the lessened market movements. Analysts like Ali Charts are now analysing whether the recent strength was just a blip in the charts or the first sign of an actual trend reversal to $65.
SOL/BTC Technical Patterns and Support Levels
Based on the current technical perspective, Solana’s price trend against Bitcoin has established the “Falling wedge” chart. This pattern is normally noticed during the consolidation phase, and the break above the upper trend line is usually interpreted as a signal for a bullish move.
The declining moving averages indicate that Solana may continue to decline against Bitcoin and possibly test lower supports despite the SOL/ETH ratio recording its highest weekly close
At present, the price is almost at the apex of the wedge pattern, meaning that it can break soon. If the price surmounts the resistance level at around 0.0018BTC, it will possibly lead to a bullish run and might even regain the value of 0.001895BTC for Sol. However, if the price cannot hold its support at 0.0014 BTC, then it may decrease even lower.

Solana’s performance against Bitcoin will be very significant over the next few weeks. The potential death cross and the support and resistance levels on the chart pinpoint that Solana might experience a difficult time moving forward. If the trend persists, the altcoin could potentially drop as low as 0.001 BTC—a price point that, when measured in dollar terms, is below $100.
Kelvin Munene Murithi
Kelvin is a distinguished writer with expertise in crypto and finance, holding a Bachelor’s degree in Actuarial Science. Known for his incisive analysis and insightful content, he possesses a strong command of English and excels in conducting thorough research and delivering timely cryptocurrency market updates.
Disclaimer: The presented content may include the personal opinion of the author and is subject to market condition. Do your market research before investing in cryptocurrencies. The author or the publication does not hold any responsibility for your personal financial loss.
American asset management company Canary Capital has taken a new leap with a new filing for a staked Tron ETF product. Known as the pioneer of some of the most renowned altcoin ETF products, this new Tron ETF has further placed the firm at the forefront of the exchange-traded fund drive.
The Canary Capital Staked Tron ETF
According to the prospectus released by the firm, the new product is dubbed the Canary Staked TRX ETF. The firm is yet to reveal the trading platform the product will trade on, however, it confirms it will provide exposure to the price of Tron.
Based on the pricing data offered by Coindesk Indices, Canary Capital said it will rely on this to establish the Net Asset Value (NAV) for the product. This latest filing comes barely a month after the asset manager filed for Pengu ETF with the US Securities and Exchange Commission (SEC).
This is a breaking news, please check back for updates!!!
Godfrey Benjamin
Benjamin Godfrey is a blockchain enthusiast and journalists who relish writing about the real life applications of blockchain technology and innovations to drive general acceptance and worldwide integration of the emerging technology. His desires to educate people about cryptocurrencies inspires his contributions to renowned blockchain based media and sites. Benjamin Godfrey is a lover of sports and agriculture.
Disclaimer: The presented content may include the personal opinion of the author and is subject to market condition. Do your market research before investing in cryptocurrencies. The author or the publication does not hold any responsibility for your personal financial loss.

Based on historical data, July could be the next bullish month for the XRP price, which continues to consolidate amid this crypto market downtrend. Despite the market downturn, crypto analysts like CasiTrades are confident that the altcoin could still reach a new all-time high (ATH) in this market cycle.
Historical Data Points To July Being The Next Bullish Month For The XRP Price
Cryptorank data shows that July could be the next bullish month for the XRP price. This is based on the fact that the altcoin has recorded significant gains in each of the last five Julys.
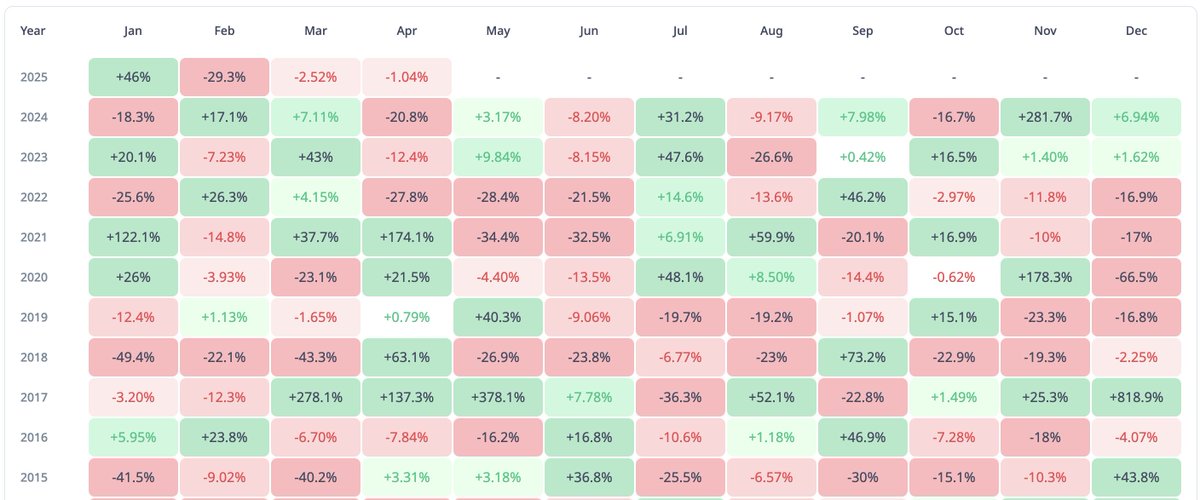
Unlike July, April to June have been mixed for XRP over the last five years. For April, the last three out of five months have been bearish for the altcoin, although it recorded a 174% gain in April 2021.
For May, three out of the last five months have been bearish for the XRP price, although it recorded meagre gains in May 2023 and 2024. Meanwhile, June has been completely bearish for the altcoin, as it recorded monthly losses in the last five months.
It is worth mentioning that four out of the five monthly gains for XRP in July have been double-digit gains. As such, Ripple’s native crypto could again record double-digit gains this coming July.
Interestingly, crypto analyst Egrag Crypto predicted that XRP could reach double digits by its July 21 cycle peak. He alluded to the altcoin’s previous bull runs as to why July could mark this cycle’s peak. The analyst believes the Ripple price could reach $27 by then.
Analysts Argue XRP’s Consolidation Could End Soon
Amid this historical data, crypto analysts Dark Defender and CasiTrades have suggested that the XRP price consolidation could end soon. In an X post, Dark Defender stated that the altcoin’s consolidation is nearing an end and that he believes this is the final consolidation of the monthly structure.
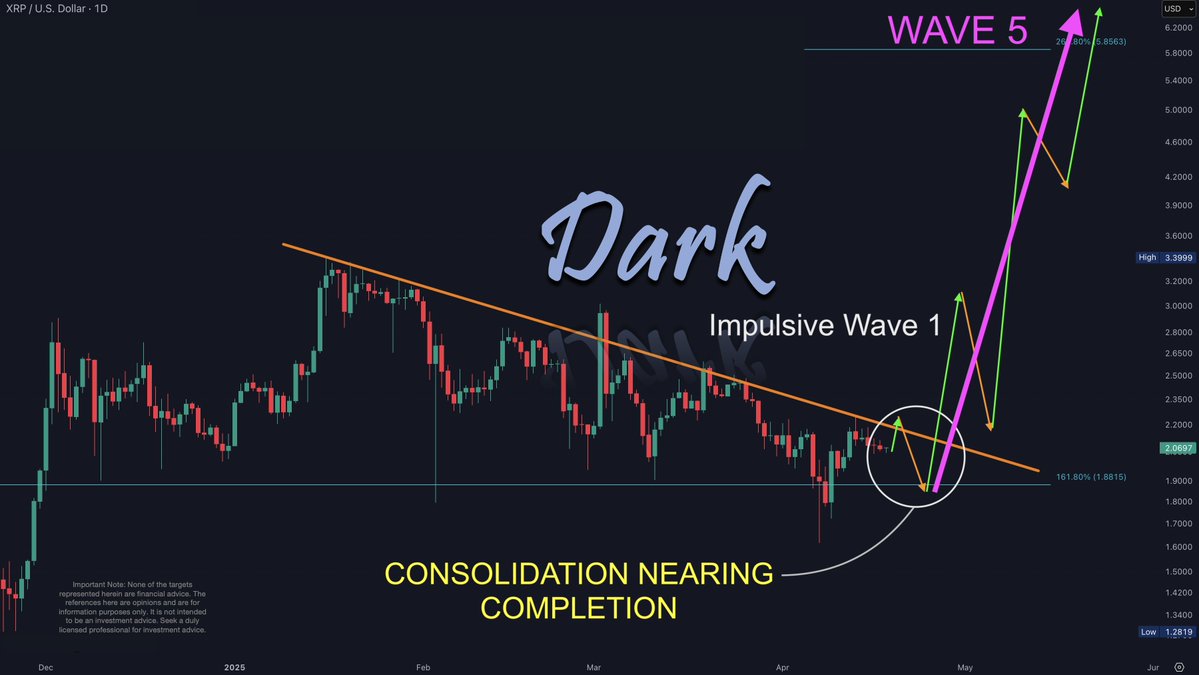
Once this consolidation is done, the crypto analyst remarked that market participants can expect the Wave 5, which will send Ripple’s native crypto to new highs. He highlighted $2.22 and $2.30 as the major resistances to watch out for, while $1.88 and $1.63 are the major support levels. Meanwhile, the targets on this Wave 5 up are $3.75 and $5.85, which will mark a new ATH for the altcoin.
As CoinGape reported, crypto analyst CasiTrades also predicted that the XRP price could soon reach $6 as Wave 2 correction nears its end. The analyst also raised the possibility of the altcoin rallying to as high as $9.50 and $12 if it reaches the 2.618 and 3.618 Fibonacci extension levels, respectively.
However, there is still the possibility of the XRP price dropping below the $2 level before it rallies to new highs. Egrag Crypto warned that Ripple’s native crypto could still drop to as low as $1.4 in the event of a major liquidation.
Boluwatife Adeyemi
Boluwatife Adeyemi is a well-experienced crypto news writer and editor who has covered topics that cut across several topics and niches. Boluwatife has a knack for simplifying the most technical concepts and making it easy for crypto newbies to understand. Away from writing, He is an avid basketball lover, a traveler and a part-time degen.
Disclaimer: The presented content may include the personal opinion of the author and is subject to market condition. Do your market research before investing in cryptocurrencies. The author or the publication does not hold any responsibility for your personal financial loss.
Is Solana Forming a Death Cross Against Bitcoin?

TRUMP Meme Coin Ignores $307M Unlock, Bearish Trend Holds

Solana (SOL) Price Rises 13% But Fails to Break $136 Resistance

Pi Network Roadmap Frustrates Users Over Missing Timeline

MEME Rallies 73%, BONE Follows

Canary Capital Files For Staked Tron ETF

2.52 Million Altcoins Are Ruining Crypto’s Future

Animoca Brands Valuation Tanks 75% In Two Years, Here’s Why

Crypto exchange BingX hacked for $43 million

Are The Big Players Losing Interest?

Hong Kong’s Securities Association Tips Authorities On Crypto Self-Regulation

Coinbase cbBTC Set to go Live on Solana
2.52 Million Altcoins Are Ruining Crypto’s Future
Animoca Brands Valuation Tanks 75% In Two Years, Here’s Why
Crypto exchange BingX hacked for $43 million
Are The Big Players Losing Interest?
Hong Kong’s Securities Association Tips Authorities On Crypto Self-Regulation
Coinbase cbBTC Set to go Live on Solana
-

 Ethereum18 hours ago
Ethereum Fee Plunges To 5-Year Low—Is This A Bottom Signal?
-

 Market21 hours ago
Ethereum Price Fights for Momentum—Traders Watch Key Resistance
-
 Altcoin21 hours ago
Expert Predicts Pi Network Price Volatility After Shady Activity On Banxa
-

 Market19 hours ago
Is XRP’s Low Price Part of Ripple’s Long-Term Growth Strategy?
-

 Market16 hours ago
Bitcoin Price Gears Up for Next Leg Higher—Upside Potential Builds
-
 Altcoin19 hours ago
Shiba Inu Follows Crypto Market Trend With “Shib Is For Everyone” Post, What’s Happening?
-

 Bitcoin17 hours ago
What Good Friday Options Expiry Means for Bitcoin & Ethereum
-

 Market23 hours ago
Sui Meme Coins Surge With Rising DEX Volumes
✓ Share: