
Altcoin
Top 4 Cryptos With Potential for All-Time Highs in July 2024

June closes in three days. So far, the broader crypto market has experienced a tumultuous period. Despite the market condition, a few coins reached new highs.
However, many have had to deal with considerable drawdowns. With July approaching, here are the top four cryptocurrencies that can hit new all-time highs before next month ends.
Binance Coin (BNB) Set Eyes on Massive Rebound
BNB, the exchange coin of Binance, is the first top 5 altcoin to surpass its previous all-time high. Since it reached $720.67 on June 6, the crypto has lost 21.11% of its value. Previously, BeInCrypto reported how BNB traded below crucial moving averages while struggling to recover.
However, things may change as time goes on. According to the BNB/USD daily chart, the Relative Strength Index (RSI), which measures momentum, trends downwards. However, the indicator seems to be heading in the oversold region direction.
Notably, a reading at 30 or below indicates that an asset is oversold. When it is 70 or above, it is overbought. As of this writing, the RSI positions at 38.96, indicating a further downtrend that may drive BNB’s price to $532.40.
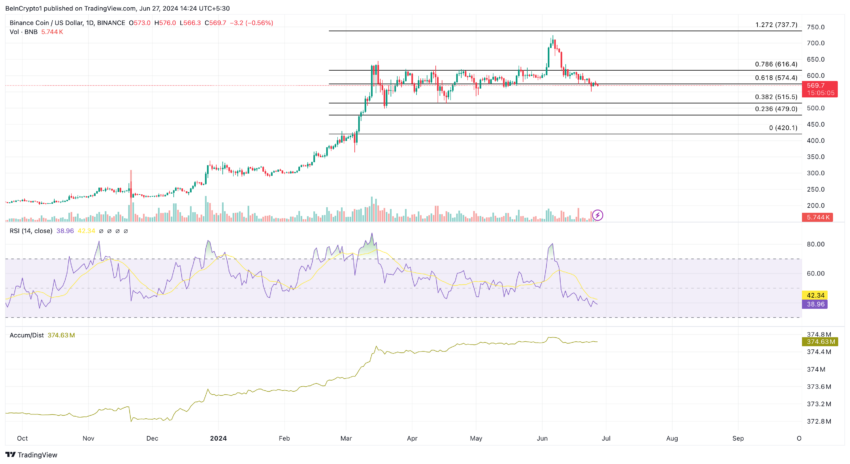
Furthermore, the Accumulation/Distribution (A/D) indicator shows that distribution is not intense. As such, if BNB gets oversold, the price can rebound. In the event that buying pressure increases, the coin’s price may increase by 29.90%, which can produce news all-time highs toward $740.70 in July.
Kaspa (KAS) Seems Ready to Go Higher
KAS is the native cryptocurrency of Kaspa Network, a Proof-of-Work (PoW)-based project that is different from traditional blockchains. Currently, KAS is only 9.61% down from its all-time high of $0.19.
Trading at $0.17, the token has gained 6.75% in the last 24 hours, while its trading volume has increased by a staggering 172.65%. The increase in trading volume clearly shows market interest in KAS.
On the 4-hour chart, bulls can be seen defending the $0.14 and $0.15 support. They also broke through the $0.16 resistance, a major supply zone with bearish interest on June 13.
A look at the Awesome Oscillator (AO), the technical oscillator that also tracks momentum, shows that KAS momentum is bullish. However, the token’s momentum seems to be waning.
Read More: What Is Altcoin Season? A Comprehensive Guide
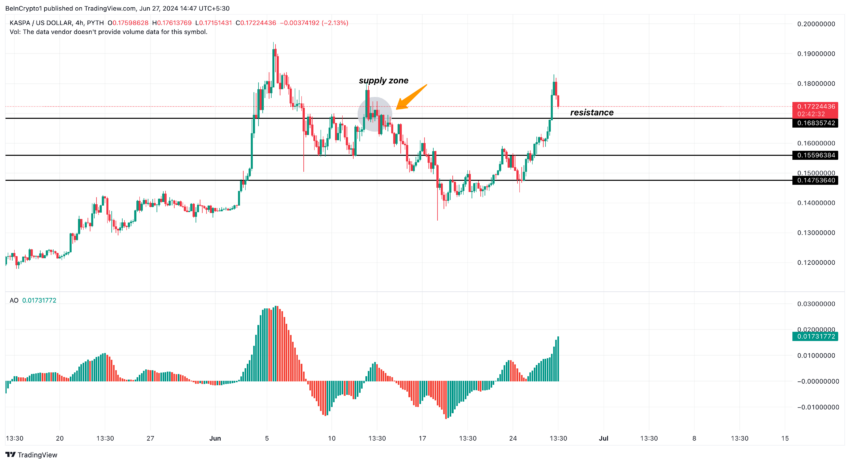
The red candlesticks on the chart reveal this. As such, the KAS price can retest $0.16. But a rebound is possible. If this happens, the cryptocurrency’s value will likely hit $0.20 in July.
Pendle (PENDLE) Plans to Capitalize on Exhaustion
PENDLE, the decentralized liquidity protocol token, reached an all-time high of $7.52 on April 11. The token trades at $5.25, representing a 30.25% decrease from its peak. According to the daily chart, sellers are exhausted, meaning PENDLE may be set to erase some losses.
This is evident in the indications from the Parabolic SAR. This indicator spots prices that can be entry (buy) or exit (sell) signals. When the dotted lines are below the price, a bullish reversal is close. On the other hand, if the lines are above it, it means it is time to sell, and the price can decrease.
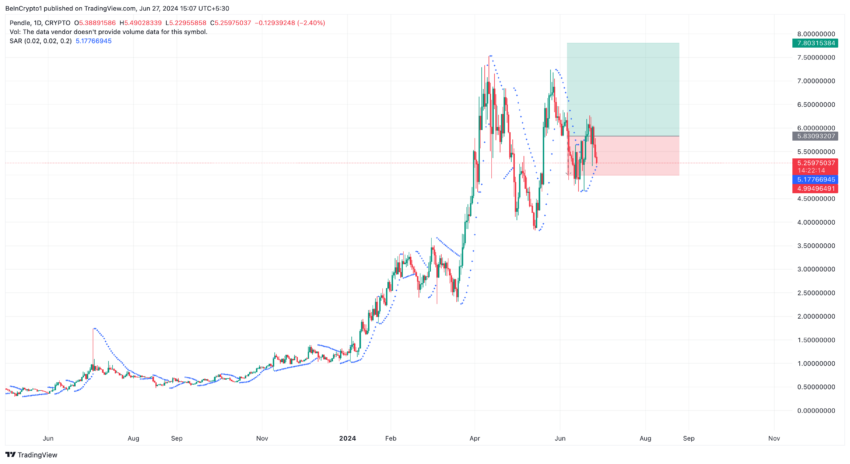
As of this writing, the Parabolic SAR is at $5.17, suggesting that PENDLE may soon bounce off the lows. In addition, market participants may take advantage of the discount. If this happens, PENDLE’s price may hit 7.80 before the end of next month.
In the meantime, traders must watch out for developments related to the project. For example, Pendle plans to unlock another round of tokens in a few days. This may cause high volatility around the token’s price. But if the dust settles later in the month, the price can begin to rise to new all-time highs.
Brett (BRETT) Bulls Provide Cover Against Bears
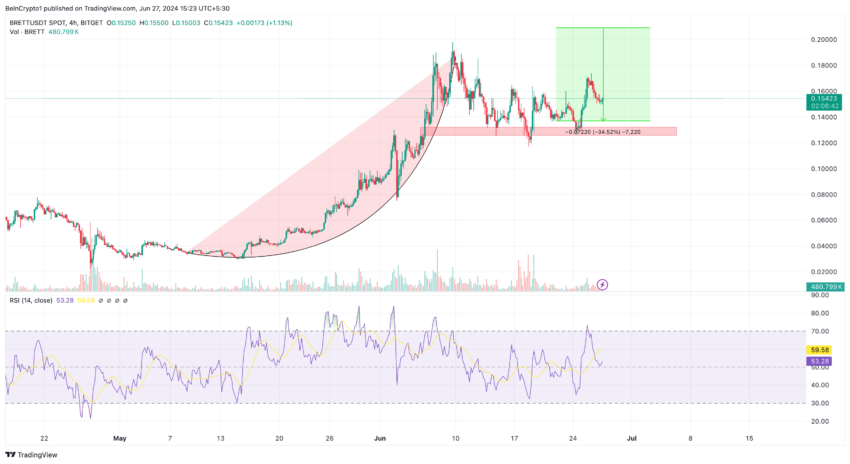
Last on the list is BRETT, the top crypto and meme coin developed on Coinbase layer-2 network Base. According to the 4-hour chart, BRETT formed a parabolic pattern between May 9 and June 9. During this time, the price went from $0.033 to $0.19.
However, the parabolic curve pattern formation indicates that the cryptocurrency hit saturation at its crest. Hence, it is expected that the price will reverse as BRETT currently trades at $0.15. Despite the decline, the RSI is able to refrain from falling below the 50.00 midpoint.
This proves that bulls are committed to defending the support at $0.13. Should this continue into next month, BRETT’s price can avoid going lower. If so, the price can test new all-time highs between $0.20 and $0.21.
Read More: What Are Meme Coins?
In conclusion, it is worth noting that these projected all-time highs are subject to market changes. If July becomes a far better month than June, these cryptos will most likely reach the aforementioned targets. However, if the market faces an uphill battle with bears, some of the forecasts may be invalidated.
Disclaimer
In line with the Trust Project guidelines, this price analysis article is for informational purposes only and should not be considered financial or investment advice. BeInCrypto is committed to accurate, unbiased reporting, but market conditions are subject to change without notice. Always conduct your own research and consult with a professional before making any financial decisions. Please note that our Terms and Conditions, Privacy Policy, and Disclaimers have been updated.


Crypto inflows hit $226 million last week, signaling a cautiously optimistic investor sentiment amid ongoing market volatility.
According to CoinShares data, altcoins broke a five-week streak of negative flows, recording their first inflows in over a month.
Crypto Inflows Hit $226 Million Last Week
This turnout marks a significant slowdown from the previous week when crypto inflows hit $644 million, ending a five-week outflow streak. Before that, inflows peaked at $1.3 billion, with Ethereum outpacing Bitcoin in investor demand.
“Digital asset investment products saw $226 million of inflows last week suggesting a positive but cautious investor,” read an excerpt in the report.
The pullback to $226 million last week suggests a more measured approach by investors as they assess macroeconomic conditions and regulatory uncertainties.
Specifically, CoinShares’ researcher James Butterfill ascribes Friday’s minor outflows of $74 million to core personal consumption expenditure (PCE) in the US, which came in above expectations.
“The Fed’s preferred measure of inflation (Core PCE) moved up to 2.8% in February & remains well above their 2% target that has yet to be achieved. The market is expecting the Fed to hold rates steady again at their next meeting on May 7 (at 4.25-4.50%),” investor Charlie Bilello noted.
Nevertheless, this turnaround comes after nine consecutive trading days of inflows into crypto ETPs (exchange-traded products).
Despite the slowdown, Bitcoin continued to attract strong inflows of $195 million. Meanwhile, short-Bitcoin products registered outflows of $2.5 million for the fourth consecutive week. This suggests that investors are leaning bullish on Bitcoin, even as altcoins begin to recover.
The CoinShares report shows that altcoins saw $33 million in inflows last week after suffering $1.7 billion in outflows over the past month.
Altcoins Rebound After $1.7 Billion in Outflows
Ethereum (ETH) led the recovery, attracting $14.5 million, then Solana (SOL) at $7.8 million, while XRP and Sui recorded $4.8 million and $4.0 million, respectively. Market analysts believe altcoins may be bottoming out, creating potential buying opportunities.
“Altcoins are oversold. The bottom is close. We’re ready for a bounce,” renowned analyst Crypto Rover highlighted.
Other analysts echoed the sentiment, suggesting growing attention toward altcoins. Among them was trader Thomas Kralow, who said, “altcoins are setting up for a comeback.”
Adding credence to this bullish outlook for altcoins, project researcher BitcoinHabebe, known for insightful mid-low cap sniper entries, pointed to technical indicators suggesting a market reversal.
“While bears are trying to spread fear & make you sell your altcoins, the TOTAL3 [Altcoins market cap chart excluding Bitcoin and Ethereum] just bounced off an HTF [higher timeframe] retest,” the analyst stated.
This means most coins have bottomed out and are expected to start reversing soon. Cole Garner noted a key buy signal in market liquidity metrics, further supporting this view.
“Tether Ratio Channel already flashed a double buy signal this month. Now my lower timeframe version is popping off. Fresh capital incoming,” he indicated.
The Tether Ratio Channel is an on-chain analytical tool that helps traders identify potential buy signals. It tracks the ratio of Bitcoin’s market capitalization to that of stablecoins, acting as a leading indicator for short- to medium-term trends.
When the ratio hits certain levels, it can signal shifts in market sentiment, often indicating whether fresh capital is entering or exiting the market.
While overall crypto inflows have slowed compared to previous weeks, the return of capital into altcoins suggests renewed investor confidence. Analysts see signs of an impending altcoin rally, with market metrics indicating that most coins have bottomed out.
As investors weigh macroeconomic uncertainties, the coming weeks could be critical in determining whether the altcoin recovery sustains momentum or if caution prevails.
Disclaimer
In adherence to the Trust Project guidelines, BeInCrypto is committed to unbiased, transparent reporting. This news article aims to provide accurate, timely information. However, readers are advised to verify facts independently and consult with a professional before making any decisions based on this content. Please note that our Terms and Conditions, Privacy Policy, and Disclaimers have been updated.

Cardano price is repeating a pattern from 2024 that experts say is a signal for a massive pump in the coming weeks. While present figures are largely underwhelming for ADA, investors are brimming with confidence for a strong reversal in the near future.
Cardano Price Can Reach $2.5 In May
According to pseudonymous cryptocurrency analyst Master Kenobi, Cardano price is exhibiting cyclical behavior. In a post on X, Master Kenobi notes that ADA’s consolidation in recent days mirrors its price action from Q3 of 2024.
At the time, Cardano’s price suffered a steep correction in early August and endured a lengthy consolidation period before rallying. Presently, Cardano’s price is consolidating after the deep in early February that sent prices to $0.49.
“ADA is currently in a consolidation phase that resembles its behavior from August-September 2024,” said Master Kenobi. “Since the dip on August 5, it hasn’t recorded a new low – just as it hasn’t now, following the dip on February 3.”

According to Master Kenobi, a lengthy consolidation phase will be the precursor for an impressive rally for Cardano’s price. The analyst theorizes that the incoming rally will send Cardano to impressive levels in May. In the short term, analysts are eyeing ADA to hit $1, citing rising whale activity and positive fundamentals.
“If this pattern holds, May could bring a massive pump, potentially pushing the price toward $2.5,” said Master Kenobi.
ADA Ripples With Bullish Activity
At the moment, Cardano price is trading at $0.6646, a far cry from its all-time high of $3.10. Despite the lull in price action, the ecosystem is brimming with bullish activity for higher valuation.
Investors have their eyes on $10 after ADA outperformed top S&P 500 companies in a strong show of resilience. Futhermore, increased whale activity in the space is signaling an impending rally for ADA as community sentiment reaches an all-time high.
Analysts have opined that an ADA rally to $10 is not a crazy prediction, citing a slew of positive fundamentals for the network. However, pundits are urging investors to brace for multiple corrections in the march to reach a valuation of $10.
Aliyu Pokima
Aliyu Pokima is a seasoned cryptocurrency and emerging technologies journalist with a knack for covering needle-moving stories in the space. Aliyu delivers breaking news stories, regulatory updates, and insightful analysis with depth and precision. When he’s not poring over charts or following leads, Aliyu enjoys playing the bass guitar, lifting weights and running marathons.
Disclaimer: The presented content may include the personal opinion of the author and is subject to market condition. Do your market research before investing in cryptocurrencies. The author or the publication does not hold any responsibility for your personal financial loss.
Crypto analyst Egrag Crypto has again provided a bullish outlook for the XRP price. This time, he alluded to historical trends to explain why the altcoin can hit a new all-time high (ATH) in 90 to 120 days.
Why The XRP Price Can Hit ATH In 90 To 120 Days
In an X post, Egrag Crypto alluded to historical patterns to explain why the XRP price can hit a new ATH in the next 90 to 120 days. He noted that the RSI chart shows important historical patterns and stated that the altcoin usually has two peaks during its bull runs.
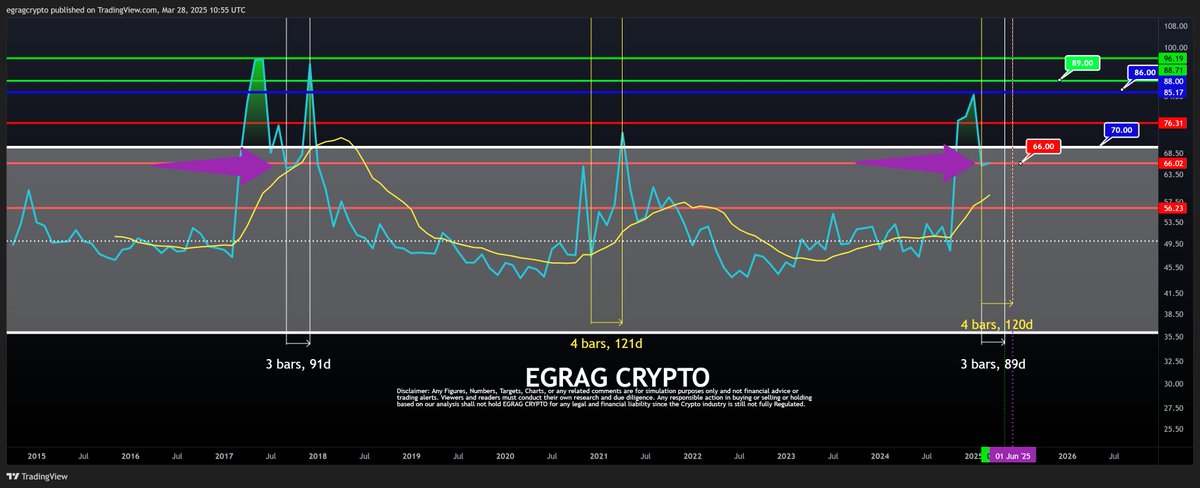
The crypto analyst further revealed that in 2021, the second peak occurred after 90 days, while in 2017, it occurred after 120 days. Based on this, Egrag Crypto affirmed that this historical timeframe provides market participants with a potential for a “great opportunity,” hinting at the altcoin hitting a new ATH.
In another post, he raised the possibility of the XRP price reaching a new ATH of $3.9 by May. This came as he identified an Inverse Head and Shoulder pattern, which was forming for the altcoin. The crypto analyst stated that the measured move is $3.7 to $3.9.
For now, an XRP analysis has shown that the altcoin is struggling at $2.15 amid regulatory uncertainty over SEC Chair nominee Paul Atkins. In his update on this Inverse Head and Shoulder pattern, Egrag Crypto remarked that a close above $2.24, the Fib 0.888, is the next minor target. He affirmed that the pattern is still unfolding as anticipated.
Ripple’s Native Token Could Still Drop Below $2
Crypto analyst Dark Defender has predicted that the XRP price could still drop below $2 before the next leg up. In an X post, he stated that Ripple’s native token is in the 4th Wave of the Monthly Elliott Wave structure.
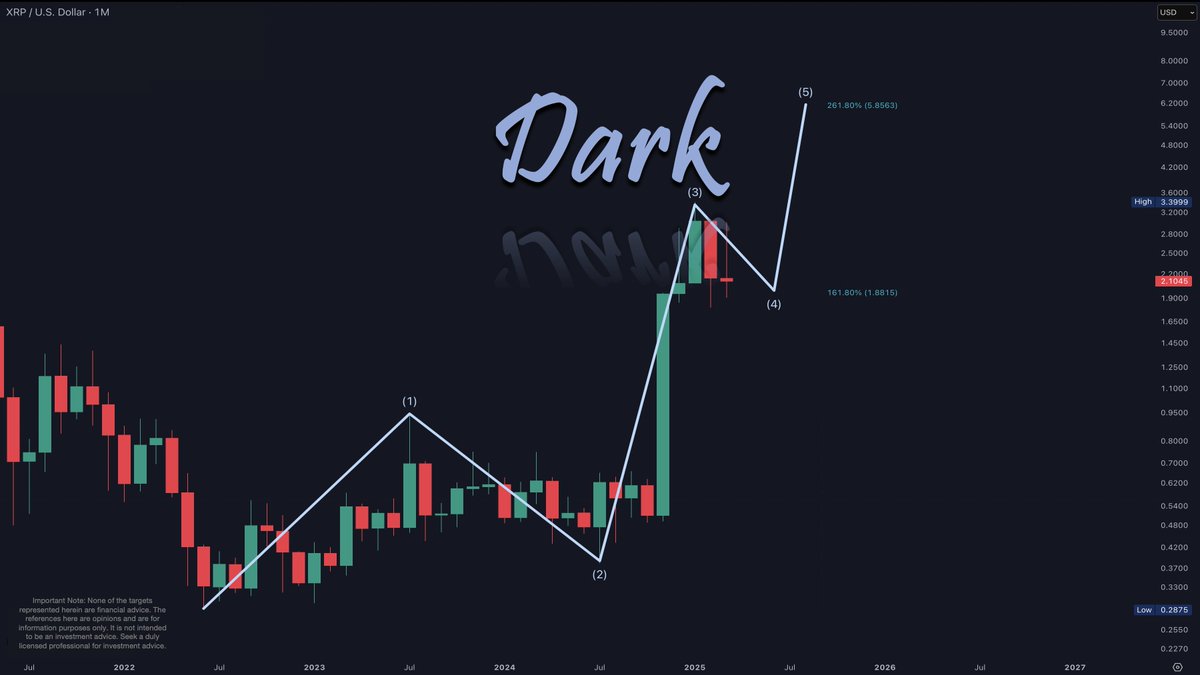
His accompanying chart showed that XRP could drop to as low as $1.88 on this Wave 4 corrective move. Once that is done, the altcoin will witness its next leg up, rallying to as high as $5.8, which would mark a new ATH.
Dark Defender assured that Wave 4 will end soon and that XRP will continue to reach its targets. The crypto analyst recently affirmed that the altcoin is the “one” and explained why it would dominate Bitcoin and Ethereum.
Crypto analyst CasiTrades also suggested that XRP could further decline before its next leg to the upside. She noted that after the drop to $2.27, the altcoin showed no bullish RSI divergence, which signaled that the drop wasn’t quite done yet.
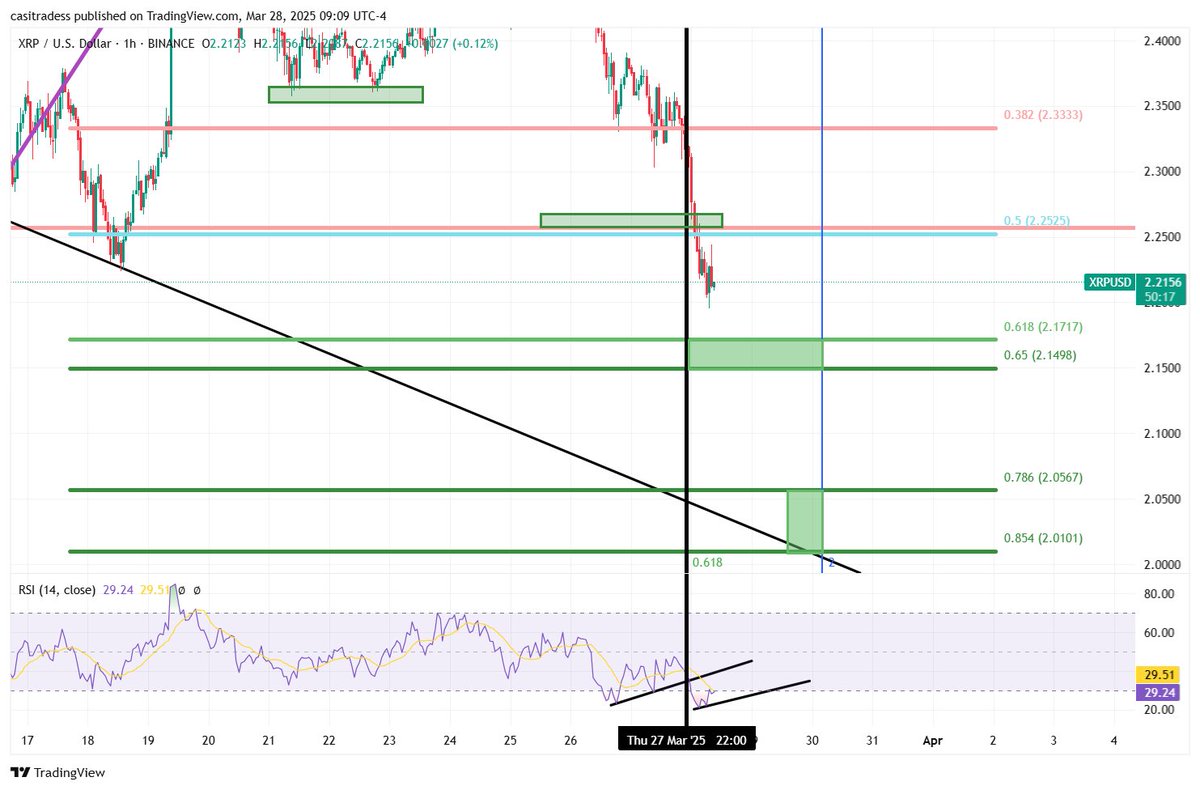
She added that the coin is now likely heading down to test the 0.618 golden retracement at $2.17, or possibly the golden pocket at $2.15 for a final low before “lift-off.” However, CasiTrades also mentioned that RSI is starting to build the bullish divergence and that the selling pressure is exhausting.
Boluwatife Adeyemi
Boluwatife Adeyemi is a well-experienced crypto news writer and editor who has covered topics that cut across several topics and niches. Boluwatife has a knack for simplifying the most technical concepts and making it easy for crypto newbies to understand. Away from writing, He is an avid basketball lover, a traveler and a part-time degen.
Disclaimer: The presented content may include the personal opinion of the author and is subject to market condition. Do your market research before investing in cryptocurrencies. The author or the publication does not hold any responsibility for your personal financial loss.
Trump Family Gets Most WLFI Revenue, Causing Corruption Fears

BNB Breaks Below $605 As Bullish Momentum Fades – What’s Next?
Strategy Adds 22,048 BTC for Nearly $2 Billion

Ethereum Price Confirms Breakout From Ascending Triangle, Target Set At $7,800

Pi Network Struggles, On Track for New All-Time Low
USDC Issuer Circle Set To File IPO In April, Here’s All

2.52 Million Altcoins Are Ruining Crypto’s Future

Animoca Brands Valuation Tanks 75% In Two Years, Here’s Why

Crypto exchange BingX hacked for $43 million

Are The Big Players Losing Interest?

Hong Kong’s Securities Association Tips Authorities On Crypto Self-Regulation

Coinbase cbBTC Set to go Live on Solana
2.52 Million Altcoins Are Ruining Crypto’s Future
Animoca Brands Valuation Tanks 75% In Two Years, Here’s Why
Crypto exchange BingX hacked for $43 million
Are The Big Players Losing Interest?
Hong Kong’s Securities Association Tips Authorities On Crypto Self-Regulation
Coinbase cbBTC Set to go Live on Solana
-

 Market24 hours ago
Solana (SOL) Price Risks Dip Below $110 as Bears Gain Control
-
Altcoin18 hours ago
Cardano Price Eyes Massive Pump In May Following Cyclical Patern From 2024
-

 Market14 hours ago
Bitcoin Bears Tighten Grip—Where’s the Next Support?
-

 Market13 hours ago
Ethereum Price Weakens—Can Bulls Prevent a Major Breakdown?
✓ Share: