
Altcoin
Thinking Of Selling Dogecoin? Analyst Says These Fibonacci Levels Are Important

The broader market is in decline, and like many top cryptocurrencies, Dogecoin (DOGE) faces bearish pressure with volatile price movements. Given its currently weak position, many have considered selling off their bags. With this in mind, a crypto analyst has outlined his sell-off strategy, highlighting key Fibonacci levels that could serve as optimal exit points.
Dogecoin Sell Strategy: Fibonacci Levels To Watch
In a recent X (formerly Twitter) post, crypto analyst the Charting Guy discussed his strategy for selling Dogecoin based on Fibonacci extension and retracement levels and overall market trends. The analyst declared that if the Dogecoin price rises to the 0.702 or 0.786 Fibonacci level over the next few months and fails to break above it, he would sell off the majority of his DOGE holdings. This selling strategy aims to mitigate potential losses and attain as much profit as possible, even with the market’s weakness.
The Charting guy disclosed that his thesis for the future Dogecoin price action suggests that a bottom may be forming, followed by a potential market peak by late April or early May. He announced that he planned to sell his bags close to this price peak, expecting a severe breakdown to new lows in March 2025.
Sharing a Dogecoin price chart on a weekly time frame, the Charting guy draws several Fibonacci retracement and extension levels from a key high and low. The 0.702 Fib level at $0.43 is acting as a potential resistance zone for Dogecoin.

If the meme coin can claim and break through this resistance level, the crypto analyst predicts that it could regain its former bullish momentum and aim for higher Fibonacci levels. This could lead to a gradual climb past key Fib levels: 0.618 ($0.26), 0.786 ($0.42), 0.888 ($0.55), 1 ($0.76), 1.272 ($1.60), 1.414 ($2.36), and ultimately 1.618 ($4.1), the highest bullish target.
On the flip side, if Dogecoin fails to break this level and gets rejected, it would confirm a broader market weakness and possibly lead to a deeper price correction to lower Fibonacci support levels of 0.382 ($0.139), 0.236 ($0.09), 0.136 ($0.07), and 0 ($0.0491).
Before then, the Charting guy stated that he would sell his bags rather than hold out for a rise to $1. He plans to exit the market between $0.32 and $0.42, prioritizing profit taking over unnecessary risks.
Golden Pocket Weakens DOGE’s Bullish Outlook
While the Charting Guy projects a bullish and bearish outlook for Dogecoin, the crypto analyst also highlights that the popular meme coin has weakened, reinforcing the possibility of a more negative price action. He disclosed that Dogecoin lost its Golden Pocket around the 0.618 ($0.267)—0.65 Fib ($0.30) levels.
This Golden Pocket loss had weakened DOGE’s position, making it riskier to hold long-term and invalidating the analyst’s bullish charts.
Featured image from Unsplash, chart from Tradingview.com
Editorial Process for bitcoinist is centered on delivering thoroughly researched, accurate, and unbiased content. We uphold strict sourcing standards, and each page undergoes diligent review by our team of top technology experts and seasoned editors. This process ensures the integrity, relevance, and value of our content for our readers.


PumpFun has transferred 95,934 SOL, worth approximately $13.34 million, to Kraken, further adding to the total 1,818,889 SOL moved to the exchange in 2025, equating to around $324.06 million.
This move marks a continued trend of significant activity surrounding Solana (SOL), reflecting growing investor interest. As SOL consolidates its price following recent bullish trends, this development raises questions about the potential direction of the cryptocurrency.
PumpFun Whale Activity and SOL’s Recent Performance
According to blockchain data provider Lookonchain, PumpFun’s recent deposit adds to a growing list of whale activities. So far, in 2025, the total SOL moved to Kraken by PumpFun alone exceeds 1.8 million, highlighting a considerable volume of transactions. Solana’s price has shown notable strength, especially in light of recent whale movements, which tend to indicate investor confidence.
Solana’s price has recently cleared significant resistance levels, with many analysts suggesting the cryptocurrency is in a strong upward trend. A crypto analyst, Ted, has pointed out that the SOL price is showing bullish signs similar to the Q4 of 2022.
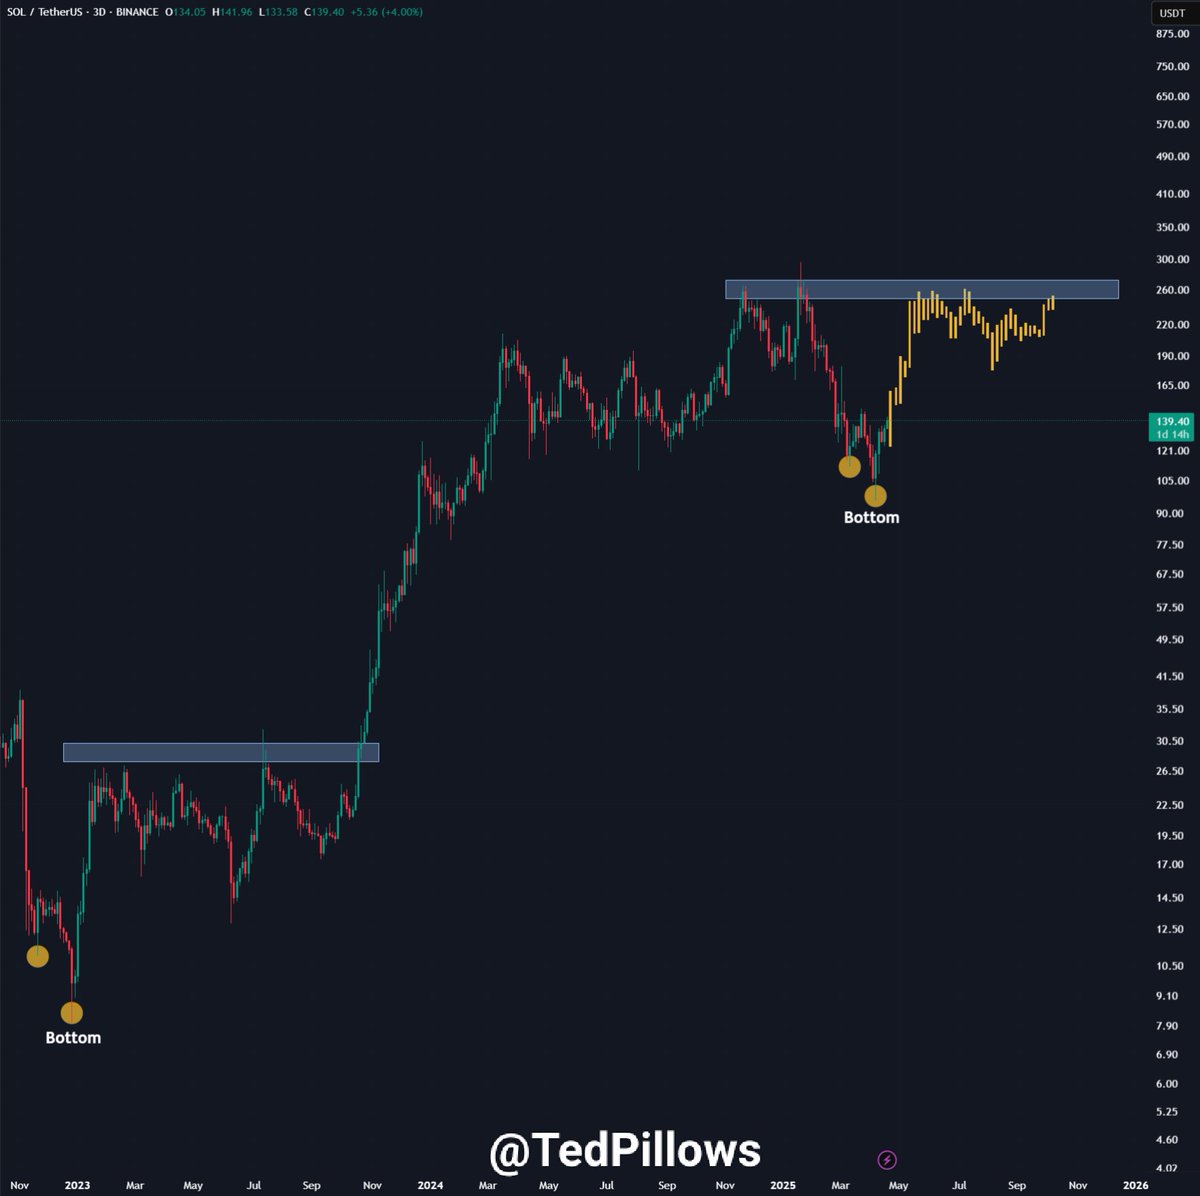
Ted suggests that SOL could see price levels between $160 to $180 by May 2025, with the potential for an all-time high later in the year. As whale activity continues, these predictions may influence market sentiment further.
Institutional Interest in Solana Surges
Institutional players’ participation is another factor that gives optimism to the SOL’s bullish run. Another player in the game is Galaxy Digital, though it has recently started making major withdrawals, pulling out about $77m worth of SOL from exchanges starting mid-April.
This also involved a substantial $19.5 million sell-off from Binance, showing faith in Solana’s potential. Other market players, such as Janover, also bought over $10m worth of Solana, validating the optimistic forecast for SOL price.
Such actions from institutional investors are usually viewed in the market as strong signs of confidence. Based on Galaxy Digital’s withdrawal, it could be estimated that large investors are preparing for higher SOL gains, which underlines the upbeat sentiment in Solana price. This increase in institutional support could enhance the overall market sentiment and help SOL rise in the short run.
Growing Number of Large Solana Holders
In addition to institutional interest like PumpFun’s, large retail investors are also becoming more active in Solana. Analyst Ali Martinez reported that the number of wallets holding 10,000 or more SOL increased by 1.53% in the past week.
This uptick, which grew from 4,943 wallets to 5,019, suggests that bigger holders are accumulating more Solana quietly. Such accumulation often occurs before broader market recognition, which can lead to price rallies.
This pattern of increasing wallet activity from significant holders further points to confidence in Solana’s potential. If these large investors continue to increase their positions, the demand for SOL could continue to rise, creating upward pressure on its price. The accumulation could be a sign that some are positioning themselves ahead of a potential breakout in price.
SOL Technical Analysis and Price Forecasts
The recent movement in Solana price has caught traders’ attention, with some analysts forecasting a continued rise. Another crypto analyst, Learnernoearner, suggested that an inverse head and shoulders pattern may be forming, indicating a potential long-entry opportunity.
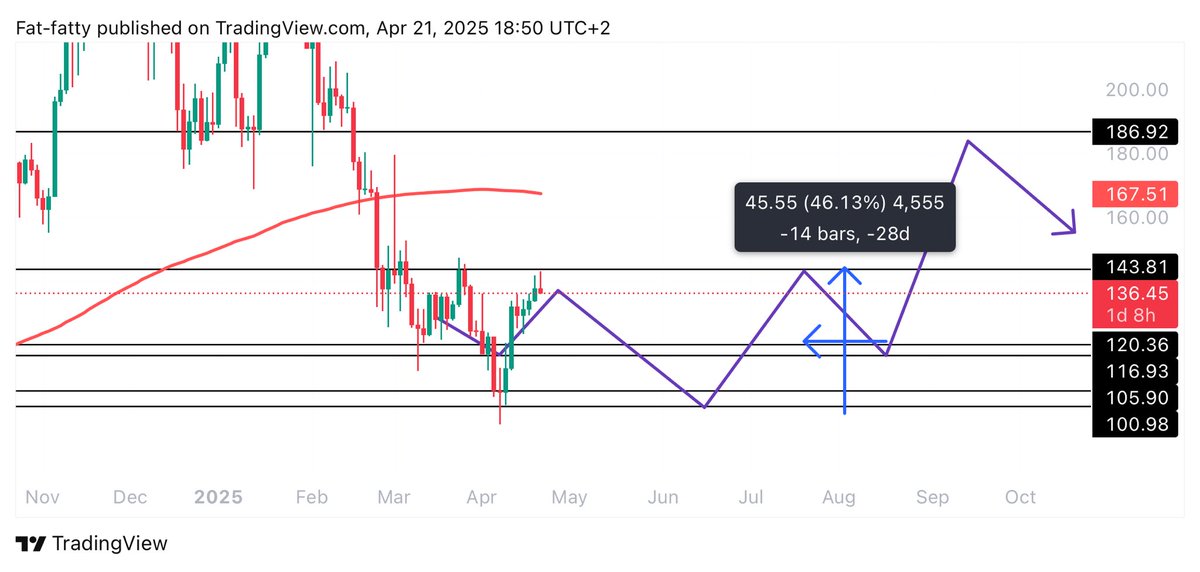
If Solana price experiences a brief pullback, this could provide an attractive entry point for traders.
Key technical levels for SOL price include support at $125, immediate resistance at $135, and a breakout zone at $178. If SOL price breaches the $178 mark, further targets could include $199, $216, and $238, and some even suggest a rally to $2000.
Kelvin Munene Murithi
Kelvin is a distinguished writer with expertise in crypto and finance, holding a Bachelor’s degree in Actuarial Science. Known for his incisive analysis and insightful content, he possesses a strong command of English and excels in conducting thorough research and delivering timely cryptocurrency market updates.
Disclaimer: The presented content may include the personal opinion of the author and is subject to market condition. Do your market research before investing in cryptocurrencies. The author or the publication does not hold any responsibility for your personal financial loss.
Ark Invest, the asset management firm owned by Cathie Wood, has gained its first exposure to Solana as the broader financial market expands its adoption of cryptocurrencies. The firm has added exposure to two tech investment vehicles via the 3iQ Solana Staking ETF (SOLQ). Market analysts believe this move validates SOL, a front-runner for spot altcoin ETF in the US.
The Ark Invest Solana Exposure
According to the Citywire report, the ARK Next Generation Internet ETF (ARKW) and ARK Fintech Innovation ETF (ARKF) have SOLQ in their respective portfolios. These Cathie Wood’s funds bought 237,500 shares of SOLQ apiece, validating the Solana fundamentals.
Canadian regulators approved the 3iQ SOL ETF for trading earlier this month, alongside other crypto funds from Purpose, Evolve, and CI. These ETF products went live on schedule on April 16, placing them in line for mainstream exposure.
As Ark Invest revealed in its press release, the Solana architecture and its design for speed and efficiency make it ideal for the next generation of the internet. With the bet, the Cathie Wood firm has made history as the first U.S.-based ETF to gain exposure to Solana.
Beyond Ark Invest and Solana: Portfolio Diversification Goes Mainstream
Asset management firms are shifting toward crypto products, a move beyond ARK and SOL. As CoinGape reported earlier, Charles Schwab has revealed plans to launch crypto trading later this year. The firm, with $10 trillion in assets under management, may add more credence to the nascent asset class if it pulls through with its plans.
Under President Donald Trump, the improving crypto regulation landscape has given asset managers like Ark Invest the long-sought leverage to bet on the market. The precedent was set earlier with spot Bitcoin and Ethereum ETF approval in 2024.
With key agencies like the Securities and Exchange Commission (SEC), Commodity Futures and Trading Commission (CFTC), and Federal Deposit Insurance Commission (FDIC) now aligned to crypto, more firms may soon join the diversification move.
Crypto ETFs and Role In TradFi Embrace
Despite the generally positive regulatory environment, many traditional financial firms are still skeptical of direct exposure to crypto. While many, like Ark Invest, do not mind the volatility, custody remains a major challenge.
More relatable products like Spot XRP ETF have been lodged with the SEC to mitigate this. With asset managers going all out in their bid, Solana, Hedera, Litecoin, and Dogecoin, among other assets, are also awaiting potential approvals from the SEC.
While the market regulator was skeptical of these kinds of products in the past, it now takes a different stance. Market experts expect approval before the end of this year.
Godfrey Benjamin
Benjamin Godfrey is a blockchain enthusiast and journalists who relish writing about the real life applications of blockchain technology and innovations to drive general acceptance and worldwide integration of the emerging technology. His desires to educate people about cryptocurrencies inspires his contributions to renowned blockchain based media and sites. Benjamin Godfrey is a lover of sports and agriculture.
Disclaimer: The presented content may include the personal opinion of the author and is subject to market condition. Do your market research before investing in cryptocurrencies. The author or the publication does not hold any responsibility for your personal financial loss.
XRP price seems to be headed for a dramatic turning point, with various analysts citing bullish chart patterns that indicate a probable price spike over the next few months. The fourth-largest crypto is showing a strong technical setup on the 6-month candle chart, with formerly limiting resistance points now eliminated.
XRP Price Displays Eliminated Resistance And Bullish RSI
Technical analyst Dark Defender has posted a tweet that shows a 6-month candle chart indicating these “Eliminated Resistance” levels and a “Bullish RSI” (Relative Strength Index) indicator. The chart indicates that XRP has broken above significant historical resistance levels that previously capped price action.
Several price targets have emerged from analysts tracking the cryptocurrency. The analysts’ projections range from approximately $3.75 to over $18 in the coming months. Despite these bullish technical signals, sentiment indicators remain cautious, and the Fear & Greed Index shows a reading of 39. This places it in the “Fear” category.
6-Monthly time frame update on #XRP
Be honest: Is it Bullish or Bearish in the next 6 months?
The last candle will be closed by the end of June.
Short-Mid Term Targets: $3.75, $5.85, $18.22 (NFA)
I wish you an excellent weekend and a Happy Easter 🐣with your loved ones!… pic.twitter.com/pmuBkrn8Pe
— Dark Defender (@DefendDark) April 19, 2025
The 6-month candle chart for XRP/USD shared by analyst Dark Defender highlights two key technical factors that could support a potential price surge. First, the chart identifies multiple “Eliminated Resistance” levels that XRP has now cleared. This removes previous price ceilings that constrained upward movement in past cycles.
These eliminated resistance zones appear at different points on the historical chart, with the most recent breakthrough occurring in the latest completed candle. According to Dark Defender, this technical development raises an important question for traders: “Is it Bullish or Bearish in the next 6 months?” The analyst indicates that the present candle will close at the end of June 2025, giving the traders a time frame for possible price action.
The second important technical signal highlighted is a “Bullish RSI” reading. The Relative Strength Index, at the lower part of the chart, is shown to be on the rise, moving into bullish levels above the 70 level. This momentum indicator shows increasing buying pressure behind XRP’s recent price action.
XRP Could Soon Hit $5
CryptoBull analyst provides additional technical analysis, labeling the pattern as a massive bullish falling wedge with an even larger bullish triangle encompassing the wicks. The analyst predicts a breakout from the patterns and a target price that could see XRP go as high as $5 before finally landing at a base of $3.85.
#XRP Update: huge bullish falling wedge with an even bigger bullish triangle covering the wicks. We will break out soon and price will wick up to $5 and close around $3.85. pic.twitter.com/rqbIASYRpl
— CryptoBull (@CryptoBull2020) April 21, 2025
There have been suggestions by analysts about specific price targets for XRP in their outlook. Dark Defender shared short-term to medium-term target prices of $3.75, $5.85, and a wildly high target at $18.22.
CryptoBull offered a more detailed price action prediction and indicated that XRP is going to breakout in the near future with price action that can include a wick up to $5 and close around $3.85.
Amidst these modest predictions, certain analysts even predicted the XRP price to reach $280. Another analyst, Captain Faibik, instructed followers to continue purchasing XRP. He further added that the next increase will be “explosive” to the $5 level in the mid-term. Multiple analysts in agreement at the $5 level indicate it might be a key target for traders and investors.
Keep accumulating $XRP, Next Bullish leg will be explosive..📈
Midterm Target : 5$ 🎯
#XRP #XRPArmy #XRPUSDT pic.twitter.com/95TKndWlws
— Captain Faibik 🐺 (@CryptoFaibik) April 21, 2025
Though analysts are optimistic, the prevailing mood in the market is cautious. CoinCodex indicates their latest forecast predicts that XRP could drop by 8.35% to $1.95 on May 21, 2025. CoinCodex also predicts that XRP had 13 days of gain in the previous 30 days (43%), and price activity has averaged 7.48% in the last 30 days.
Vignesh Karunanidhi
Vignesh Karunanidhi is a seasoned crypto journalist with nearly 7 years of experience in the cryptocurrency industry. He has contributed to numerous publications, including WatcherGuru, BeInCrypto, Milkroad, and authored over 10,000 articles
Disclaimer: The presented content may include the personal opinion of the author and is subject to market condition. Do your market research before investing in cryptocurrencies. The author or the publication does not hold any responsibility for your personal financial loss.

Report Alleges Massive Meme Coin Sniping on Pump.fun

Solana Leads Blockchain Metrics as SOL Momentum Builds

Crypto Firms Donated $85 million in Trump’s Inauguration

Ethereum to Emphasize Layer-1 Efficiency and UX in Upcoming Protocol Upgrades

XRP Surpasses Ethereum In This Major Metric After Outperforming For 6 Months
PumpFun Moves $13M SOL To Kraken as Solana Price Consolidates, What Next?

2.52 Million Altcoins Are Ruining Crypto’s Future

Animoca Brands Valuation Tanks 75% In Two Years, Here’s Why

Crypto exchange BingX hacked for $43 million

Are The Big Players Losing Interest?

Hong Kong’s Securities Association Tips Authorities On Crypto Self-Regulation

Coinbase cbBTC Set to go Live on Solana
2.52 Million Altcoins Are Ruining Crypto’s Future
Animoca Brands Valuation Tanks 75% In Two Years, Here’s Why
Crypto exchange BingX hacked for $43 million
Are The Big Players Losing Interest?
Hong Kong’s Securities Association Tips Authorities On Crypto Self-Regulation
✓ Share: