
Altcoin
Sui Price Sees Explosive Growth Amid Increasing Daily Active Addresses: Will It Hit $8?
The Sui token is currently making significant rebound, outperforming top cryptocurrencies including Bitcoin, Ethereum, and XRP. While these assets are exhibiting modest gains in line with the broader market trend, the Sui price is making impressive strides, surging over 7% in a single day. This significant uptick has sparked optimism, with market analysts and experts remaining bullish on the altcoin’s potential to reach new all-time highs.
Sui Price Breaks Past Crucial Resistance, Eyes $8
Notably, Sui’s current bullish trend significantly influences traders and analysts. While traders demonstrate this optimistic view via increasing market activity, analysts express their positive predictions. For instance, market expert CryptoBullet forecasted the Sui price’s surge to a new all time-high of $8.9 in an X post.
In a one-day chart, CryptoBullet highlighted SUI’s prevailing consolidation below 0.618 Fibonacci level. Significantly, SUI has touched twice the same price level within months. Driven by past trends, CryptoBullet remains confident that the Sui price could hit new ATH breaking past this consolidation.
Increasing Daily Active Addresses: How It Impacts Token Price?
According to investor Momin, SUI looks primed for higher highs triggered by increasing daily active addresses. Reportedly, the daily active wallets hit a record high of 1.2 million, paving the way for a massive breakout in the Sui price. Acknowledging the platform’s growth, the trader wrote, “Sui Network is undeniably one of the fastest-growing chains fundamentally!”

Another trader Giannis Andreou underscored the substantial surge in Sui’s daily active wallets. Currently marked at 1,253,935, the daily active addresses increased by a staggering 135.89% over the last seven days.
Meanwhile, Quinten Francois, a prominent crypto voice on X, wrote, “SUI active addresses are exploding.” The substantial surge in Sui’s price, coupled with a growing user base, has garnered significant attention, especially considering the token’s recent 36% downturn.
Sui Price Regains Positive Momentum: Will It Sustain?
At press time, Sui is trading at $3.55, marking a significant increase of 7.9% over the last seven days. However, over the last week and month, the token has seen massive declines of 4.3% and 24.3%, respectively.
Celebrating SUI’s current positive track, traders are actively engaging in market activity. The token’s 24-hour trading has seen a notable uptick of 15.44%, reaching $1.03 billion. Furthermore, SUI has achieved a milestone of over 8.5 billion total transactions, marking a notable 10.37% increase over the past 30 days. With a market cap of $10.67 billion, Sui has secured 12th spot on CoinMarketCap.
Although analysts see a massive surge ahead, it needs to be seen if SUI will sustain the current momentum and gain new highs.
Nynu V Jamal
Nynu V Jamal is a passionate crypto journalist with three years of experience in blockchain, web3, and fintech spheres. She has established herself as a knowledgeable and engaging voice in the cryptocurrency and blockchain space. Her experience as an Assistant Professor in English Language and Literature has further added to her quest for crafting informative, well-researched, and accessible content.
Disclaimer: The presented content may include the personal opinion of the author and is subject to market condition. Do your market research before investing in cryptocurrencies. The author or the publication does not hold any responsibility for your personal financial loss.


As the XRP price approaches key support levels, crypto analysts Casitrades forecast that the cryptocurrency is on the verge of a breakout. A potential surge in price could see XRP targeting levels as high as $6, with the conclusion of Wave 2 of its Elliott Wave pattern signalling a shift toward bullish momentum.
This technical analysis points to a possible market rally, especially if the XRP price maintains support above $1.90 or $1.55.
XRP’s Price Trend Points To Rally To $6
Currently, XRP’s price remains near the $2.08 level, consolidating between crucial support and resistance zones. According to Elliott Wave theory, XRP price appears to be finishing Wave 2, a corrective phase, with a possible reversal that could trigger a move higher. Crypto analysts Casitrade has spotted the $1.90 and $1.55 levels, where XRP has shown solid support in recent weeks.
For a sustained breakout, XRP needs to break and hold above the $2.24 resistance. This level is critical as it represents the 0.382 Fibonacci retracement. If XRP price can clear and hold above this price, analysts expect a sharp move toward the $6 target, $9.50 and $12, which aligns with the 1.618 Fibonacci extension.

A strong push above $2.24 would likely validate the breakout, allowing XRP to build on the current bullish momentum. Conversely, if the price struggles at this level and fails to maintain support, XRP could experience a brief pullback before making another attempt at higher targets.
Technical Indicators Point to Bullish Momentum
Early buy signals in the technical factors of XRP are pointing towards a bullish direction. The MACD histogram is green and the MACD line has recently crossed above the signal line, thus indicating a higher tendency for buying pressure. Concurrently, the Relative Strength Index (RSI) is still middle of the range, and that certainly provides some more room for price appreciation, if buying pressure persists.
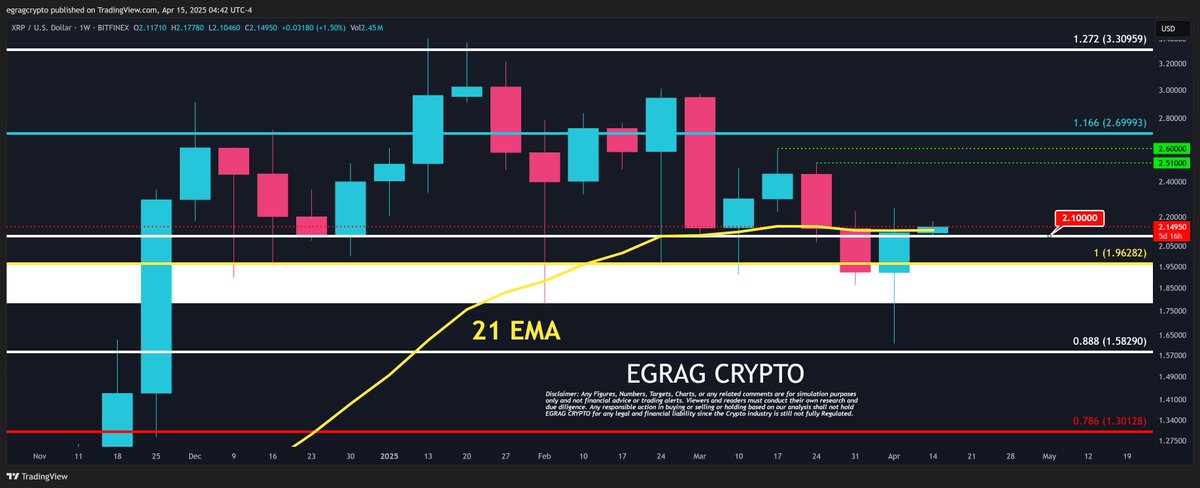
Besides these, if XRP price is able to sustain above the $2.25 on the weekly chart, this will indicate a low at the $2.09 mark. According to analyst EGRAG CRYPTO, a full-bodied weekly candle above this price would confirm a bullish reversal, allowing XRP to target higher price zones such as $2.51 and $2.60.
However, short-term volatility has remained a concern despite such signals. Currently, there has been a remarkable increase in exchange inflows, with more than 55 million XRP moved to exchanges, which could put pressure on the sell-side in the market. However, analysts foresee a more positive, longer-term outlook for XRP due to the possibility of a Ripple ETF.
XRP ETF Approval Could Fuel Price Surge
Investor sentiment surrounding XRP is also being fueled by the growing excitement about a potential Ripple ETF. According to reports, analysts at JPMorgan are predicting that the approval of a Ripple spot ETF could bring in over $8 billion in institutional investments. This could trigger a surge in the price of XRP, potentially pushing it well above $6.
The approval of an XRP ETF is seen as a key development for the cryptocurrency, with analysts such as Zach Realtor suggesting that it could send the price toward $15. Such a move would also bring XRP closer to a $1.8 trillion market cap, making it one of the most valuable assets in the crypto space. The approval process for Ripple’s ETF is expected to unfold in the coming months, with the SEC set to make a decision on Grayscale’s XRP spot ETF filing by May 22.
In the meantime, Teucrium’s recently launched leveraged XRP ETF has already gained significant traction, attracting $27 million in assets. This growing interest in XRP-based products further strengthens the case for a potential ETF approval, which could provide the necessary catalyst for a significant price rally.
Kelvin Munene Murithi
Kelvin is a distinguished writer with expertise in crypto and finance, holding a Bachelor’s degree in Actuarial Science. Known for his incisive analysis and insightful content, he possesses a strong command of English and excels in conducting thorough research and delivering timely cryptocurrency market updates.
Disclaimer: The presented content may include the personal opinion of the author and is subject to market condition. Do your market research before investing in cryptocurrencies. The author or the publication does not hold any responsibility for your personal financial loss.

Tron founder Justin Sun is showing off diamond hands as the Ethereum price tries to stage a resurgence. Justin Sun has disclosed his intention not to sell off his ETH holdings while exploring new collaboration opportunities with Ethereum developers.
Tron Founder Is Not Selling ETH Holdings
Justin Sun has confirmed his resolve not to sell off any ETH despite falling prices for the largest altcoin. According to a post on X, the Tron founder disclosed plans to HODL the asset while unveiling plans to trigger a growth spurt.
“ETH is currently at a low price, but we have no intention of selling our ETH holdings,” said Justin Sun.
The Tron Foundation is yet to publicly reveal its ETH holdings, but speculation is rife that the organization holds a sizable amount. However, the Tron founder reportedly holds around 665,000 ETH valued at just under $1 billion at current prices.
Since Ethereum began its decline, the value of Justin Sun’s ETH holdings have plummeted from its highs of around $2.5 billion. Despite the price drop, the Tron founder is remaining firm in his resolve not to offload his ETH bags.
However, Ethereum whales are creating sell pressure for ETH by offloading their coins at a loss, sparking fears of a dip below $1,500.
Collaborating With Developers To Improve Ethereum Price
Alongside his declaration to HODL ETH, Sun revealed plans to double down on the Ethereum network. Going forward, Sun notes that Tron will explore increased collaboration with Ethereum via initiatives with developers and other critical stakeholders.
“Tron will continue to seek opportunities to collaborate with more Ethereum developers and build our industry together,” adds Justin Sun.
His comments come on the heels of a raft of community suggestions designed to improve Ethereum price performance. While the Tron founder did not give further details, the planned collaboration is expected to trigger a flurry of ecosystem activity.
This is not the first time Justin Sun is backing Ethereum with the Tron founder previously unveiling strategy to push ETH price to $10K. Sun’s plans revolved around stopping the Ethereum Foundation from making ETH sales for three years and taxing L2 protocols.
At press time, Ethereum price currently trades at $1,581 after falling by 46% over the last 12 months. There is chatter that Ethereum price has bottomed and bullish US unemployment data can trigger a rally to $2,000. Charts are indicating signals for an uptrend with ETH trading above a resistance trend line, sparking belief for push toward $4,800.
Aliyu Pokima
Aliyu Pokima is a seasoned cryptocurrency and emerging technologies journalist with a knack for covering needle-moving stories in the space. Aliyu delivers breaking news stories, regulatory updates, and insightful analysis with depth and precision. When he’s not poring over charts or following leads, Aliyu enjoys playing the bass guitar, lifting weights and running marathons.
Disclaimer: The presented content may include the personal opinion of the author and is subject to market condition. Do your market research before investing in cryptocurrencies. The author or the publication does not hold any responsibility for your personal financial loss.
A Dogecoin (DOGE) price breakout past its previous All-Time High (ATH) price is gradually becoming possible amid the current market setup. While still tied in a long-drawn consolidation, a potential breakout is ahead for the memecoin, according to predictions from market analysts.
Dogecoin Price and Open Interest Outlook
As of this writing, DOGE’s price has changed hands for $0.1569, which has increased by 3.3% in the past 24 hours. This price trend is a testament to how resilient the DOGE price is, having traded at a low spot value of $0.1532. The memecoin has traded at a very close range during this period.
The current DOGE outlook shows a bullish trend in the futures market as showcased by Open Interest data. Data from Coinglass pegs the total Dogecoin committed to the futures market at 9.87 billion DOGE. This was valued at $1.54 billion and has skyrocketed by more than 5% in 24 hours.
Top crypto exchanges like Binance, OKX, and Bybit saw the highest DOGE open interest record. While the price traded at a relatively close range, the open interest commitment proves that traders with leverage are betting on the asset.
DOGE Price to $5.6?
Optimism trails Dogecoin, despite its spot value now trading down 78.71% from its ATH of $0.7376. Market analyst Dogedog told his more than 58,600 followers on X that the price of DOGE is heading to $5.6.
#Dogecoin heading to $5.60.
Breaking falling wedges. pic.twitter.com/XH7bwI7am4
— dogegod (@_dogegod_) April 17, 2025
While Dogegod did not provide a timeline or much context for his prediction, he highlighted how the memecoin breaks falling wedges. The analyst is not alone in his projection for the coin, as an earlier DOGE price analysis, Ali Martinez, predicted a $0.29 rally for the asset in the near term.
Although this price trend is not unrealistic, the broader market slowdown may serve as a bottleneck. Key performance metrics already tipped the Dogecoin price in line for a short-term breakout. With trading volume up 6% to more than $586 million as of writing, retail interest in the coin has further skyrocketed.
Dogecoin remains the lead among altcoins being considered for an exchange-traded fund (ETF) product. As reported earlier by CoinGape, 21Shares filed for a spot Dogecoin ETF, the latest asset manager to make the move. The belief is that an approval can usher in institutional funds, which can help fuel the coin’s price growth.
Godfrey Benjamin
Benjamin Godfrey is a blockchain enthusiast and journalists who relish writing about the real life applications of blockchain technology and innovations to drive general acceptance and worldwide integration of the emerging technology. His desires to educate people about cryptocurrencies inspires his contributions to renowned blockchain based media and sites. Benjamin Godfrey is a lover of sports and agriculture.
Disclaimer: The presented content may include the personal opinion of the author and is subject to market condition. Do your market research before investing in cryptocurrencies. The author or the publication does not hold any responsibility for your personal financial loss.

Analysts Predict XRP Price to Hit $6 as Wave 2 Correction Nears End

Sui Meme Coins Surge With Rising DEX Volumes
Tron Founder Justin Sun Reveals Plan To HODL Ethereum Despite Price Drop

Top 3 AI Coins To Watch: RENDER, IP, and CLANKER

Ethereum Investors Suffer More Losses Than Bitcoin Amid Ongoing Market Turmoil

Dogecoin Price Breakout in view as Analyst Predicts $5.6 high

2.52 Million Altcoins Are Ruining Crypto’s Future

Animoca Brands Valuation Tanks 75% In Two Years, Here’s Why

Crypto exchange BingX hacked for $43 million

Are The Big Players Losing Interest?

Hong Kong’s Securities Association Tips Authorities On Crypto Self-Regulation

Coinbase cbBTC Set to go Live on Solana
2.52 Million Altcoins Are Ruining Crypto’s Future
Animoca Brands Valuation Tanks 75% In Two Years, Here’s Why
Crypto exchange BingX hacked for $43 million
Are The Big Players Losing Interest?
Hong Kong’s Securities Association Tips Authorities On Crypto Self-Regulation
Coinbase cbBTC Set to go Live on Solana
-

 Market24 hours ago
XRP Dips To $1.97 – A Golden Opportunity Before The Next Rally?
-

 Market23 hours ago
No Rate Cut Soon, Crypto Banking Rules to Ease
-

 Market17 hours ago
Bitcoin Whales Withdraw $280 Million: Bullish Signal?
-

 Market22 hours ago
Ethereum Price Struggles to Rebound—Key Hurdles In The Way
-

 Ethereum21 hours ago
77K Ethereum Moved to Derivatives—Is Another Price Crash Looming?
-

 Market21 hours ago
Bitcoin and Global M2 Money Supply: A Misleading Connection?
-
 Altcoin20 hours ago
Crypto Whales Bag $20M In AAVE & UNI, Are DeFi Tokens Eyeing Price Rally?
-
 Bitcoin17 hours ago
Gary Gensler Explains Why Bitcoin Will Outlast Altcoins

✓ Share: