Altcoin
Over 80% of These Altcoin Holders Are Losing Money

A recent analysis by IntoTheBlock reveals a troubling trend for holders of some notable altcoins.
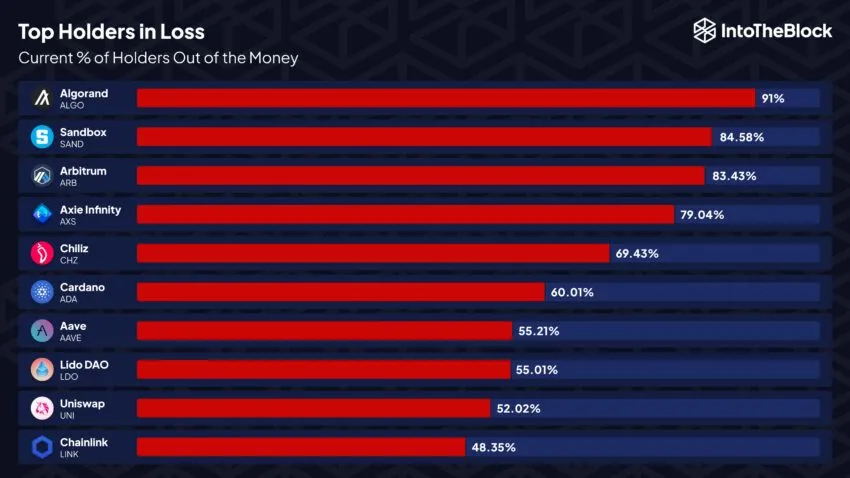
Indeed, over 80% of investors in Algorand (ALGO), Sandbox (SAND), and Arbitrum (ARB) are currently facing losses.
Altcoin Holders Face Significant Losses
IntoTheBlock explained that Algorand is at the forefront of the troubling trend, with a staggering 91% of its holders in the red. However, Marc Vanlerberghe, CMO of the Algorand Foundation, maintains that the network remains one of the best blockchains for solutions that scale and that the future is bright despite ALGO’s price performance.
“Algorand has rock-solid fundamentals. Thanks to its reliability (the network has never been down in 5 years), impressive speed (up to 10,000 transactions per second), and low-transaction fees (.001 ALGO), Algorand’s potential to power solutions across industries such as finance, real estate, social impact and more is immense,” Vanlerberghe told BeInCrypto.
Other altcoins like Sandbox and Arbitrum are not far behind, marking around 80% of their investors with depreciated altcoin portfolios. Moreover, cryptocurrencies such as Axie Infinity (AXS), Chiliz (CHZ), Cardano (ADA), Aave (AAVE), Lido DAO (LDO), Uniswap (UNI), and Chainlink (LINK) also show a high percentage of holders at a loss but to a lesser extent.
The surge in loss-making accounts is attributed to the volatile nature of the crypto market. It has seen significant price fluctuations over the past months.
For investors, the downward trend poses concerns but highlights a crucial aspect of market dynamics — the potential for recovery and gain amidst apparent downtrends. Indeed, despite these daunting figures, IntoTheBlock said there is a silver lining. Assets like Algorand, Sandbox, and Arbitrum offer potential opportunities for savvy investors.
“These assets can present great opportunities, as long as they show strong fundamentals and signs of on-chain activity and growth,” IntoTheBlock explained.
Read more: 11 Cryptos To Add To Your Portfolio Before Altcoin Season
Investors are advised to conduct thorough research and consider the long-term prospects of their investments. Understanding each altcoin’s underlying technology and market trends can be crucial in navigating the ups and downs of the crypto space effectively.
Disclaimer
In adherence to the Trust Project guidelines, BeInCrypto is committed to unbiased, transparent reporting. This news article aims to provide accurate, timely information. However, readers are advised to verify facts independently and consult with a professional before making any decisions based on this content. Please note that our Terms and Conditions, Privacy Policy, and Disclaimers have been updated.
Altcoin
What’s Up With BTC, XRP, ETH?

Crypto Market Highlights: Another week has ended within the unpredictable world of cryptocurrencies, and investors are left cautious due to turbulent price actions. Bitcoin (BTC) price has traded around the same level in the past 7 days, whereas Ethereum (ETH) managed to lose nearly 1% within the exact duration. Ripple’s XRP price continued its consolidation phase this week, adding to speculations about its future price movements.
Mentioned below are some of the most buzz-worthy cryptocurrency market highlights reported by CoinGape Media over the past week.
Crypto Market Highlights: BTC Updates This Week
BTC price shut the week at around the $85K level, riding a roller coaster in the past seven days. The weekly bottom and peak for the flagship crypto were recorded at $83K and $86K, respectively. This turbulent price action comes despite a stockpile of bullish developments that appear to have considerably impacted investor sentiment this week.
CoinGape reported that Michael Saylor’s MicroStrategy again purchased 3,459 Bitcoin for $285 million and rattled the crypto market. The MSTR stock price also surged subsequently.
Further, Semler Scientific filed to buy $500 million worth of Bitcoin amid its $30 million DoJ settlement this week. With this mover, the firm aimed to boost its Bitcoin reserves despite the broader market uncertainty.
Meanwhile, it’s worth pointing out that U.S. President Donald Trump announced up to 245% tariffs on China this week. On the other hand, China was apparently mulling over the sale of 15K BTC, another intriguing development that captured investors’ attention globally.
Besides, BTC whales were recorded as absorbing 300% of the flagship coin’s new supply, sparking optimistic speculations about long-term price prospects.
Ethereum & XRP Developments
ETH is trading around a $1,600 price level, losing roughly 3% in the last 7 days. Despite this waning action, CoinGape has reported that a rally to $4,800 awaits the second-largest crypto by market cap. This bullish ETH price projection comes as the coin is trading on the north side of a key resistance trend.
However, it’s also worth pointing out that Ethereum faced increased selling pressure due to heightened whale dumps this week. In response to this, market participants are conversely anticipating a potential dip below $1.5 may also be possible.
Besides, Ethereum ETFs recorded $32 million worth of weekly outflows this week, adding further risk to the asset’s price.
In addition, Ethereum fees have also witnessed a severe price decline as user activity decreased amid the recent market turmoil.
XRP price stood at the $2.08 price level after witnessing a highly volatile trading session over the past week. Despite soaring ETF odds, the crypto has yet to see a rising price action. Notably, 9 XRP ETFs have been filed to date, including Bitwise, 21Shares, Grayscale, and Canary Capital.
On the other hand, Ripple whales have also moved hundreds of millions of dollars worth funds this week.
The XRP lawsuit advanced as the U.S Court of Appeals granted Ripple and the SEC’s motion to suspend their appeals while they finalized the settlement. Overall, the abovementioned updates were some of the top crypto market highlights reported by CoinGape Media over the past week.
Disclaimer: The presented content may include the personal opinion of the author and is subject to market condition. Do your market research before investing in cryptocurrencies. The author or the publication does not hold any responsibility for your personal financial loss.
Altcoin
Uniswap Founder Urges Ethereum To Pursue Layer 2 Scaling To Compete With Solana

As Solana continues its ascent, experts are not writing off Ethereum’s chances to compete favorably in decentralized finance (DeFi). Uniswap founder Hayden Adams wants Ethereum to hone in on Layer 2 scaling to even the odds with Solana.
Uniswap Founder Wants Ethereum To Continue Horizontal Scaling
The calls for Ethereum to focus on Layer 2 scaling are growing louder, with Uniswap founder Hayden Adams joining the train. The Uniswap founder disclosed his stance in an X post, calling for Ethereum to continue its Layer 2 scaling development.
Adams notes that Layer 2 solutions remain Ethereum’s best chance to keep its skin in the DeFi game amid rising competition from Solana. He notes that Solana is better suited to do DeFi on its layer 1, given its roadmap and overall approach compared to Ethereum.
Ethereum, aware of the challenges of its Layer 1, has pivoted to an L2-focused roadmap since 2020. However, a broad ecosystem focus for Layer 2 scaling solutions has left the base layer without major updates for a while, whipping up conversations for a change in approach.
Despite the push for a return to a Layer 1-focused approach, the Uniswap founder wants Ethereum to continue on its existing roadmap. He took swipes at community members pushing for a change in strategy every month, urging them to “pick a lane” and mitigate the attendant risks.
“Ethereum has been working towards an L2-centric/horizontal scaling roadmap for 5+ years,” said Adams. “You want to throw this away at the final stretch because of what reason?”
Ethereum and Solana are going neck and neck with each other with a Coingape analysis weighing whether ETH price will hit $3 before SOL clinches $200.
A Layer 1-centric Approach Is Still Acceptable
The Uniswap founder disclosed in the post that he remains open to the possibility of a pivot to a Layer 1-centric approach. However, the approach has to be explicit and realistic, with Adams recommending key network changes.
“I’m fine with L1-centric scaling approach if it’s explicit and approached realistically,” said the Uniswap founder. “We would have to drop a ton of philosophical stuff like any laptop can run a node.”
He adds that Uniswap’s largest market share comes from Layer 1, making a pivot still a win for his project. However, the approach inflames centralization risks affecting the ability of individuals to run full nodes.
Amid the raging conversations for scaling direction, Ethereum is facing its worst quarterly price performance in nearly a decade. ETH targets a $1600 breakout as prices continue to wallow under $2,000 since slipping below the psychological level.
Tron founder Justin Sun says he is not selling his ETH holdings despite falling prices, pledging to collaborate with Ethereum developers to trigger ecosystem growth.
Disclaimer: The presented content may include the personal opinion of the author and is subject to market condition. Do your market research before investing in cryptocurrencies. The author or the publication does not hold any responsibility for your personal financial loss.
Altcoin
Expert Reveals Why Consensus 2025 Will Be Pivotal For Pi Network

As Consensus 2025 inches closer, a buzz is swelling in the Pi Network ecosystem over potential growth opportunities. Ahead of the event, a cryptocurrency analyst wants the Pi Core Team (PCT) to wrap up two critical matters to reap the rewards of Consensus 2025.
Consensus 2025 Offers A Huge Opportunity For Pi Network
Cryptocurrency expert Dr Altcoin has described the incoming Consensus 2025 as a pivotal moment for the Pi Network. According to an X post, Dr Altcoin noted that the event will provide a raft of promotional benefits for Pi Network, urging the PCT to seize the moment.
“Consensus 2025 Summit is a huge opportunity to promote Pi Network – and one of the best so far!” wrote Dr Altcoin.
Pi Network founder Nicolas Kokkalis joins an exclusive list of industry players tapped to speak at the premier cryptocurrency summit. Kokkalis’ inclusion sent ripples across the Pi ecosystem with community members lapping up the reports.
The event, described as “the Super Bowl of Blockchain” and the “World Cup of Web 3,” will have over 20,000 individuals in attendance from over 100 countries. Scheduled for May 14-16 in Toronto, the Summit will feature industry heavyweights with a combined assets under management exceeding $4 trillion.
Kokkalis will share the stage with Bo Hines and Eric Trump in a golden opportunity to promote the Pi Network. Kokkalis has previously come under criticism for failing to make public appearances, unlike other blockchain founders.
Details of Kokkalis’ speech are under wraps, but there is growing belief that it will revolve around decentralized growth and the network’s adoption strategy. Pi Network has unveiled further details around its tokenomics, earmarking 65 billion Pi for community mining rewards.
Dr Altcoin Urges PCT To Put Its House In Order Ahead Of The Summit
While Consensus 2025 is poised to offer Pi a raft of benefits, Dr Altcoin notes that the Pi Core Team has to tick a few boxes. For starters, Dr Altcoin is pushing for the PCT to approve all KYB applications ahead of Consensus 2025.
Secondly, the cryptocurrency expert wants the PCT to officially deploy decentralized applications (DApps) on the Pi Network.
The PCT has less than a month to approve the KYB applications and give the green light for DApps. Pi Network has received criticism for the slow pace of processing KYB applications, leading to PiDaoSwap launching NFTs on BNB Chain.
Pi is trading at $0.6477 with Pi Coin tapped to reach highs of $30 if major banks adopt Pi Network. However, investors are bracing themselves for short-term volatility after suspicious account activity on Banxa.
Disclaimer: The presented content may include the personal opinion of the author and is subject to market condition. Do your market research before investing in cryptocurrencies. The author or the publication does not hold any responsibility for your personal financial loss.
-

 Market19 hours ago
Cardano (ADA) Moves Sideways, But Bullish Shift May Be Brewing
-
 Altcoin15 hours ago
Analyst Reveals Dogecoin Price Can Reach New ATH In 55 Days If This Happens
-
 Market22 hours ago
XRP Consolidation About To Reach A Bottom, Wave 5 Says $5.85 Is Coming
-

 Altcoin18 hours ago
Pi Coin Price Soars As Pi Network Reveals Massive Community Reward Plans.
-
 Altcoin24 hours ago
Chainlink Price To Hit $26 If LINK Breaks Past This Crucial Level
-
 Market21 hours ago
Canary Capital Aims to Launch TRON-Focused ETF
-

 Altcoin10 hours ago
Cardano Bulls Secure Most Important Signal To Drive Price Rally
-

 Market15 hours ago
Binance Mandates KYC Re-Verification For India Users







✓ Share: