
Altcoin
Here’s How Pi Coin May Retain The $1 Mark
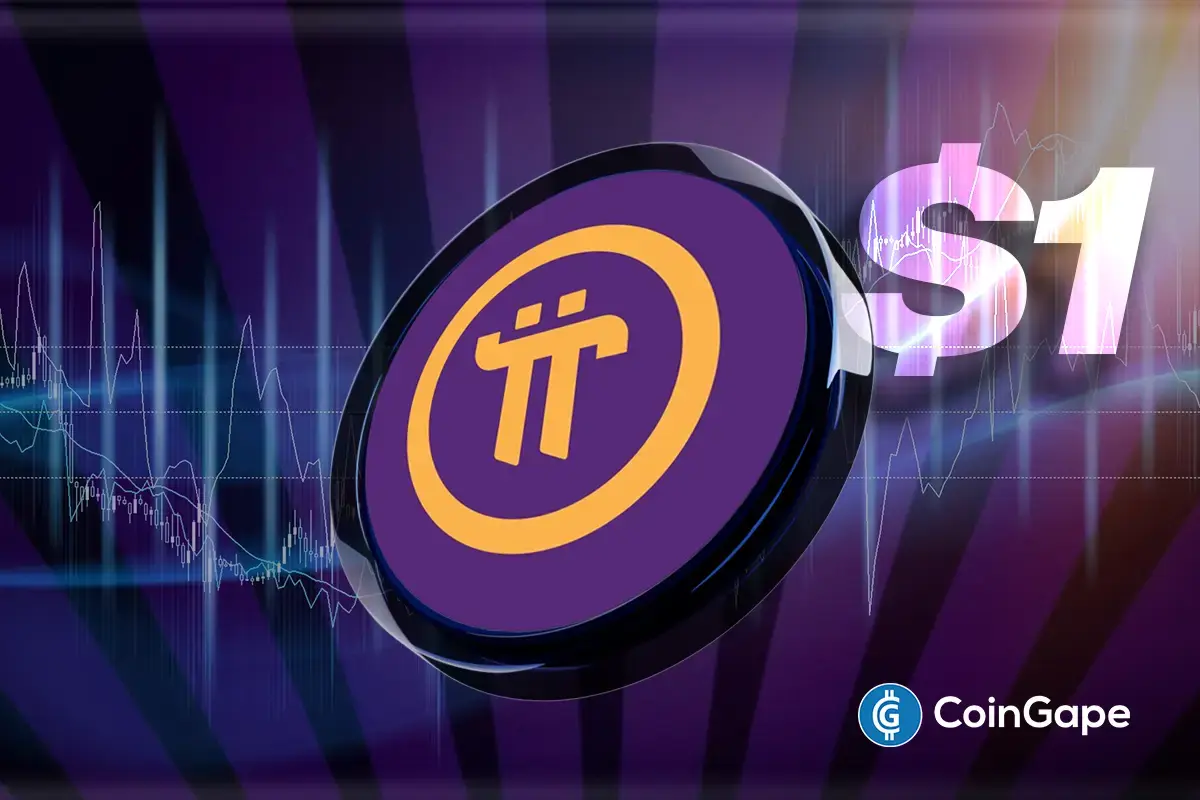
Pi Network price has continued to stay in the red, losing more than 6% during writing. With the crypto losing the brief $1 support, speculations are high among market watchers over the future performance of the asset. Amid this, a renowned expert has how Pi Coin might retain the $1 support.
Pi Network Price Slips Below $1
Pi price today has traded at $0.9432, down 6.3% from yesterday and its one-day volume rose 12% to $284.36 million. Notably, the crypto has managed to soar past the $1 mark today in the last 24 hours, while dropping to a low of $0.9109. Besides, a Pi price prediction indicates that the crypto might slip to $0.71 in April.
Notably, it appears that the recent decline comes due to a lack of any positive catalysts in the market. For context, the leading crypto exchange Binance hasn’t confirmed the listing on its platform, which has dampened the investors’ confidence. On the other hand, the lack of any major announcement from the Pi Core team has further weighed on the sentiment.
What’s Next For The Crypto?
According to Pi Coin enthusiast Dr Altcoin on X, the recent influx of unlocked Pi coins on centralized exchanges (CEXs) has led to a surge in circulating supply. To counter this, the Pi Team may need to burn an additional 60-100 million coins in the coming days. This move, which Dr Altcoin believes, could help drive Pi Network price back to the $1 mark.
While investors remain cautious, Dr. Altcoin’s prediction offers a glimmer of hope for Pi Coin’s future. However, with the upcoming token unlocks and other factors, he urged investors to exercise due diligence before putting their bets into the asset.
Pi Network Unlock Looms: Here’s All
With the upcoming token unlocks, market watchers are speculating over the future trajectory of the Pi Coin. For instance, a total of 97.65 million Pi, worth around $93 million at the current price, will be unlocked over the next 30 days. The average unlock stands at 3.25 million tokens a day and the highest unlock will be around 6.8 million Pi coin on April 3.
On the other hand, PiScan data showed that 115.57 million tokens will be unlocked in April, followed by 182 million and 222 million in May and June, respectively. Having said that, these massive unlocks might continue to add pressure on the token’s future performance. But, as Dr Altcoin suggested, if the Pi Core Team decides to conduct the token burns, it could help offset the pressure on the Pi Network price.
Rupam Roy
Rupam is a seasoned professional with three years of experience in the financial market, where he has developed a reputation as a meticulous research analyst and insightful journalist. He thrives on exploring the dynamic nuances of the financial landscape. Currently serving as a sub-editor at Coingape, Rupam’s expertise extends beyond conventional boundaries. His role involves breaking stories, analyzing AI-related developments, providing real-time updates on the crypto market, and presenting insightful economic news.
Rupam’s career is characterized by a deep passion for unraveling the complexities of finance and delivering impactful stories that resonate with a diverse audience.
Disclaimer: The presented content may include the personal opinion of the author and is subject to market condition. Do your market research before investing in cryptocurrencies. The author or the publication does not hold any responsibility for your personal financial loss.


Based on historical data, July could be the next bullish month for the XRP price, which continues to consolidate amid this crypto market downtrend. Despite the market downturn, crypto analysts like CasiTrades are confident that the altcoin could still reach a new all-time high (ATH) in this market cycle.
Historical Data Points To July Being The Next Bullish Month For The XRP Price
Cryptorank data shows that July could be the next bullish month for the XRP price. This is based on the fact that the altcoin has recorded significant gains in each of the last five Julys.
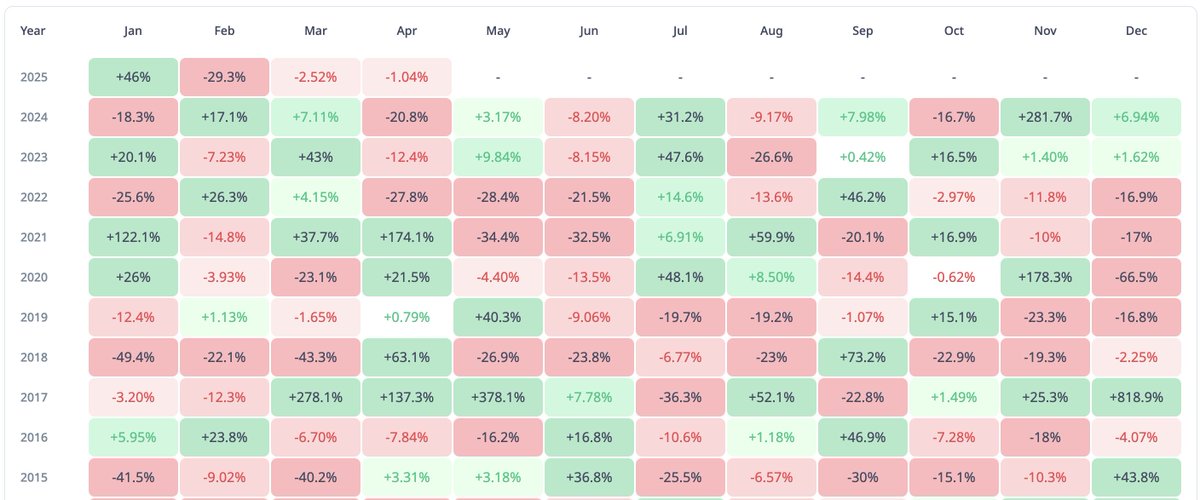
Unlike July, April to June have been mixed for XRP over the last five years. For April, the last three out of five months have been bearish for the altcoin, although it recorded a 174% gain in April 2021.
For May, three out of the last five months have been bearish for the XRP price, although it recorded meagre gains in May 2023 and 2024. Meanwhile, June has been completely bearish for the altcoin, as it recorded monthly losses in the last five months.
It is worth mentioning that four out of the five monthly gains for XRP in July have been double-digit gains. As such, Ripple’s native crypto could again record double-digit gains this coming July.
Interestingly, crypto analyst Egrag Crypto predicted that XRP could reach double digits by its July 21 cycle peak. He alluded to the altcoin’s previous bull runs as to why July could mark this cycle’s peak. The analyst believes the Ripple price could reach $27 by then.
Analysts Argue XRP’s Consolidation Could End Soon
Amid this historical data, crypto analysts Dark Defender and CasiTrades have suggested that the XRP price consolidation could end soon. In an X post, Dark Defender stated that the altcoin’s consolidation is nearing an end and that he believes this is the final consolidation of the monthly structure.
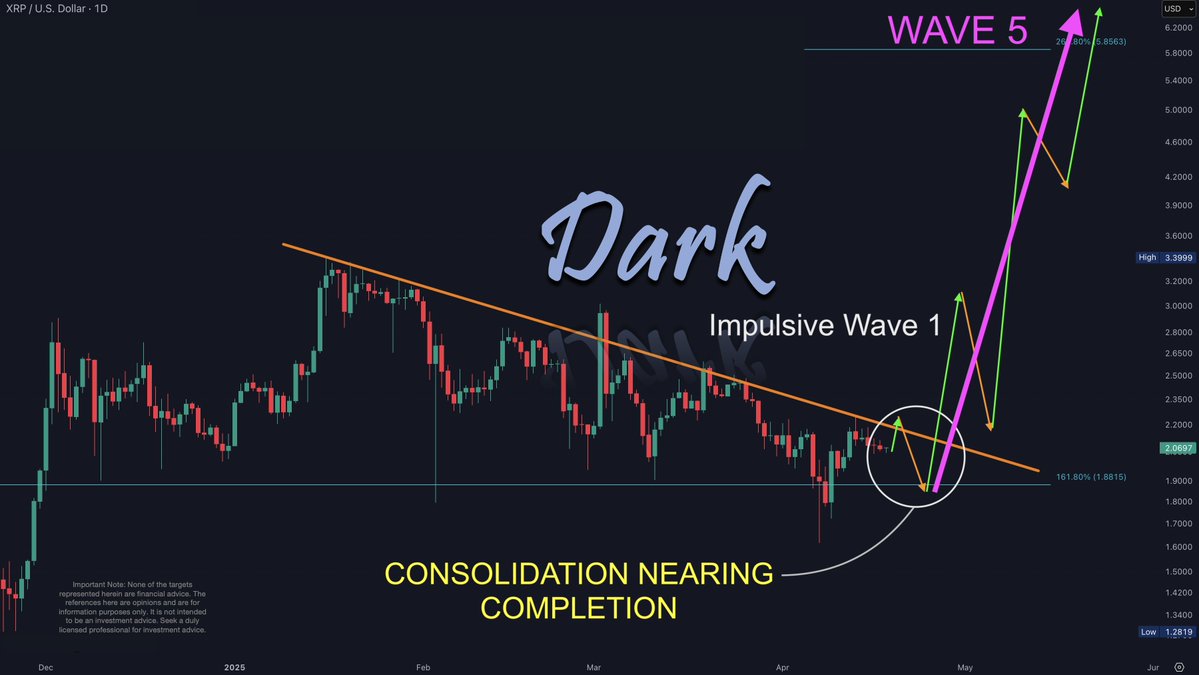
Once this consolidation is done, the crypto analyst remarked that market participants can expect the Wave 5, which will send Ripple’s native crypto to new highs. He highlighted $2.22 and $2.30 as the major resistances to watch out for, while $1.88 and $1.63 are the major support levels. Meanwhile, the targets on this Wave 5 up are $3.75 and $5.85, which will mark a new ATH for the altcoin.
As CoinGape reported, crypto analyst CasiTrades also predicted that the XRP price could soon reach $6 as Wave 2 correction nears its end. The analyst also raised the possibility of the altcoin rallying to as high as $9.50 and $12 if it reaches the 2.618 and 3.618 Fibonacci extension levels, respectively.
However, there is still the possibility of the XRP price dropping below the $2 level before it rallies to new highs. Egrag Crypto warned that Ripple’s native crypto could still drop to as low as $1.4 in the event of a major liquidation.
Boluwatife Adeyemi
Boluwatife Adeyemi is a well-experienced crypto news writer and editor who has covered topics that cut across several topics and niches. Boluwatife has a knack for simplifying the most technical concepts and making it easy for crypto newbies to understand. Away from writing, He is an avid basketball lover, a traveler and a part-time degen.
Disclaimer: The presented content may include the personal opinion of the author and is subject to market condition. Do your market research before investing in cryptocurrencies. The author or the publication does not hold any responsibility for your personal financial loss.

The ETH price’s bearish sentiment since January 2025 has taken a toll on investor confidence, with Ethereum ETFs witnessing significant outflows. As ETH’s value continues to plummet, investors increasingly withdraw their funds. With Ethereum exchange-traded funds recording a massive $32 million in weekly outflows, analysts caution against a potential downtrend.
As Ethereum lingers below the $2,000 mark for weeks, market experts and traders are bracing for a potential further decline to $1,100. Let’s dive deeper into the reasons behind the significant outflows from Ethereum ETFs and its potential impact on ETH price.
Ethereum ETFs Record $32M Weekly Outflows: What’s Happening?
According to SoSoValue, Ethereum ETFs experienced increasing outflows over the past week, driven by the overarching negative market trend. Last week, the ETFs saw a total net outflow of $32.17 million, pushing the month’s outflows to $170.99 million.
In addition, the Ethereum exchange-traded funds experienced an unusual day of neutral flows yesterday, with neither net inflows nor outflows reported. Analyst Ali Martinez shed light on the increasing whale activity over the past week. According to his X post, ETH whales have offloaded 143,000 tokens last week.
Significantly, this negative sentiment could be attributed to the ETH price’s bearish trend which began in January. Ethereum, which stood high-headed above $3,500 at the onset of 2025, started plummeting to reach a severe low of $1,500 in April. This steady downtrend has caused a stir in the market, with traders showing less interest towards the altcoin.
Is ETH Price Poised for a Crash?
Growing pessimism surrounding Ethereum ETFs has led analysts to warn the community that ETH’s price may extend its downward trajectory. For instance, analyst Altcoin Gordon shared a bearish forecast for ETH price, predicting that the token would further drop to $1,100. However, as per CoinGape’s Ethereum price prediction, ETH could destabilize around a minimum of $1,588 in 2025.
Ethereum market share nears all-time lows as bearish chart signals potential $ETH price drop to $1,100 👀 pic.twitter.com/NKr45vB4V5
— Gordon (@AltcoinGordon) April 15, 2025
As of press time, ETH is valued at $1,592, down by a marginal 0.20% in a day. Despite a 2.3% surge over the past seven days, ETH has seen a massive dip of 21% in a month. This negative vibe is also reflected on the traders’ sentiment, with the 24-hour trading volume decreasing by 23% to reach $10.5 billion.
Significantly, the Ethereum transaction fees’ recent crash to a five-year low has also contributed to the overall bearish sentiment.
Ethereum Bulls Remain Optimistic
Despite these bearish predictions and negative Ethereum ETF trend, bulls remain optimistic about the ETH price. Analysts like Crypto Rover and CryptoGoos shared their bullish outlooks on Ethereum, invoking investors’ enthusiasm.

According to CryptoGoos, ETH is expected to repeat history to surge beyond $2,800 in the near future. Meanwhile, market expert Crypto Rover projected the ETH price’s potential journey to an ambitious $10,000. However, it needs to be seen whether ETH can break through its current resistance levels and achieve these lofty targets.
Nynu V Jamal
Nynu V Jamal is a passionate crypto journalist with three years of experience in blockchain, web3, and fintech spheres. She has established herself as a knowledgeable and engaging voice in the cryptocurrency and blockchain space. Her experience as an Assistant Professor in English Language and Literature has further added to her quest for crafting informative, well-researched, and accessible content.
Disclaimer: The presented content may include the personal opinion of the author and is subject to market condition. Do your market research before investing in cryptocurrencies. The author or the publication does not hold any responsibility for your personal financial loss.

Ripple CEO Brad Garlinghouse has been instrumental in shaping the narrative and future of XRP. According to All Things XRP, Garlinghouse is steering XRP towards a monumental breakthrough, driven by its unparalleled potential to revolutionize global payments. The CEO’s vision for Ripple’s token is centered on real-world utility, scalability, efficiency, and other unique capabilities – positioning it for unprecedented growth and adoption.
In a series of X posts, the expert referred to Brad Garlinghouse’s influential statements on XRP. Acknowledging his powerful words, the expert highlighted their significant impact on the token’s establishment as a top contender in the crypto space.
How Ripple CEO Aids XRP’s Growth? Expert Insights
According to All Things XRP, Ripple CEO Brad Garlinghouse is spearheading XRP’s increased adoption and expansion. Garlinghouse’s multiple posts and comments on the crypto’s potential have significantly influenced its global recognition.
Let’s explore Brad Garlinghouse’s words that boosted Ripple coin’s growth over the past few years, despite the prolonged Ripple vs SEC lawsuit and other regulatory hurdles.
Garlinghouse Acknowledges Ripple Coin’s Use Cases
Notably, the Ripple CEO highlighted XRP’s use cases in global payments. He also underscored the token’s potential to solve a multi-trillion-dollar problem.
According to Garlinghouse, the Ripple coin’s purpose-built design enables fast, efficient, and low-cost transactions, making it an attractive solution for high-volume payment corridors. Its speed, efficiency, and low cost position the Ripple token as a leading contender in the digital asset space. He cited, “If we continue to drive the success we’re driving, we’re driving a massive demand for XRP because we’re solving a multi-trillion dollar problem.”
What is XRP’s Advantage?
Interestingly, XRP remains unique in the vast crypto space with its key features. Being 1000 times faster and less expensive than the pioneering cryptocurrency Bitcoin, the token solidifies its position as a key player in the crypto market. This makes it an ideal solution for high-volume payment corridors. The Ripple CEO stated,
XRP was built by engineers who saw Bitcoin’s flaws, especially scalability. XRP is 1,000 times faster.
In addition, the crypto is decentralized, functional, and independent. This means that the token’s existence and performance are not dependent on Ripple. “If Ripple as a company went away, XRP would continue to trade,” noted Brad Garlinghouse.
Furthermore, the Ripple token has achieved regulatory clarity, with global regulators recognizing it as not being a security. It is noteworthy that Ripple’s coin is one of the first cryptocurrencies to be concluded as a non-security. This provides a clear path forward for its growth and adoption.
Brad Garlinghouse Remains Transparent
As pointed out by the expert, Garlinghouse remains transparent about Ripple’s business model. It relies on selling XRP to generate revenue and achieve profitability. Garlinghouse admitted, “We would not be profitable or cash flow positive without selling our XRP holdings.”
Garlinghouse has also predicted that Ripple’s token will be included in the US crypto reserve.
XRP’s Future Prospects and CEO’s Personal Stance
Significantly, the Ripple CEO remains optimistic about XRP’s future and ETF launch. While all the nine Ripple ETFs have gained the SEC’s recognition, experts believe that they will be approved before December 2025. According to him, “It’s just inevitable that [XRP] will be offered through an exchange-traded fund.”
Further, he emphasized the role of Ripple’s token in the multichain world, while also advocating for fairness across chains. He has also revealed his personal crypto holdings that include XRP, BTC, and ETH.
Nynu V Jamal
Nynu V Jamal is a passionate crypto journalist with three years of experience in blockchain, web3, and fintech spheres. She has established herself as a knowledgeable and engaging voice in the cryptocurrency and blockchain space. Her experience as an Assistant Professor in English Language and Literature has further added to her quest for crafting informative, well-researched, and accessible content.
Disclaimer: The presented content may include the personal opinion of the author and is subject to market condition. Do your market research before investing in cryptocurrencies. The author or the publication does not hold any responsibility for your personal financial loss.

BONK Symmetrical Triangle Squeeze: Is A Mega Breakout Imminent?
XRP Price History Signals July As The Next Bullish Month
BANK Token Surges 150% After Binance Futures Listing

Asia’s First XRP Investment Fund is Here, Backed by Ripple

What Does This Mean for Altcoins?
How $31 Trillion in US Bonds Could Impact Crypto Markets in 2025

2.52 Million Altcoins Are Ruining Crypto’s Future

Animoca Brands Valuation Tanks 75% In Two Years, Here’s Why

Crypto exchange BingX hacked for $43 million

Are The Big Players Losing Interest?

Hong Kong’s Securities Association Tips Authorities On Crypto Self-Regulation

Coinbase cbBTC Set to go Live on Solana
2.52 Million Altcoins Are Ruining Crypto’s Future
Animoca Brands Valuation Tanks 75% In Two Years, Here’s Why
Crypto exchange BingX hacked for $43 million
Are The Big Players Losing Interest?
Hong Kong’s Securities Association Tips Authorities On Crypto Self-Regulation
Coinbase cbBTC Set to go Live on Solana
-
 Altcoin20 hours ago
Dogecoin Price Breakout in view as Analyst Predicts $5.6 high
-

 Ethereum19 hours ago
Ethereum Investors Suffer More Losses Than Bitcoin Amid Ongoing Market Turmoil
-
 Altcoin19 hours ago
Tron Founder Justin Sun Reveals Plan To HODL Ethereum Despite Price Drop
-

 Ethereum23 hours ago
Ethereum Whales Offload 143,000 ETH In One Week – More Selling Ahead?
-

 Market16 hours ago
Ethereum Price Fights for Momentum—Traders Watch Key Resistance
-

 Market22 hours ago
Crypto Ignores ECB Rate Cuts, Highlighting EU’s Fading Influence
-
 Altcoin16 hours ago
Expert Predicts Pi Network Price Volatility After Shady Activity On Banxa
-

 Market21 hours ago
Binance Leads One-Third of the CEX Market in Q1 2025
✓ Share: