
Altcoin
ETH Supply Surge Casts Shadow on Spot Ethereum ETF Excitement

We are just three days away from the approval of the spot Ethereum ETF, and the excitement among investors is pretty high. However, rapidly increasing ETH supply over the past two months is one of the major concerns going ahead.
ETH Supply Increasing by 60K Per Month
Popular market analyst Benjamin Cowen stated that the Ethereum supply has been increasing by 60K per month since April. He added that if this continues to happen until December this year, the ETH supply in circulation will be similar to that before the Merge event back in September 2022.
Over the last 30 days, the supply of ETH is up by almost 60,000 ETH. pic.twitter.com/3XuFUjZDPC
— Benjamin Cowen (@intocryptoverse) July 19, 2024
In the last three months, the Ethereum supply has surged by 150,000. “Currently, since the merge the supply is -298,000. But that will only take 5 months to revert at this pace,” said Cowen.
Cowen added that the major driver for the Ethereum price surge moving ahead would be nothing but the monetary policy. Unless and until the Fed pivots and moves to quantitative easing, Cowen doesn’t expect a major surge in Ethereum going ahead.
According to Cowen’s analysis, the ETH/BTC trading pair experienced a false breakdown below its lows in Q2 2016, followed by genuine capitulation in Q4 of the BTC halving year. If the current pattern mirrors 2016, Cowen suggests that the final capitulation for ETH/BTC may not commence until September 2024. This timeline would allow sufficient time for the initial excitement surrounding the spot ETF, relative to BTC, to diminish.
“If you follow monetary policy, last cycle ETH/BTC broke support the same month that the Fed cut rates,” said Cowen. Well, reports suggest that the Fed Rate cuts could commence sometime around September this year.
Also read: Fed To Mirror ECB Rate Pause? Here’s What It Means For Bitcoin
Citing historical charts, Cowen explains that the ETH/BTC pair wicked down to the lows in August, while making a substantial rally the next month in September. He believes that a similar pattern could repeat this time as well.

Will spot Ethereum ETF Absorb the Supply?
With the spot Ethereum ETF hitting the market next week, investors are excited about strong inflows that could follow. Issuers like BlackRock, Fidelity, Grayscale, and others announced their fee structure earlier this week.
Many market analysts have been expecting multi-billion dollar inflows coming into Ethereum ETF by the end of 2024. However, this may not happen immediately after the approval. Some analysts also believe that there’s a chance of a sell-the-news kind of event to occur.
Also Read: Is Ethereum ETF Launch “Sell The News” Event Like Bitcoin ETF?
The presented content may include the personal opinion of the author and is subject to market condition. Do your market research before investing in cryptocurrencies. The author or the publication does not hold any responsibility for your personal financial loss.


PancakeSwap, the largest decentralized exchange (DEX) on BNB Chain, has officially announced the implementation of CAKE Tokenomics 3.0. This marks a major shift toward a more sustainable and deflationary ecosystem.
According to the announcement, PancakeSwap will begin rolling out the new tokenomics model on April 23, 2025. The main goals are to curb CAKE inflation, optimize system efficiency, and deliver long-term value to the community. However, the CAKE 3.0 proposal has sparked considerable debate.
What Are the Key Changes in CAKE Tokenomics 3.0?
PancakeSwap has set three primary goals for Tokenomics 3.0: achieve an annual deflation rate of 4%, eliminate complex mechanisms such as veCAKE, and reduce CAKE emissions to improve sustainability.
Here are the specific changes:
- Retirement of CAKE Staking, veCAKE, Gauges Voting, Revenue Sharing, and Farm Boosting: PancakeSwap will discontinue CAKE staking and the veCAKE mechanism, which required users to lock tokens in exchange for voting rights or benefits. All locked CAKE and veCAKE will be unlocked.
- Burn Mechanism to Reduce Circulating Supply: PancakeSwap will burn tokens to reduce supply instead of sharing trading fees with users. The team expects to burn approximately 5.3 million CAKE annually, supporting the deflation target.
- Phased Reduction in CAKE Emissions: Daily CAKE emissions will be reduced from 29,000 to 20,000, and later to 14,500 tokens.
Users will have six months from April 23, 2025, to withdraw their previously locked CAKE.
The Debate Around CAKE 3.0
Several developers and community members believe CAKE Tokenomics 3.0 will benefit the project in the long term.
“At its core, CAKE Tokenomics 3.0 defends true value and protects CAKE holders by strengthening long-term fundamentals—such as aggressively cutting emissions to accelerate deflation and sustainably grow value,” Chef Philip said.
However, not everyone agrees. Cakepie DAO—one of the largest veCAKE holders—voiced strong concerns on X. They criticized the decision to eliminate veCAKE, calling it non-transparent and potentially damaging to projects built around that model.
This reveals a divide in the community over how PancakeSwap is balancing deflation and stakeholder interests.
“Sunsetting veCAKE would be devastating for Cakepie and for every project built on long-term alignment with PancakeSwap. Our entire ecosystem is structured around veCAKE, with millions of CAKE locked for four years as a clear show of commitment. Removing veCAKE would erase that commitment overnight and undermine the trust and efforts of all builders who believed in PancakeSwap’s vision,” Cakepie stated.
In response, PancakeSwap proposed a $1.5 million compensation package in CAKE tokens. They offered this to CKP (Cakepie’s token) holders if Cakepie agreed to allow a 1:1 swap from mCAKE (Cakepie’s CAKE derivative) to CAKE.
However, Cakepie is currently voting on whether to accept the offer.

At the time of reporting, CAKE is trading around $1.97, up 17% since April 8, when PancakeSwap first proposed Tokenomics 3.0.
Additionally, data from DeFiLlama shows that PancakeSwap’s 24-hour trading volume has surpassed $1 billion, overtaking Uniswap.
Meanwhile, a report from BeInCrypto reveals that PancakeSwap controls over 90% of the DEX market share on BNB Chain. This highlights the strong relationship between BNB Chain and PancakeSwap.
Disclaimer
In adherence to the Trust Project guidelines, BeInCrypto is committed to unbiased, transparent reporting. This news article aims to provide accurate, timely information. However, readers are advised to verify facts independently and consult with a professional before making any decisions based on this content. Please note that our Terms and Conditions, Privacy Policy, and Disclaimers have been updated.
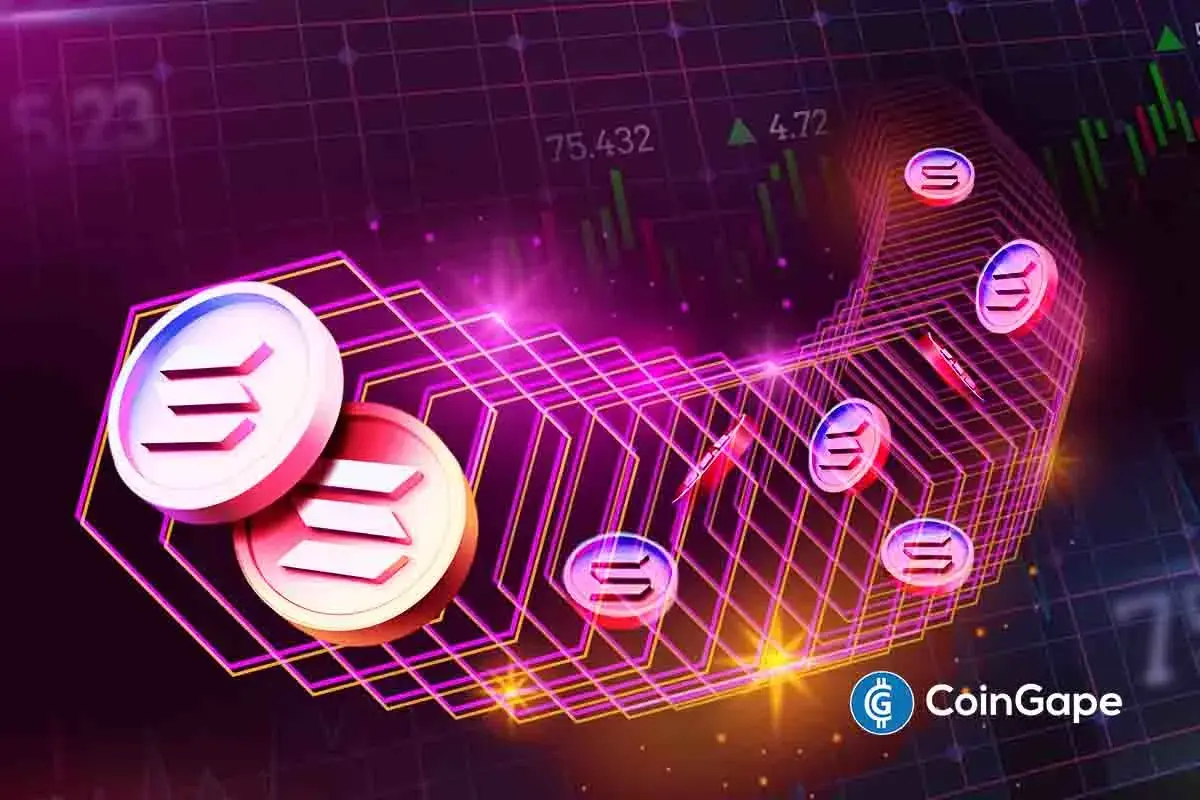
As the crypto market is experiencing a bullish reversal with its total market cap surging by 3.17% to $2.74 trillion, the Solana price is gearing up for a potential rebound. As traders and investors are looking to capitalize on the token’s volatility, analysts unveil key price levels to watch in short term.
Notably, analysts like Ted predict SOL’s potential uptick to $180 amidst increasing whale activity. In this article, we’ll explore the top Solana price levels to watch in the short term which will help you to stay ahead of the curve and capitalize on market opportunities.
Solana Price To Rebound: Key Price Levels Revealed
As the Solana price hovers below $140, analysts and traders are closely watching market movements. While bears fear of a possible crash to $120, analysts like Ted offers a bullish outlook, predicting SOL’s potential surge to $180 by May 2025.
Presenting historical trends, Ted asserts that the Solana price is poised to reach $160-$180. He notes that Solana’s current patterns mirror those seen in 2022 Q4, suggesting potential similarities in future price movements. In addition, the analyst maintains a bullish outlook for the token, predicting a new all-time high for SOL during the third quarter of this year.
Key Price Levels To Watch
While Solana is poised for a potential rebound, traders are recommended to watch key price levels. Analyst Degen Hardy presents a detailed analysis of SOL’s current market conditions where he is trying to identify a long entry opportunity. As per his conclusions, the ideal scenario will be the Solana price to pull back, which, in turn, will form an inverse head and shoulders pattern.
Significantly, the chart presented by the trader represents key levels to watch. As SOL has surged past the significant support level of $125 and the resistance level of $135, the next target is $178.

As of now, SOL is trading at $139.23, up 2.15%.Over the past week and month, Solana has experienced a surge of 3.25% and 6.6%, respectively. Historical data suggests that Solana price could ultimately reach $256 if it surges past $178. The key levels in between $178 and $256 include $199, $216, and $238.
Moreover, increased whale activity also projects a potential rebound in Solana’s price. Whale Alert revealed that a Binance address moved 374,161 SOL ($52,768,341) to an unknown wallet.
SOL Clears Key Resistance: What’s Next
In his recent X post, TraderAG projected Solana price’s potential target of $170 as it has broken past its key resistance level at $135-$137. Though the analyst expected a retest to the $125 level, SOL broke past the resistance zone, sparking speculations of an uptrend.
According to TraderAG, SOL is capable of reaching $170 and beyond in the near term. CoinGape’s Solana price prediction reveals that SOL is expected to reach a maximum level of $173.44 and a minimum of $140.04 in 2025.
Nynu V Jamal
Nynu V Jamal is a passionate crypto journalist with three years of experience in blockchain, web3, and fintech spheres. She has established herself as a knowledgeable and engaging voice in the cryptocurrency and blockchain space. Her experience as an Assistant Professor in English Language and Literature has further added to her quest for crafting informative, well-researched, and accessible content.
Disclaimer: The presented content may include the personal opinion of the author and is subject to market condition. Do your market research before investing in cryptocurrencies. The author or the publication does not hold any responsibility for your personal financial loss.
Cardano price appears to be inching towards a key breakpoint as it continues to consolidate within a symmetrical triangle pattern visible on its price chart. According to cryptocurrency analyst Ali, this formation could help ADA in a major price movement.
Cardano price predicted to surge 27%
In a recent tweet, Ali suggested that Cardano might be in the early stages of breaking out from this consolidation pattern. The symmetrical triangle visible on the price chart shows converging trendlines that have contained ADA’s price movement since early April 2025.
The symmetrical triangle pattern forming on Cardano’s chart is a period of consolidation where buyers and sellers reach a temporary equilibrium. According to technical analysis principles, symmetrical triangles often serve as continuation patterns, with the breakout direction typically following the prior trend.
#Cardano $ADA is still consolidating within a triangle pattern, setting the stage for a potential 27% price move. pic.twitter.com/AWH84U1FnJ
— Ali (@ali_charts) April 21, 2025
In Cardano’s case, the breakout yields the potential 27% price movement mentioned by Ali. The analyst has pointed out that Cardano might be in the early stages of breaking out from this pattern. The analysis by Ali comes as Cardano bulls secure the most important signal to drive a price rally.
Cardano is currently trading at $0.6424 with a 4.3% increase over the past 24 hours. Despite this short-term gain, ADA remains down nearly 10% over the past 30 days.
ADA sentiment remains neutral
Current market sentiment surrounding Cardano is mixed despite the potentially bullish technical setup. According to data from CoinCodex, the overall sentiment toward ADA is currently classified as “Neutral.” However, the Fear & Greed Index shows a reading of 39 and places it in the “Fear” category.
Looking ahead, CoinCodex projects that Cardano’s price could rise by 18.55% to reach $0.765833 by May 21, 2025. While this forecast falls short of the full 27% move suggested by the triangle pattern analysis, it aligns with the general direction and timeframe for a potential upside breakout.
The platform’s analysis of Cardano’s recent performance shows that ADA recorded 14 green days out of the last 30, which is a 47% positive day ratio. Price volatility over this period also stood 7.31%.
Despite the current “Fear” reading and mixed sentiment indicators, CoinCodex concludes that it’s now a good time to buy Cardano based on their technical indicators. However, the next move by ADA could very well be based on the overall market conditions too.
Vignesh Karunanidhi
Vignesh Karunanidhi is a seasoned crypto journalist with nearly 7 years of experience in the cryptocurrency industry. He has contributed to numerous publications, including WatcherGuru, BeInCrypto, Milkroad, and authored over 10,000 articles
Disclaimer: The presented content may include the personal opinion of the author and is subject to market condition. Do your market research before investing in cryptocurrencies. The author or the publication does not hold any responsibility for your personal financial loss.

PancakeSwap Sets Date for CAKE 3.0 Amid Community Concern

How Will it Impact OM Price?

Ethereum Analyst Sets $3,000 Target As Price Action Signals Momentum – Details

Strategy’s 12% YTD Yield and $555M Acquisition

PI Token Price Faces Bearish Pressure, Risking a Drop to $0.40
Top Solana Price Levels to Watch in the Short Term

2.52 Million Altcoins Are Ruining Crypto’s Future

Animoca Brands Valuation Tanks 75% In Two Years, Here’s Why

Crypto exchange BingX hacked for $43 million

Are The Big Players Losing Interest?

Hong Kong’s Securities Association Tips Authorities On Crypto Self-Regulation

Coinbase cbBTC Set to go Live on Solana
2.52 Million Altcoins Are Ruining Crypto’s Future
Animoca Brands Valuation Tanks 75% In Two Years, Here’s Why
Crypto exchange BingX hacked for $43 million
Are The Big Players Losing Interest?
Hong Kong’s Securities Association Tips Authorities On Crypto Self-Regulation
Coinbase cbBTC Set to go Live on Solana
-

 Market24 hours ago
Dogecoin Defies Bullish Bets During Dogeday Celebration
-

 Market22 hours ago
Will XRP Break Support and Drop Below $2?
-
 Bitcoin12 hours ago
US Economic Indicators to Watch & Potential Impact on Bitcoin
-
 Altcoin24 hours ago
Expert Predicts Pi Network To Reach $5 As Whales Move 41M Pi Coins Off Exchanges
-

 Bitcoin21 hours ago
Bitcoin LTH Selling Pressure Hits Yearly Low — Bull Market Ready For Take Off?
-

 Bitcoin18 hours ago
Here Are The Bitcoin Levels To Watch For The Short Term
-

 Market14 hours ago
Bitcoin Price Breakout In Progress—Momentum Builds Above Resistance
-

 Altcoin14 hours ago
Expert Says Solana Price To $2,000 Is Within Reach, Here’s How
✓ Share: