
Altcoin
Cardano, Shiba Inu, Jasmy Grabs Interest Of Big Whales, Trigger Buy Signal

The recent recovery in the crypto market brings some altcoins in the buying range, with whales even starting to accumulate these before prices rally. On-chain data pointed out three altcoins witnessing massive whale activity — Cardano (ADA), Shiba Inu (SHIB), and JasmyCoin (JASMY). Are these three trending cryptocurrencies in an early bullish phase?
ADA, SHIB, JASMY Record Massive Whale Activity
Whale interest in Cardano (ADA), Shiba Inu (SHIB), and JasmyCoin (JASMY) has surged in the last few days, reported on-chain data platform Santiment on June 6. This indicates whales have returned to accumulate these coins after a lull.
The amount of $100K+ transactions on Cardano, Shiba Inu, and JasmyCoin networks have more than doubled this week as compared to the 2024 averages, signaling sudden massive accumulation by whales. Massive accumulation by whales is considered a buy signal as whales tend to buy low and sell high.
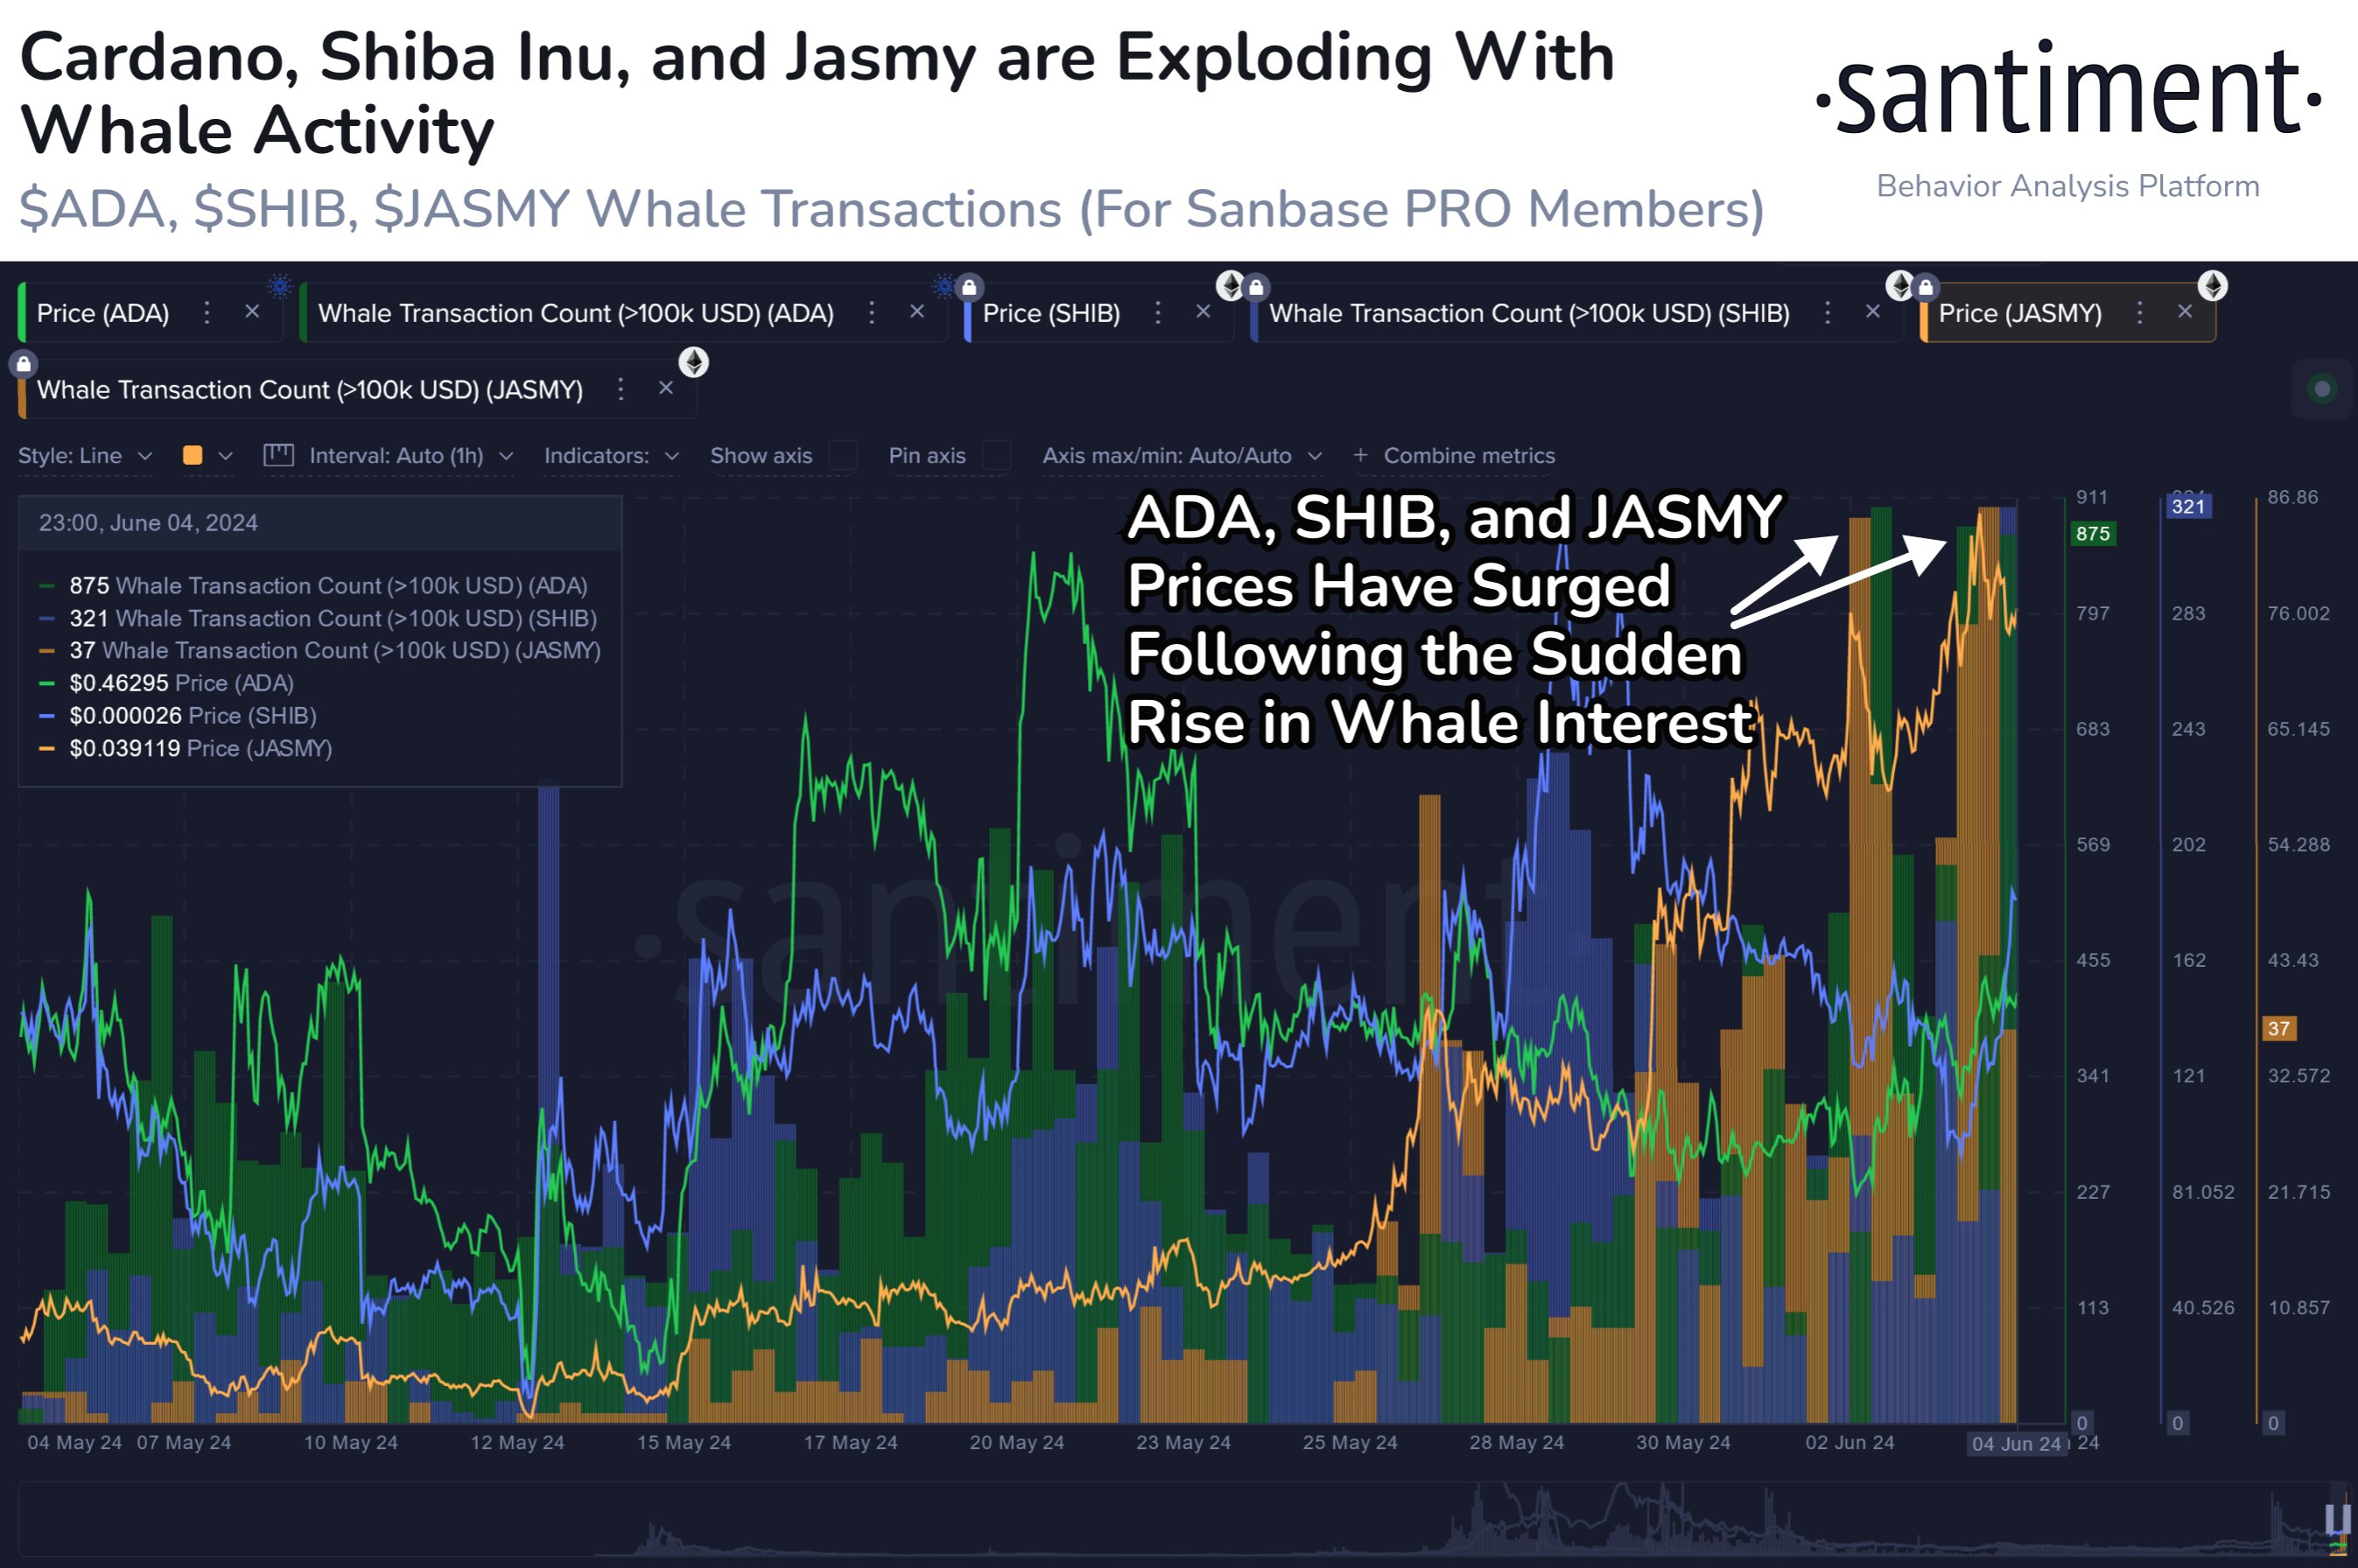
“Cadano, Shiba Inu, and Jasmy are all enjoying surges, each appearing to be triggered after a spike in whale interest.”
Cardano whales have gradually added ADA to their holdings since April. Cardano whales holding between 100 million and 1 billion ADA accumulated 11% to their wallet, as per IntoTheBlock. This group of whales now holds 6.71% of the entire ADA supply.
Lookonchain revealed that 9 wallets spent $35.2 million to buy 1.356 trillion SHIB. Today, a whale (0xa14) accumulated 37 billion SHIB from Binance.

JASMY continues to witness massive buying from whales and retail investors. However, profit booking has also unusual during buying.
Also Read: Shiba Inu Burn Rate Shoots 3900% Amid Whale Buying, SHIB Price To $0.0001?
Cardano, Shiba Inu, JASMY Price Performance
ADA price jumped over 4% this week. The price is currently trading at $0.459, down nearly 1% in the last 24 hours. The 24-hour low and high are $0.457 and $0.463, respectively. Furthermore, the trading volume has decreased by 17% in the last 24 hours.
SHIB price fell 2% in the last 24 hours, with the price currently trading at $0.00002557. The 24-hour low and high are $0.00002548 and $0.00002627, respectively. The 24-hour trading volume has dipped by 3%.
JASMY price rallied over 56% in a week and 100% in a month. However, the price is trading sideways at $0.03877 after DWF Labs decided to offload some holdings. The 24-hour trading volume has dipped by 60%.
Also Read:
The presented content may include the personal opinion of the author and is subject to market condition. Do your market research before investing in cryptocurrencies. The author or the publication does not hold any responsibility for your personal financial loss.


The Chainlink price is poised for liftoff, with a bullish rebound on the horizon. As LINK has soared past its key support level, analysts and traders remain bullish about the altcoin’s potential rally new heights.
Analysts like Ali Martinez and CRYPTOWZRD have identified critical levels for LINK, invoking the community’s attention. Let’s unveil Chainlink’s potential movements through the analyses of popular analysts.
Is Chainlink Price Ready for a Rebound?
In a detailed analysis, analyst Ali Martinez spotted key support and resistance levels for Chainlink. According to Ali’s analysis, Chainlink’s support level is established at $12.28, while $14.58 acts as a significant resistance hurdle.
With the Chainlink price breaking past its support line, which now acts as a foundation, the stage is set for a potential bullish reversal, signaling an upward trend. And, if LINK breaks past the $14.58 point, which has been a significant resistance point, further upside momentum comes into view, with potential new highs on the horizon.
Chainlink’s Next Target: Is $26 Within Reach?
According to market expert CRYPTOWZRD, Chainlink daily technical outlook is uncertain, with an indecisive close. However, the analyst highlighted that LINK is currently testing the significant $12.50 level. Given LINK’s oversold condition, its price movement is likely to follow Bitcoin’s trend.

Interestingly, as pointed out by CRYPTOWZRD, LINKBTC’s daily falling wedge formation suggests potential for an impulsive upside breakout. LINK itself is forming a daily falling wedge above its lower high trend line, indicating a possible rally towards the $16 resistance target and beyond.
Significantly, the chart presented by the expert indicates that LINK could hit $26 if it passes the resistance point. However, as per CoinGape’s Chainlink Price Prediction, LINK will reach a maximum of $15.24 in 2025.
Meanwhile, LINK’s intraday chart showed a lack of clear direction, with price movements confined to a narrow range. A breakout above $13.20 could present a trade opportunity, while a decline below $11.80 would signal a test of the main support level.
LINK Market Sentiment Analysis
In an “In/Out of the Money Around Price” analysis, Ali Martinez shared insights into the market sentiment for LINK. The analyst detailed the number of traders holding Chainlink at different price points.
At press time, Chainlink is trading at $12.81, up1.46%. Despite a 0.86% surge over the past week, LINK experienced a massive decline of 30.99% over the last month.
Notably, more addresses are holding LINK at a loss than at a profit. According to the chart, 53.06% of the holdings are “out of the money,” which means that they represent 78.24 million LINK bought at a price above the current $12.68.
At the same time, 44.63% of analyzed holdings, representing 65.81 million LINK, are ‘in the money,’ having been bought by traders at a price below $12.68. This data highlights potential support and resistance levels, with significant holdings at $12.47 and $14.19.
Nynu V Jamal
Nynu V Jamal is a passionate crypto journalist with three years of experience in blockchain, web3, and fintech spheres. She has established herself as a knowledgeable and engaging voice in the cryptocurrency and blockchain space. Her experience as an Assistant Professor in English Language and Literature has further added to her quest for crafting informative, well-researched, and accessible content.
Disclaimer: The presented content may include the personal opinion of the author and is subject to market condition. Do your market research before investing in cryptocurrencies. The author or the publication does not hold any responsibility for your personal financial loss.

Lorenzo Protocol (BANK) price has defied the broader market’s recent uncertain trend by rallying 150% this Saturday. The institutional-grade asset management platform has stolen the spotlight primarily as a top CEX, Binance, unveiled a new listing for its native token. As a result, traders and investors are extensively eyeing this crypto, speculating whether the pump could sustain amid enhanced market exposure.
Lorenzo Protocol Price Bullish As Binance Futures Adds BANKUSDT Contract
At the time of reporting, BANK price traded at $0.05237, up by a staggering 150% in just a day. The cryptocurrency’s price surged from a bottom of $0.01839 intraday, in sync with Binance’s announcement.
According to an official press release by the crypto exchange on April 18, the platform’s futures trading division is adding the BANK USD-Margined perpetual contract to its stockpile of offerings. The platform’s colossal user base remains poised to enjoy up to 50x leverage while trading the asset. The timeline for this launch was set at 18:30 UTC, the same day.
Further, the top crypto exchange set the capped funding rate at +2.00%/-2.00%. Also, the same perpetual contract will be available for ‘Futures Copy’ trading, offering users enhanced opportunities to make returns.
For context, usual market sentiments about the coin’s future price action have turned highly bullish with the new offering. Traders and investors are expecting a substantial influx of funds into the token as the new listing paves the way for more investor interaction with the asset.
Now, crypto market watchers are thoroughly monitoring the token for further gains, highly optimistic amid an ongoing rally of 150% following the listing announcement. Lorenzo Protocol is an institutional-grade asset management platform that issues yield-bearing tokens backed by diverse underlying strategies.
Besides, it’s worth mentioning that Binance revealed another crypto listing this week, CoinGape reported. The CEX has revealed plans to open trading for Balance (EPT) shortly, garnering further attention among traders and investors.
Coingape Staff
CoinGape comprises an experienced team of native content writers and editors working round the clock to cover news globally and present news as a fact rather than an opinion. CoinGape writers and reporters contributed to this article.
Disclaimer: The presented content may include the personal opinion of the author and is subject to market condition. Do your market research before investing in cryptocurrencies. The author or the publication does not hold any responsibility for your personal financial loss.
Solana (SOL) price has been under pressure recently, leading to concerns about a potential downtrend against Bitcoin (BTC). On the SOL/BTC price chart are signs that the cryptocurrency could be forming a “death cross,” a pattern that suggests a further decline in price.
This follows a period of weak performance for Solana relative to Bitcoin, sparking discussions on whether the altcoin can recover or continue to underperform.
Will Solana Form a Death Cross Against Bitcoin?
Over the past few months, Solana price has experienced a sharp decline when compared to Bitcoin. As of mid-April 2025, Solana is priced at 0.00158 BTC, down by 23% from earlier in the month. This comes after a significant 54% drop since January, showing a steady loss in value relative to Bitcoin.
The recent drop in Solana’s price has raised concerns among traders and analysts. Moving averages, which track price trends over time, have been narrowing, which is often a precursor to a potential death cross formation.

Specifically, the 23-day moving average is approaching the 200-day moving average in the weekly chart, a key level for technical analysts. If it crosses below the 200-day average, it would officially signal a death cross. This could indicate a further decline in Solana’s price against Bitcoin.
Solana’s Recent Performance and Market Trend
Nonetheless, Solana has had some strength, which can be attributed to the recent launch of Solana ETFs in Canada.
At the same time, institutional investors’ attention contributed to the altcoin’s success in surpassing the performance of numerous other cryptocurrencies, including Bitcoin. Solana delivered a 10.5% return within a week, while Bitcoin delivered a 1.8% return in the same time frame.
Nonetheless, the recent excitement about Solana appears to have subsided with the lessened market movements. Analysts like Ali Charts are now analysing whether the recent strength was just a blip in the charts or the first sign of an actual trend reversal to $65.
SOL/BTC Technical Patterns and Support Levels
Based on the current technical perspective, Solana’s price trend against Bitcoin has established the “Falling wedge” chart. This pattern is normally noticed during the consolidation phase, and the break above the upper trend line is usually interpreted as a signal for a bullish move.
The declining moving averages indicate that Solana may continue to decline against Bitcoin and possibly test lower supports despite the SOL/ETH ratio recording its highest weekly close
At present, the price is almost at the apex of the wedge pattern, meaning that it can break soon. If the price surmounts the resistance level at around 0.0018BTC, it will possibly lead to a bullish run and might even regain the value of 0.001895BTC for Sol. However, if the price cannot hold its support at 0.0014 BTC, then it may decrease even lower.

Solana’s performance against Bitcoin will be very significant over the next few weeks. The potential death cross and the support and resistance levels on the chart pinpoint that Solana might experience a difficult time moving forward. If the trend persists, the altcoin could potentially drop as low as 0.001 BTC—a price point that, when measured in dollar terms, is below $100.
Kelvin Munene Murithi
Kelvin is a distinguished writer with expertise in crypto and finance, holding a Bachelor’s degree in Actuarial Science. Known for his incisive analysis and insightful content, he possesses a strong command of English and excels in conducting thorough research and delivering timely cryptocurrency market updates.
Disclaimer: The presented content may include the personal opinion of the author and is subject to market condition. Do your market research before investing in cryptocurrencies. The author or the publication does not hold any responsibility for your personal financial loss.
Chainlink Price To Hit $26 If LINK Breaks Past This Crucial Level

Despite an 18% Drop, XRP’s Exchange Supply Hits Lows—Bullish Setup Ahead?

Lorenzo Protocol (BANK) Price Rallies 150% After This Binance Announcement

Matchain’s Petrix Barbosa Talks the Future of Digital Identity

Base Launches Strong, But Content Coins Draw Doubt

Pi Network, Grayscale’s Altcoin Shake-Up

2.52 Million Altcoins Are Ruining Crypto’s Future

Animoca Brands Valuation Tanks 75% In Two Years, Here’s Why

Crypto exchange BingX hacked for $43 million

Are The Big Players Losing Interest?

Hong Kong’s Securities Association Tips Authorities On Crypto Self-Regulation

Coinbase cbBTC Set to go Live on Solana
2.52 Million Altcoins Are Ruining Crypto’s Future
Animoca Brands Valuation Tanks 75% In Two Years, Here’s Why
Crypto exchange BingX hacked for $43 million
Are The Big Players Losing Interest?
Hong Kong’s Securities Association Tips Authorities On Crypto Self-Regulation
Coinbase cbBTC Set to go Live on Solana
-

 Market23 hours ago
Bitcoin Price Gears Up for Next Leg Higher—Upside Potential Builds
-
 Altcoin18 hours ago
Ethereum ETFs Record $32M Weekly Outflow; ETH Price Crash To $1.1K Imminent?
-

 Market10 hours ago
Pi Network Roadmap Frustrates Users Over Missing Timeline
-

 Market9 hours ago
Solana (SOL) Price Rises 13% But Fails to Break $136 Resistance
-
 Market21 hours ago
100 Million Tokens Could Trigger Decline
-

 Market19 hours ago
Why Relying on TVL Could Mislead Your DeFi Strategy
-

 Market18 hours ago
CZ’s Plan to Streamline BNB Staking Could Boost DeFi
-

 Market11 hours ago
MEME Rallies 73%, BONE Follows
✓ Share: