
Market
Is dogwifhat (WIF) on Track to Fall to a Five-Month Low?

dogwifhat (WIF) price noted a decline over the last few days, which has nearly erased the recent gains noted by the meme coin.
Mixed sentiments among investors and the broader market could drive the WIF price lower.
Dogwifhat Holders Seem Skeptical
The WIF price is painting red on the daily chart, which shows that the holders’ losses continue to mount. This is likely affecting their judgment regarding the meme coin, which is visible in their changing behavior.
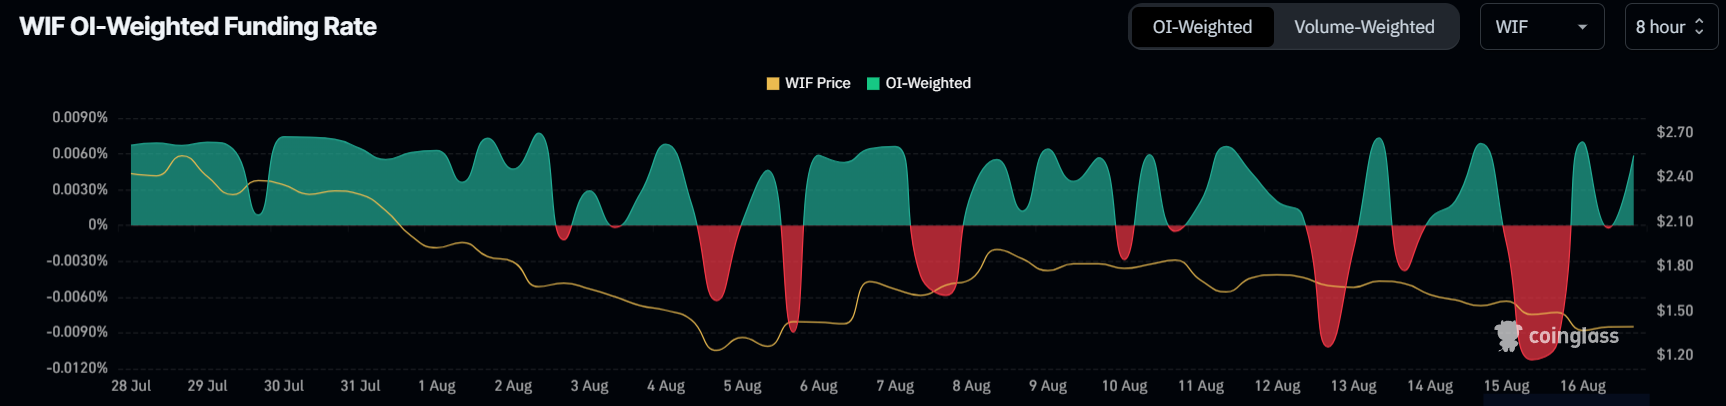
The uncertainty among WIF holders is further dampening the possibility of an uptrend. This is evident in the Funding Rate, which has been fluctuating between positive and negative for the past two weeks. It indicates a lack of clear direction in the market.
This oscillation in the Funding Rate reflects investor hesitation as they struggle to commit to either a bullish or bearish stance. Such uncertainty can often lead to increased volatility as the market searches for a new equilibrium.
Read more: How To Buy Dogwifhat (WIF) and Everything Else To Know
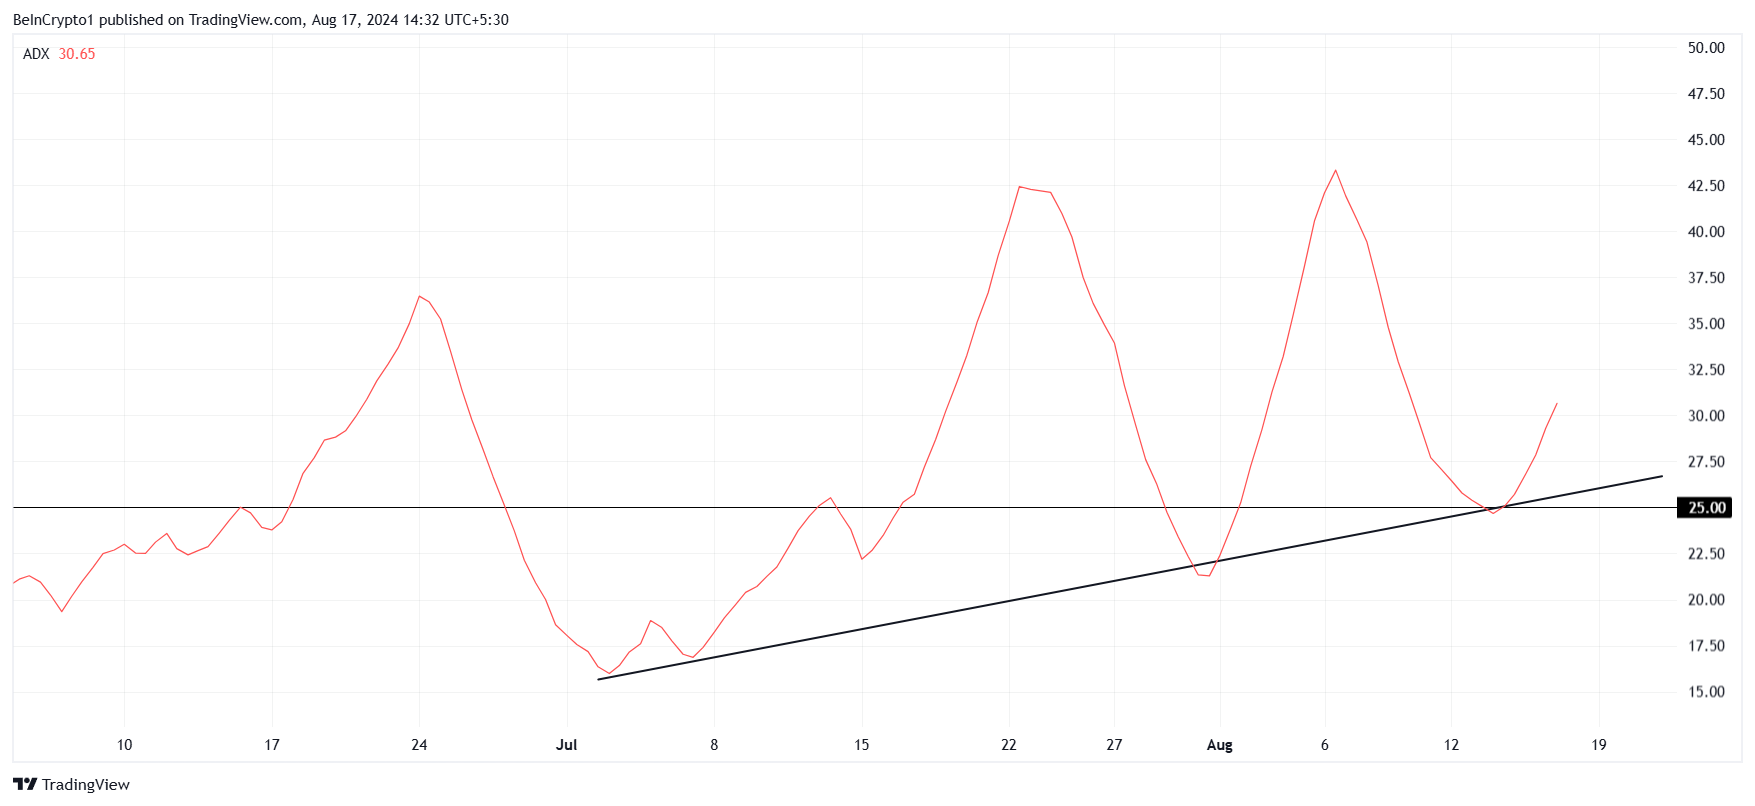
Meanwhile, the ADX (Average Directional Index) is highlighting a strengthening macro trend, which happens to be bearish. The indicator is currently above the critical threshold of 25.0, signaling that the downtrend is gaining momentum.
With the ADX pointing to a further decline in WIF price, the investors may need to brace for continued downward pressure. The combination of investor uncertainty and a strengthening bearish trend could lead to higher losses in the short term.
WIF Price Prediction: New Lows Ahead
WIF price is presently trading at $1.39, marking a 27% drawdown in the last seven days. This drawdown has nearly erased the 51% rally observed in three days in early August. As a result of this decline, the meme coin lost the potential to note an uptrend.
WIF is now at risk with a drop to $1.24, the critical support level for the meme coin. If the aforementioned factors prove to be true and the altcoin falls further, it could lose this support. The meme coin would thus mark a five-month low, falling to $1.04.
Read more: Dogwifhat (WIF) Price Prediction 2024/2025/2030
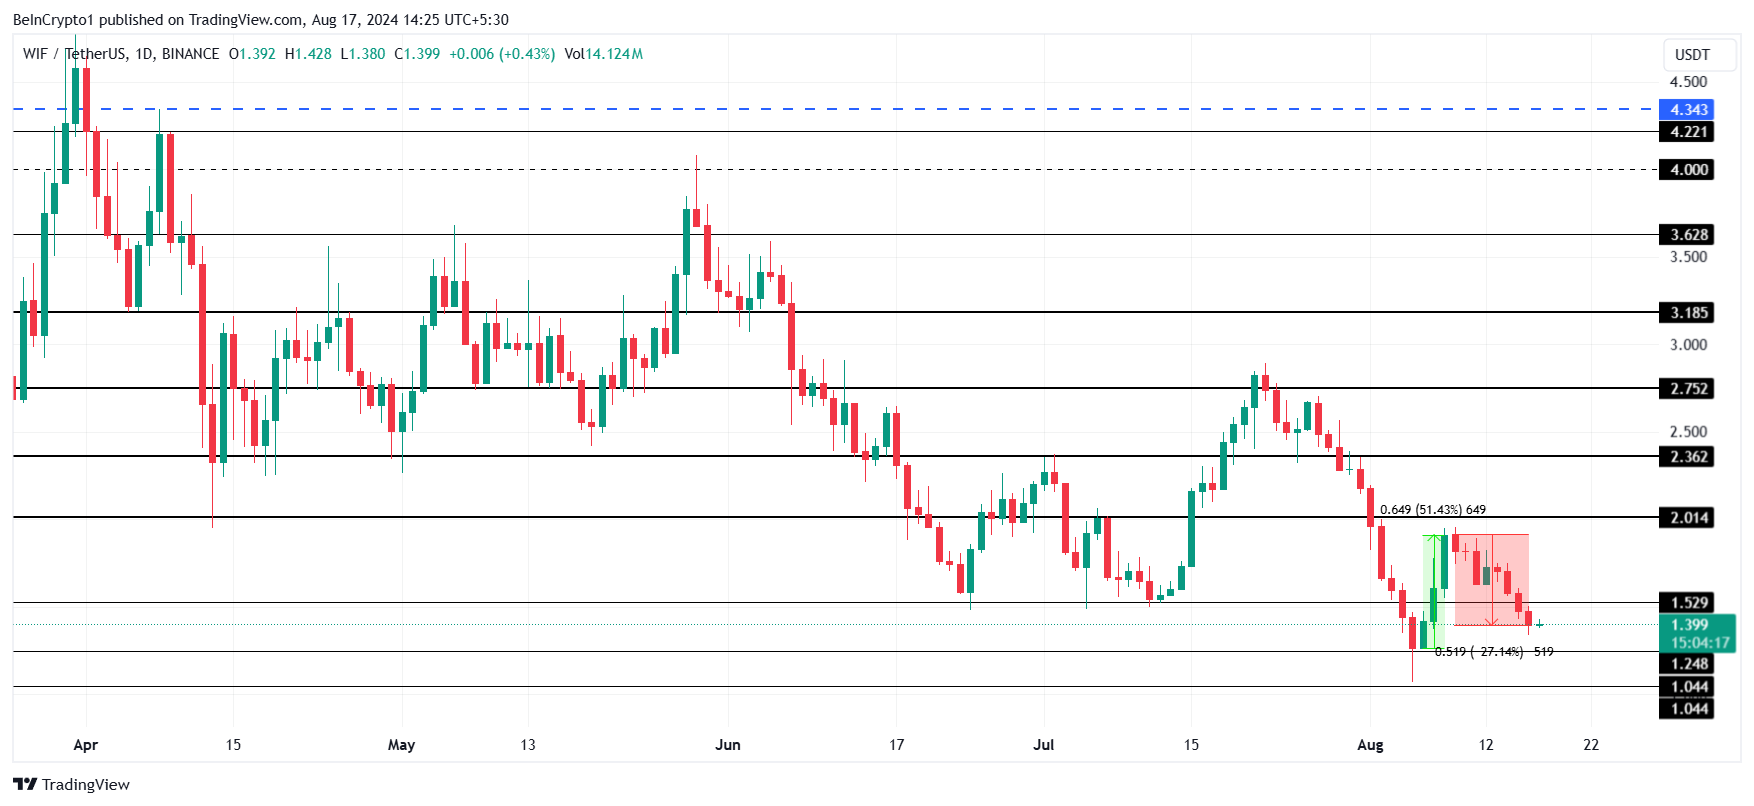
On the other hand, if the WIF price bounces off this support as it has in the past, the decline could be prevented. The altcoin would be on its way to reclaiming $2.01 as support, and a breach would completely invalidate the bearish thesis.
Disclaimer
In line with the Trust Project guidelines, this price analysis article is for informational purposes only and should not be considered financial or investment advice. BeInCrypto is committed to accurate, unbiased reporting, but market conditions are subject to change without notice. Always conduct your own research and consult with a professional before making any financial decisions. Please note that our Terms and Conditions, Privacy Policy, and Disclaimers have been updated.


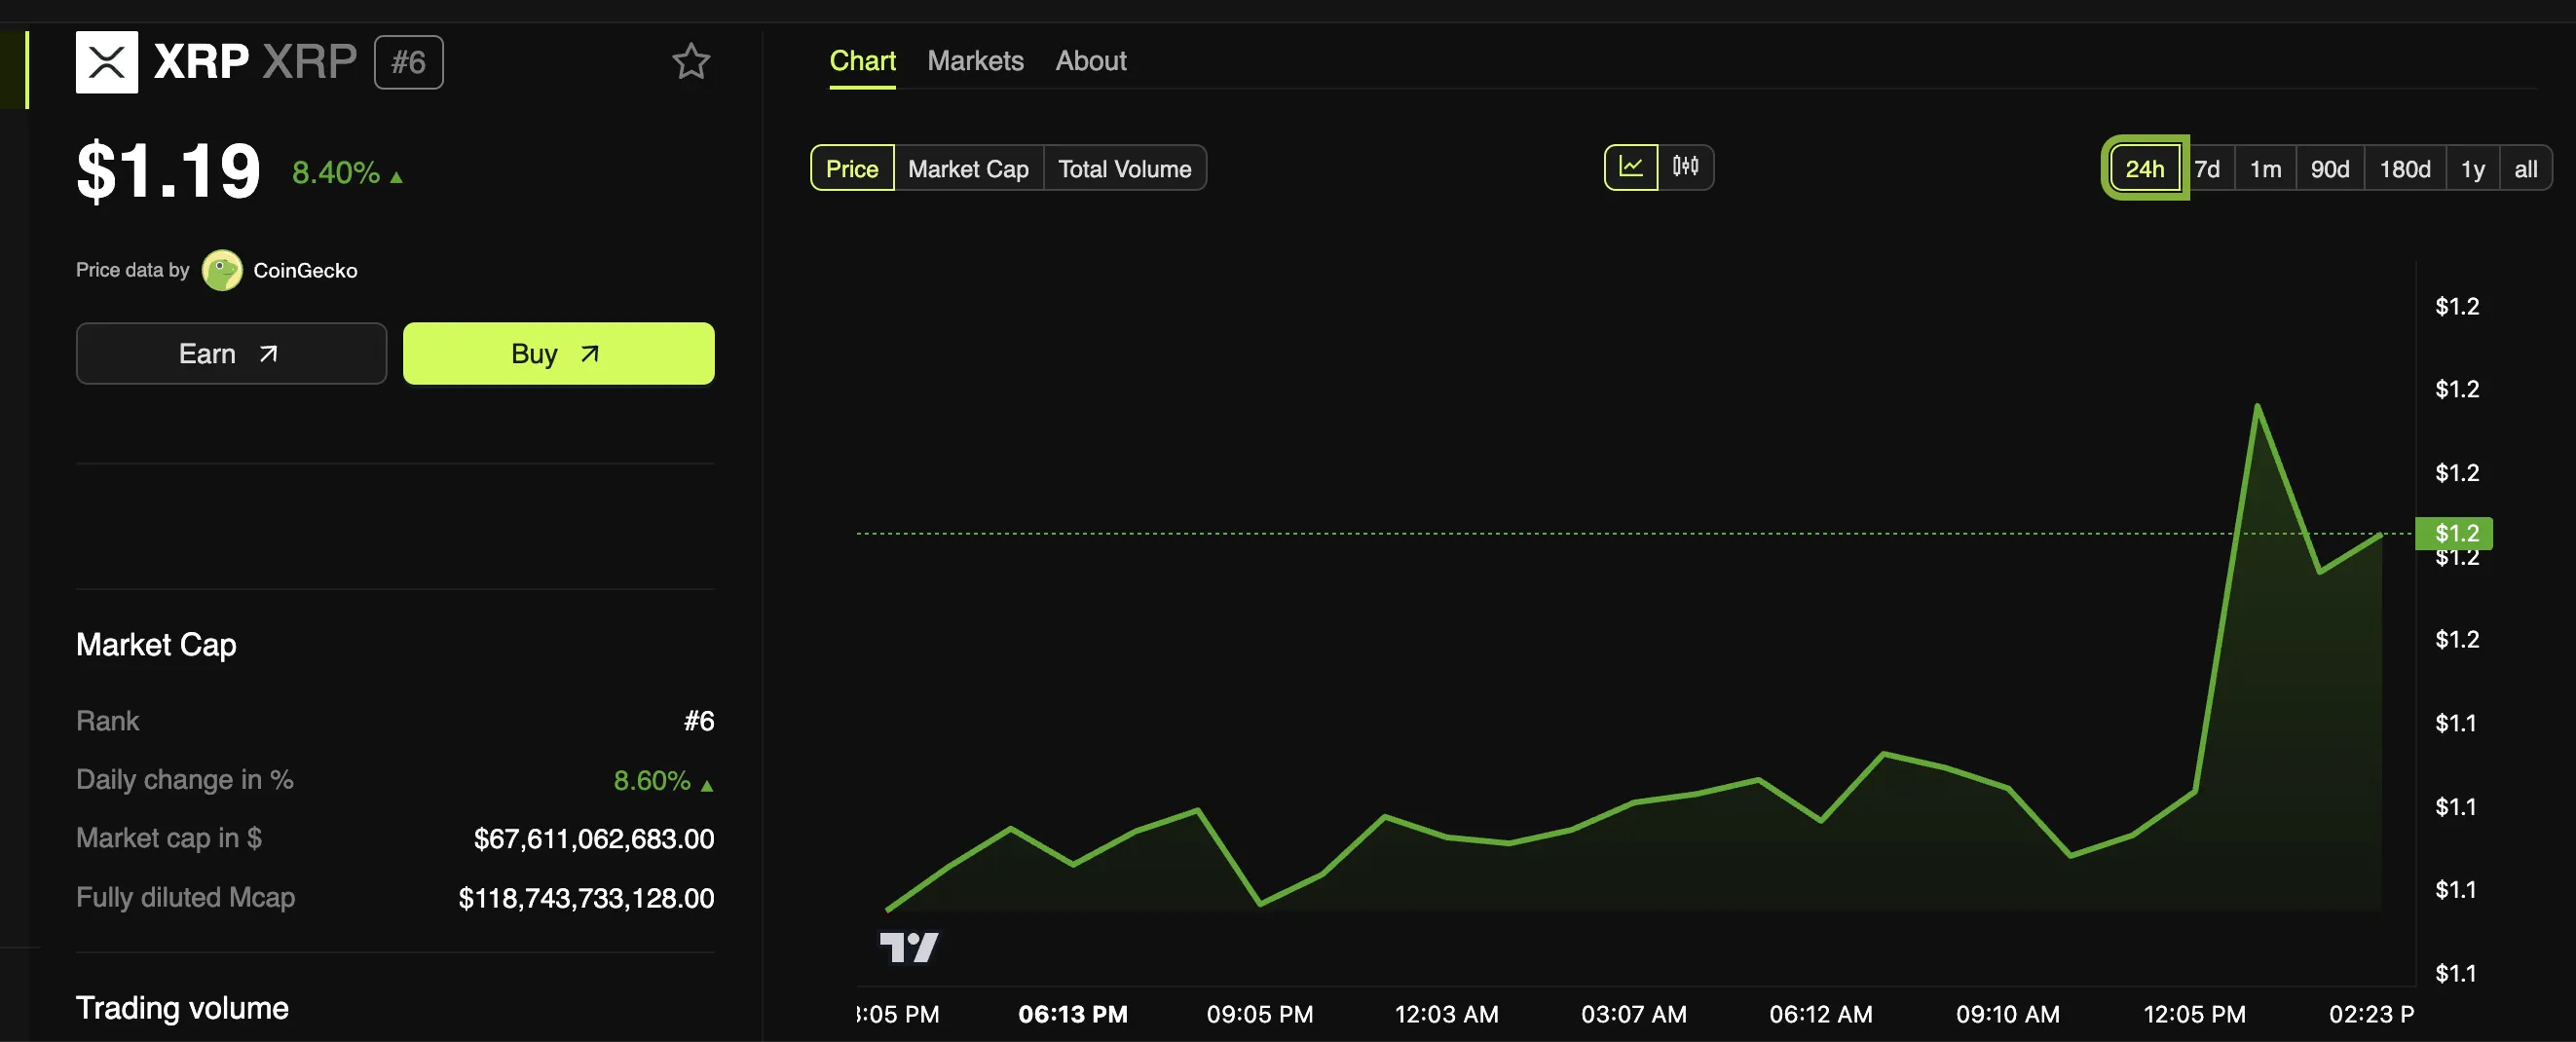
ETF issuer WisdomTree’s European division just announced a new ETP based on XRP. This product is currently available in four EU countries, which has led XRP’s price to jump slightly.
ETPs are a common issuer strategy to earn revenue without ETF approval, but Europe will not necessarily approve one even if the US does so.
WisdomTree’s XRP ETP
WisdomTree, one of the Bitcoin ETF issuers in the US, announced that its European branch is offering an exchange-traded product (ETP) based on XRP. This new product is currently available in Germany, Switzerland, France, and the Netherlands. A growing number of issuers have filed for an XRP ETF, but WisdomTree is taking a slightly different tack.
“The WisdomTree Physical XRP ETP offers a simple, secure, and low-cost way to gain exposure to XRP, one of the largest cryptocurrencies by market capitalization. Backed 100% by XRP, XRPW is the lowest-priced XRP ETP in Europe, providing direct spot price exposure,” the announcement claimed.
The possibility of an official XRP ETF is growing with the current bull market, and Ripple CEO Brad Garlinghouse considers it “inevitable.” Still, it hasn’t happened yet, and ETP offerings allow issuers to somewhat address customers’ requirements. BitWise, which has also filed for an XRP ETF in the US, recently acquired a European ETP issuer to enter the same market.
WisdomTree, however, is no stranger to this market strategy. In May this year, it won approval to offer ETPs based on Bitcoin and Ethereum to British investors.
The UK has not yet approved a full ETF for either of these assets, but WisdomTree still gained market access. Even a fraction of the XRP market could also prove lucrative; the asset’s value spiked today.
WisdomTree Europe’s strategy page does not describe any further actions upon full approval. Even if the US approves an XRP ETF under the SEC’s new leadership, that won’t necessarily benefit WisdomTree’s European branch. For now, these ETPs built on XRP will have to suffice for this market.
Disclaimer
In adherence to the Trust Project guidelines, BeInCrypto is committed to unbiased, transparent reporting. This news article aims to provide accurate, timely information. However, readers are advised to verify facts independently and consult with a professional before making any decisions based on this content. Please note that our Terms and Conditions, Privacy Policy, and Disclaimers have been updated.

Ethereum price started a fresh increase above the $3,220 zone. ETH is rising and aiming for more gains above the $3,350 resistance.
- Ethereum started a fresh increase above the $3,220 and $3,300 levels.
- The price is trading above $3,250 and the 100-hourly Simple Moving Average.
- There is a short-term contracting triangle forming with resistance at $3,360 on the hourly chart of ETH/USD (data feed via Kraken).
- The pair could gain bullish momentum if it clears the $3,385 resistance zone.
Ethereum Price Regains Traction
Ethereum price remained supported above $3,000 and started a fresh increase like Bitcoin. ETH gained pace for a move above the $3,150 and $3,220 resistance levels.
The bulls pumped the price above the $3,300 level. It gained over 10% and traded as high as $3,387. It is now consolidating gains above the 23.6% Fib retracement level of the recent move from the $3,036 swing low to the $3,387 high.
Ethereum price is now trading above $3,220 and the 100-hourly Simple Moving Average. On the upside, the price seems to be facing hurdles near the $3,350 level. There is also a short-term contracting triangle forming with resistance at $3,360 on the hourly chart of ETH/USD.

The first major resistance is near the $3,385 level. The main resistance is now forming near $3,420. A clear move above the $3,420 resistance might send the price toward the $3,550 resistance. An upside break above the $3,550 resistance might call for more gains in the coming sessions. In the stated case, Ether could rise toward the $3,650 resistance zone or even $3,880.
Another Decline In ETH?
If Ethereum fails to clear the $3,350 resistance, it could start another decline. Initial support on the downside is near the $3,300 level. The first major support sits near the $3,250 zone.
A clear move below the $3,250 support might push the price toward $3,220 or the 50% Fib retracement level of the recent move from the $3,036 swing low to the $3,387 high. Any more losses might send the price toward the $3,150 support level in the near term. The next key support sits at $3,050.
Technical Indicators
Hourly MACD – The MACD for ETH/USD is gaining momentum in the bullish zone.
Hourly RSI – The RSI for ETH/USD is now above the 50 zone.
Major Support Level – $3,250
Major Resistance Level – $3,385
Ethereum price started a fresh increase above the $3,220 zone. ETH is rising and aiming for more gains above the $3,350 resistance.
- Ethereum started a fresh increase above the $3,220 and $3,300 levels.
- The price is trading above $3,250 and the 100-hourly Simple Moving Average.
- There is a short-term contracting triangle forming with resistance at $3,360 on the hourly chart of ETH/USD (data feed via Kraken).
- The pair could gain bullish momentum if it clears the $3,385 resistance zone.
Ethereum Price Regains Traction
Ethereum price remained supported above $3,000 and started a fresh increase like Bitcoin. ETH gained pace for a move above the $3,150 and $3,220 resistance levels.
The bulls pumped the price above the $3,300 level. It gained over 10% and traded as high as $3,387. It is now consolidating gains above the 23.6% Fib retracement level of the recent move from the $3,036 swing low to the $3,387 high.
Ethereum price is now trading above $3,220 and the 100-hourly Simple Moving Average. On the upside, the price seems to be facing hurdles near the $3,350 level. There is also a short-term contracting triangle forming with resistance at $3,360 on the hourly chart of ETH/USD.
The first major resistance is near the $3,385 level. The main resistance is now forming near $3,420. A clear move above the $3,420 resistance might send the price toward the $3,550 resistance. An upside break above the $3,550 resistance might call for more gains in the coming sessions. In the stated case, Ether could rise toward the $3,650 resistance zone or even $3,880.
Another Decline In ETH?
If Ethereum fails to clear the $3,350 resistance, it could start another decline. Initial support on the downside is near the $3,300 level. The first major support sits near the $3,250 zone.
A clear move below the $3,250 support might push the price toward $3,220 or the 50% Fib retracement level of the recent move from the $3,036 swing low to the $3,387 high. Any more losses might send the price toward the $3,150 support level in the near term. The next key support sits at $3,050.
Technical Indicators
Hourly MACD – The MACD for ETH/USD is gaining momentum in the bullish zone.
Hourly RSI – The RSI for ETH/USD is now above the 50 zone.
Major Support Level – $3,250
Major Resistance Level – $3,385

Dogecoin Hashrate Surges To New All-Time High Amid Rise In Positive Momentum
WisdomTree Europe Launches XRP ETP

BTC Surges to $99K, ETH Shoots, XRP Jumps 25%

Rallies 10% and Targets More Upside
Rallies 10% and Targets More Upside

“Crypto Dad” Chris Giancarlo Emerges Top For White House Crypto Czar Role

2.52 Million Altcoins Are Ruining Crypto’s Future

Animoca Brands Valuation Tanks 75% In Two Years, Here’s Why

Crypto exchange BingX hacked for $43 million

Are The Big Players Losing Interest?

Hong Kong’s Securities Association Tips Authorities On Crypto Self-Regulation

Coinbase cbBTC Set to go Live on Solana
2.52 Million Altcoins Are Ruining Crypto’s Future
Animoca Brands Valuation Tanks 75% In Two Years, Here’s Why
Crypto exchange BingX hacked for $43 million
Are The Big Players Losing Interest?
Hong Kong’s Securities Association Tips Authorities On Crypto Self-Regulation
Coinbase cbBTC Set to go Live on Solana
-

 Ethereum22 hours ago
Fundraising platform JustGiving accepts over 60 cryptocurrencies including Bitcoin, Ethereum
-

 Market19 hours ago
South Korea Unveils North Korea’s Role in Upbit Hack
-

 Market23 hours ago
Cardano’s Hoskinson Wants Brian Armstrong for US Crypto-Czar
-
 Altcoin16 hours ago
Dogecoin Whale Accumulation Sparks Optimism, DOGE To Rally 9000% Ahead?
-
 Altcoin21 hours ago
Why FLOKI Price Hits 6-Month Peak With 5% Surge?
-

 Bitcoin14 hours ago
Marathon Digital Raises $1B to Expand Bitcoin Holdings
-
 Market14 hours ago
ETH/BTC Ratio Plummets to 42-Month Low Amid Bitcoin Surge
-
 Altcoin24 hours ago
SHIB Burn Rate Surges 2200%, Shiba Inu Eyes Parabolic Rally Ahead?