
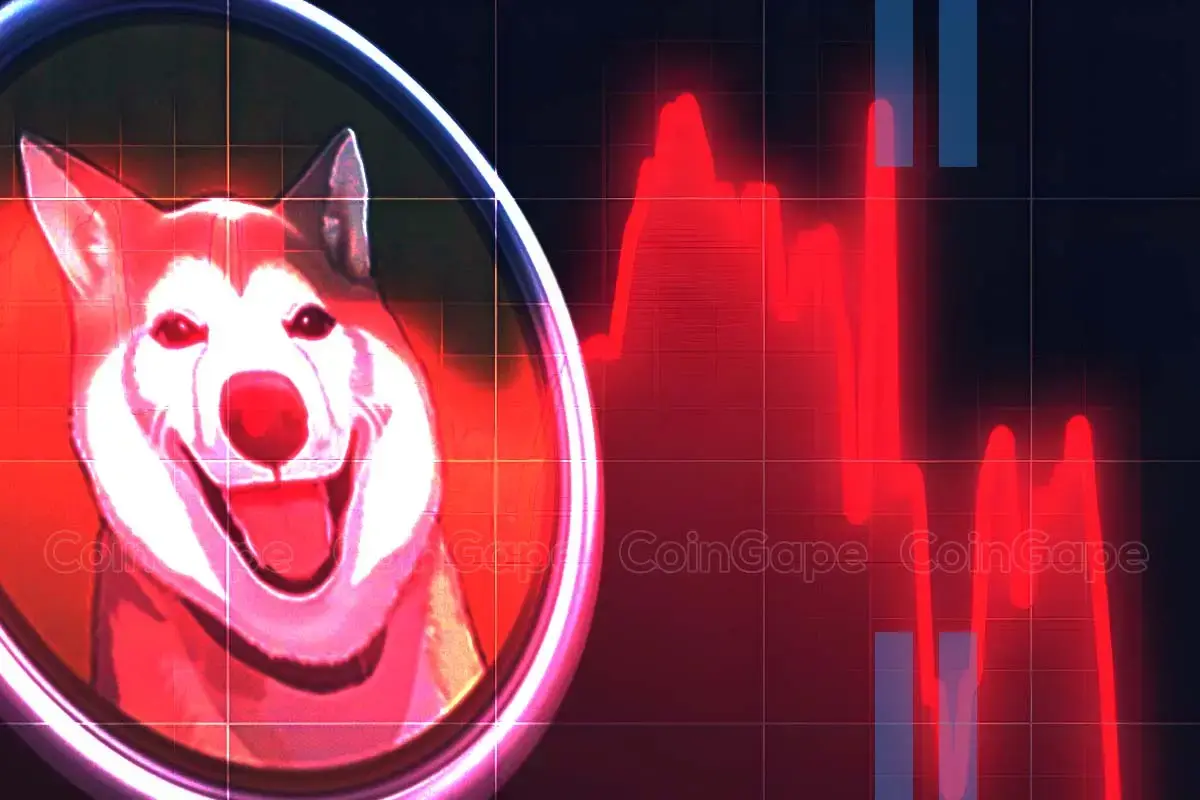
Market
The Meme Market in the Past Seven Days

This week, the meme coins market has witnessed a noticeable decline in activity, with the sector’s capitalization dropping 5% over the past five days.
Many meme assets have seen their value fall during this time, with several prominent tokens suffering double-digit losses.
Dogwifhat (WIF) Records Losses as Short Traders Take Over
WIF has experienced the steepest decline among the top five meme assets by market capitalization this past week. Trading at $1.48 at press time, the altcoin’s value has dropped by 20% during this period. On Thursday, the meme coin hit a weekly low of $1.45 before rebounding slightly.
WIF’s downtrend has fueled a rise in demand for short positions in its derivatives market. Coinglass data shows that WIF’s funding rates have remained mostly negative throughout the week, currently sitting at -0.0098%.
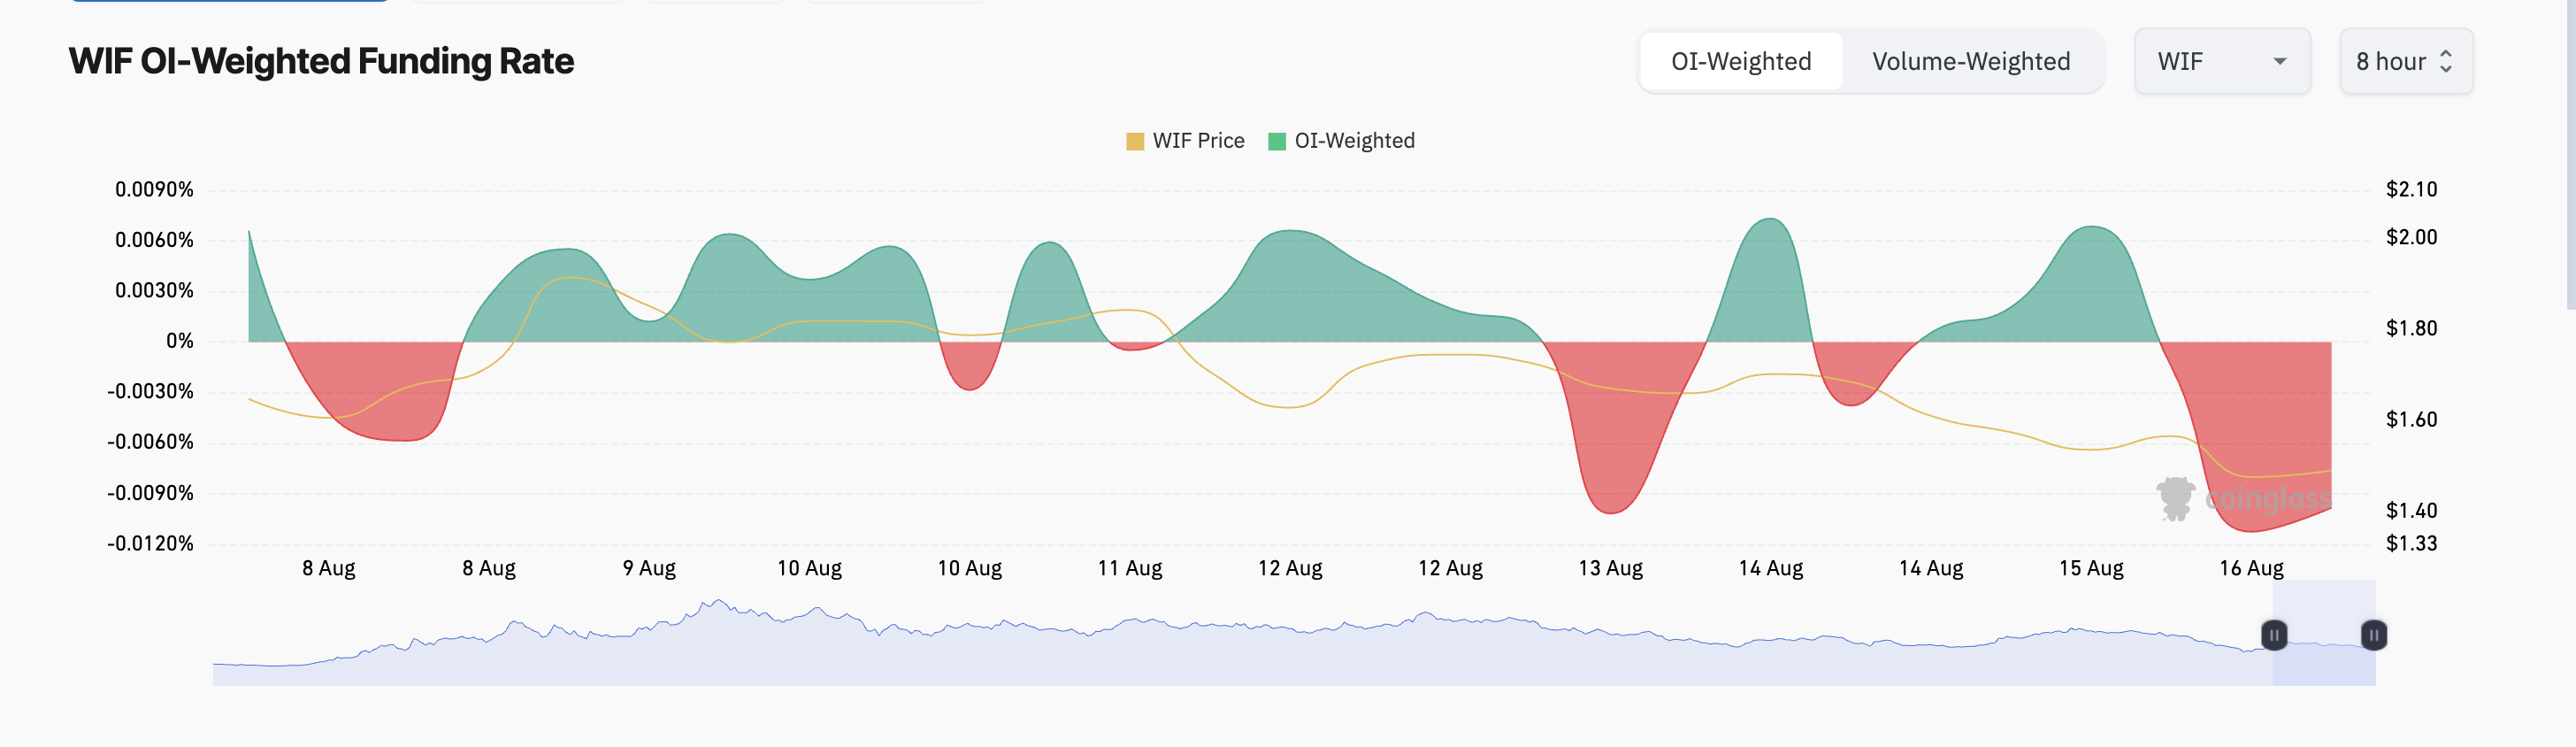
Funding rates are a mechanism used in perpetual futures contracts to ensure an asset’s contract price stays close to its spot price. When they are negative, more traders are betting on a price decline than those buying and hoping for a rally.
In the spot market, demand for WIF has also declined significantly. Its Relative Strength Index (RSI) is trending downward at 38.22, indicating that selling pressure is currently stronger than token accumulation.
Read more: How To Buy Dogwifhat (WIF) and Everything Else To Know
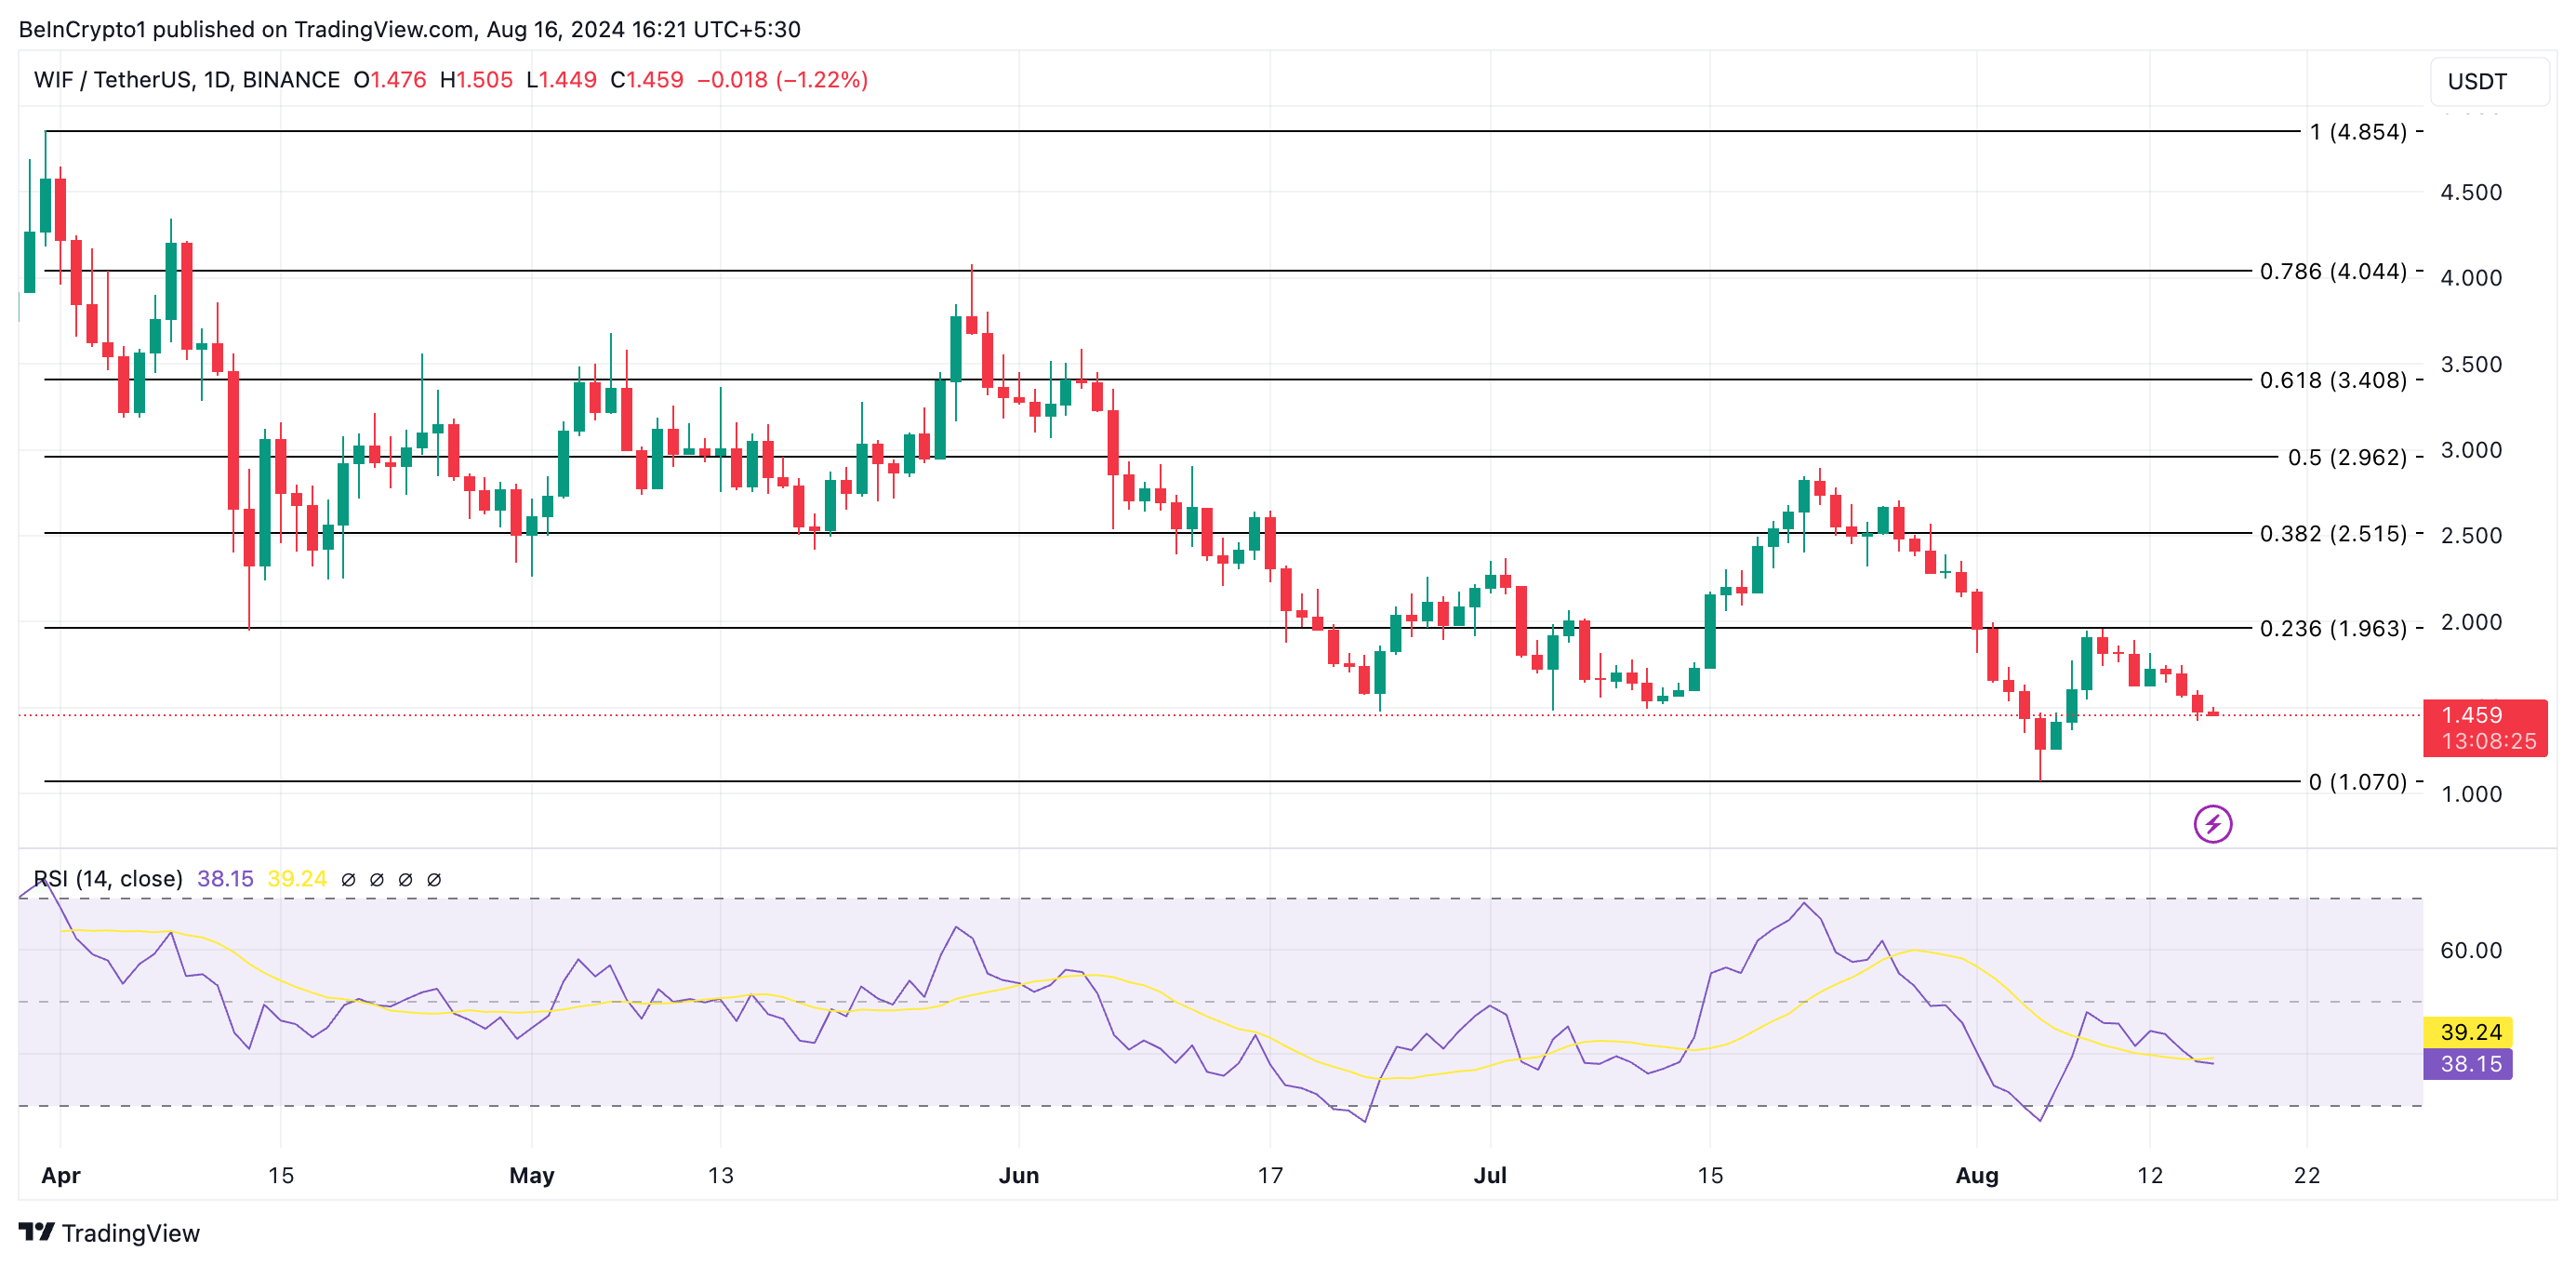
If this downtrend continues, WIF’s value could drop further to $1.07. However, a shift in market sentiment and a spike in demand could push its price up to $1.96.
Pepe (PEPE) Risks 23% Fall as Selling Pressure Mounts
The frog-themed coin Pepe is currently trading at $0.0000075, with its value down by 14%. This week, PEPE’s Accumulation/Distribution (A/D) Line has been in a consistent downtrend. At 780.42 trillion at press time, it has dropped by 5% over the past seven days.
The A/D Line tracks money flow into or out of an asset, indicating whether it is being accumulated or distributed. A declining A/D Line signals that selling pressure is outweighing buying activity — a bearish indicator that suggests further price drops.
Adding to this outlook is PEPE’s decreasing Chaikin Money Flow (CMF). Currently at -0.18 and below zero, the CMF is also trending downward. A falling price paired with a declining CMF confirms rising selling pressure, indicating that more traders are offloading PEPE than accumulating it.
Read more: Pepe (PEPE) Price Prediction 2024/2025/2030
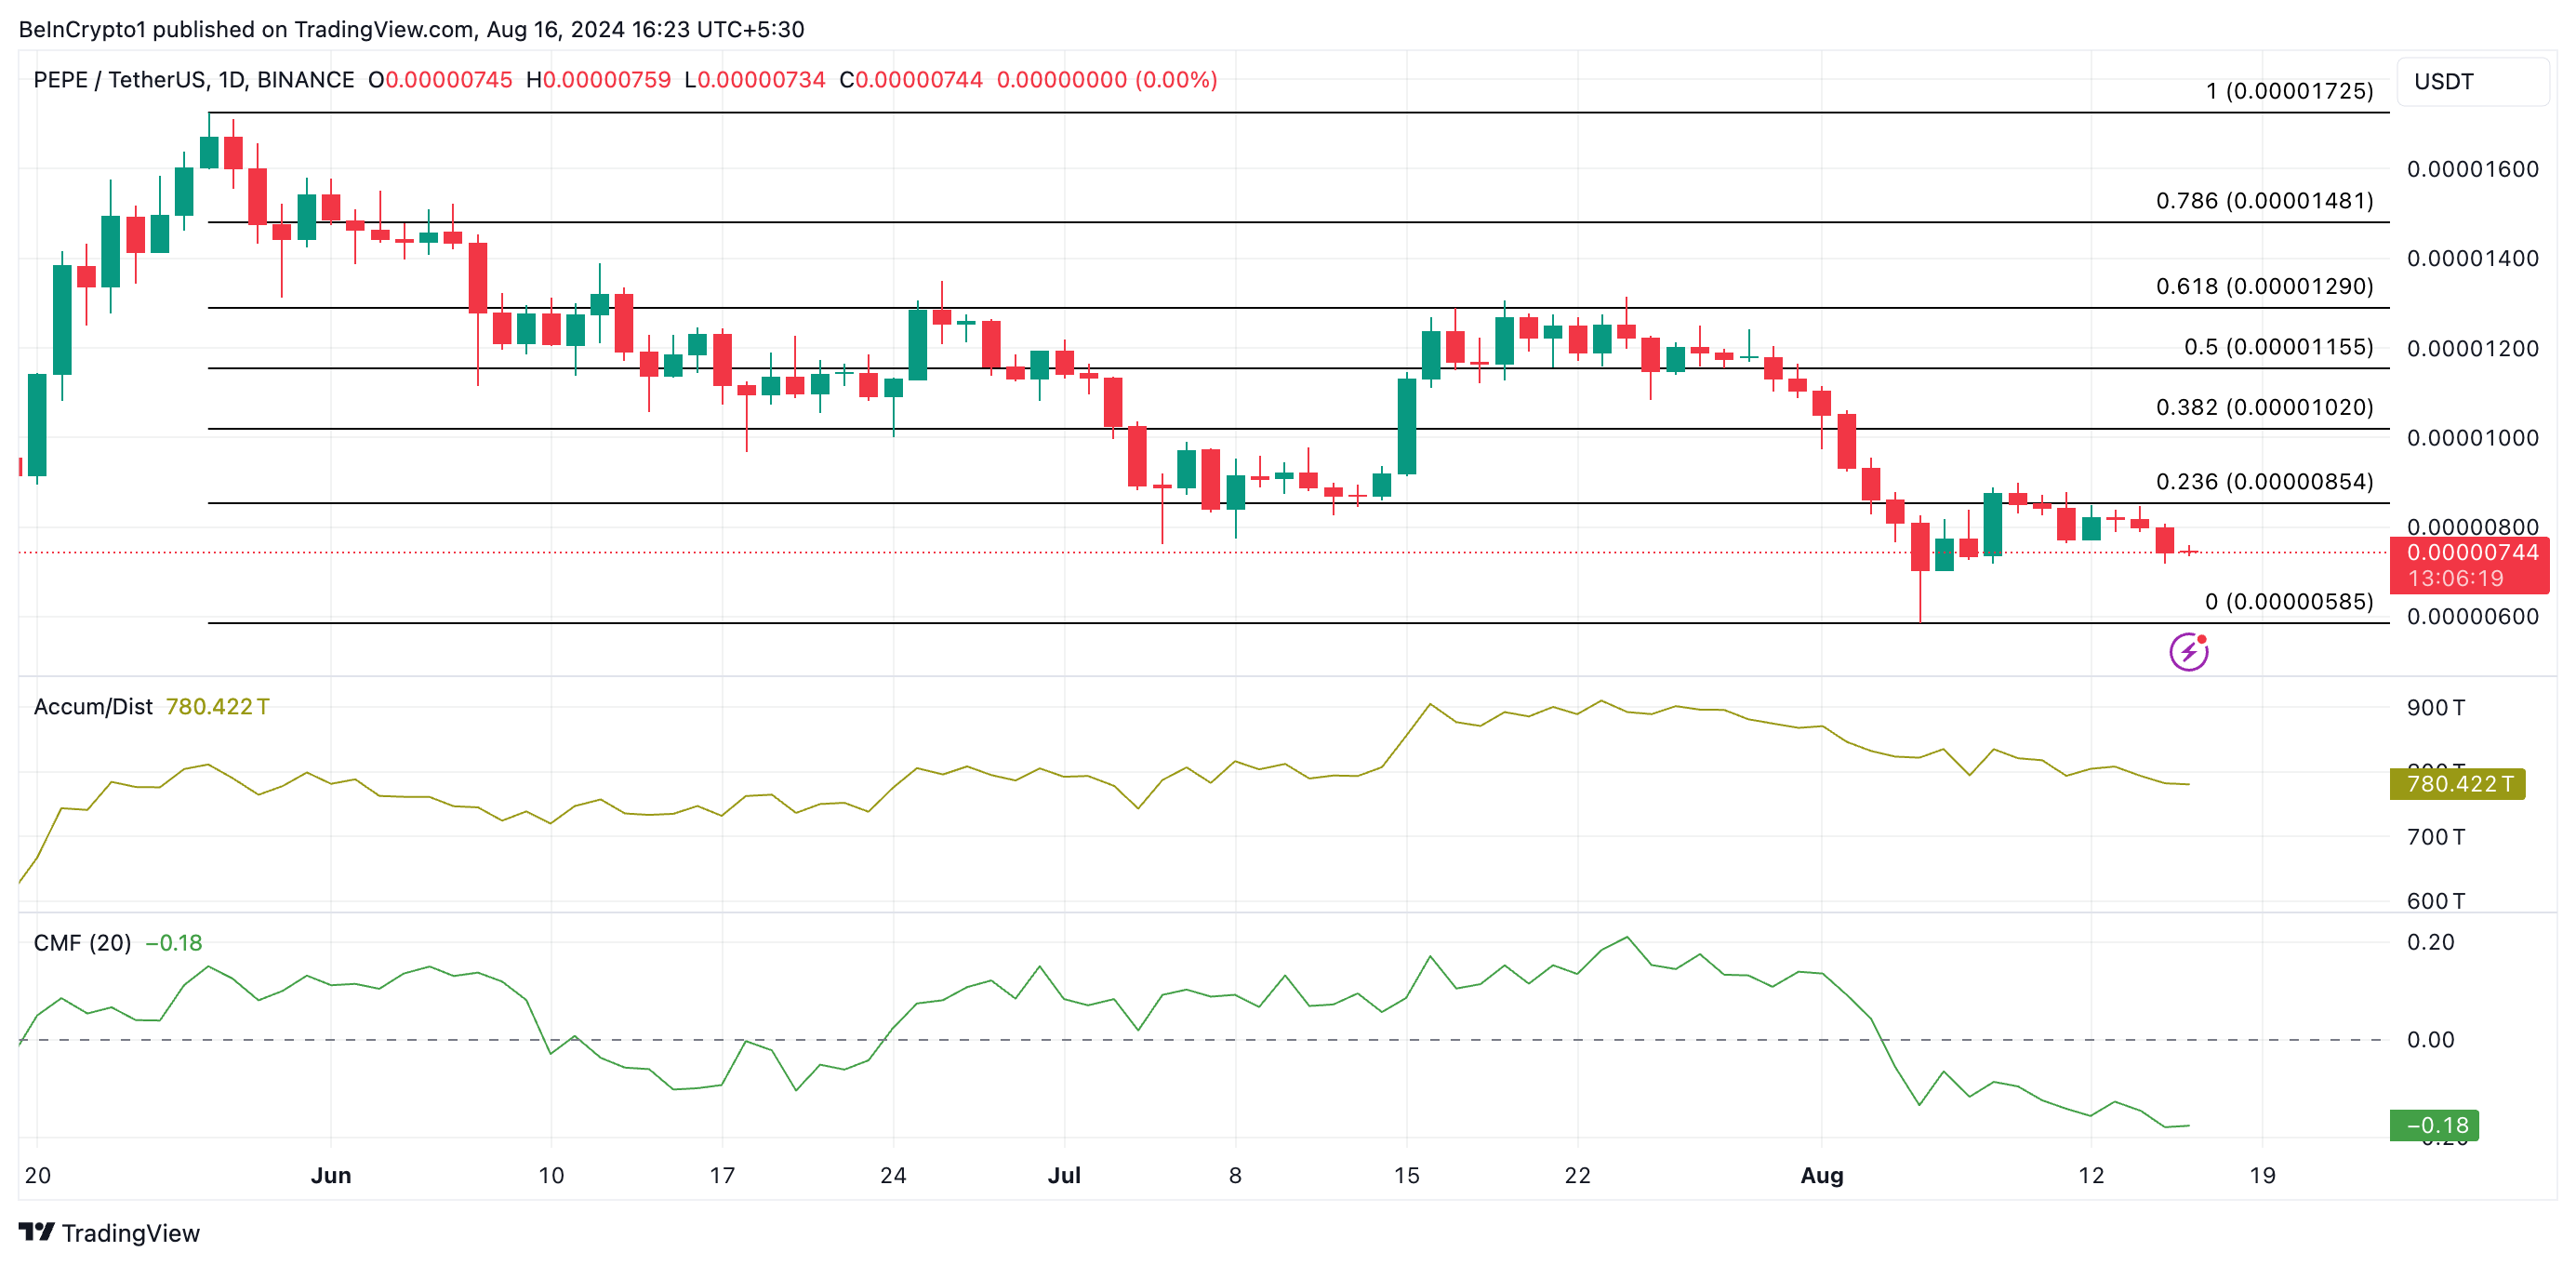
If PEPE’s buying pressure remains low, its price may fall 23% to trade at $0.0000058. This bearish projection would be invalidated if the meme coin saw a demand spike, pushing its price to $0.0000085.
Bonk (BONK) Poised for a “Death Cross”
A one-day chart analysis of BONK reveals the potential formation of a “death cross,” where the 50-day simple moving average (SMA) (blue line) is nearing a cross below the 200-day SMA (yellow line).
A “death cross” occurs when the 50-day SMA dips below the 200-day SMA, signaling a bearish trend. This suggests that BONK’s short-term rally is weakening and may be shifting toward a downtrend. Traders often view this pattern as a sell signal, prompting them to exit long positions and consider taking short positions.
Read more: How to Buy Solana Meme Coins: A Step-By-Step Guide
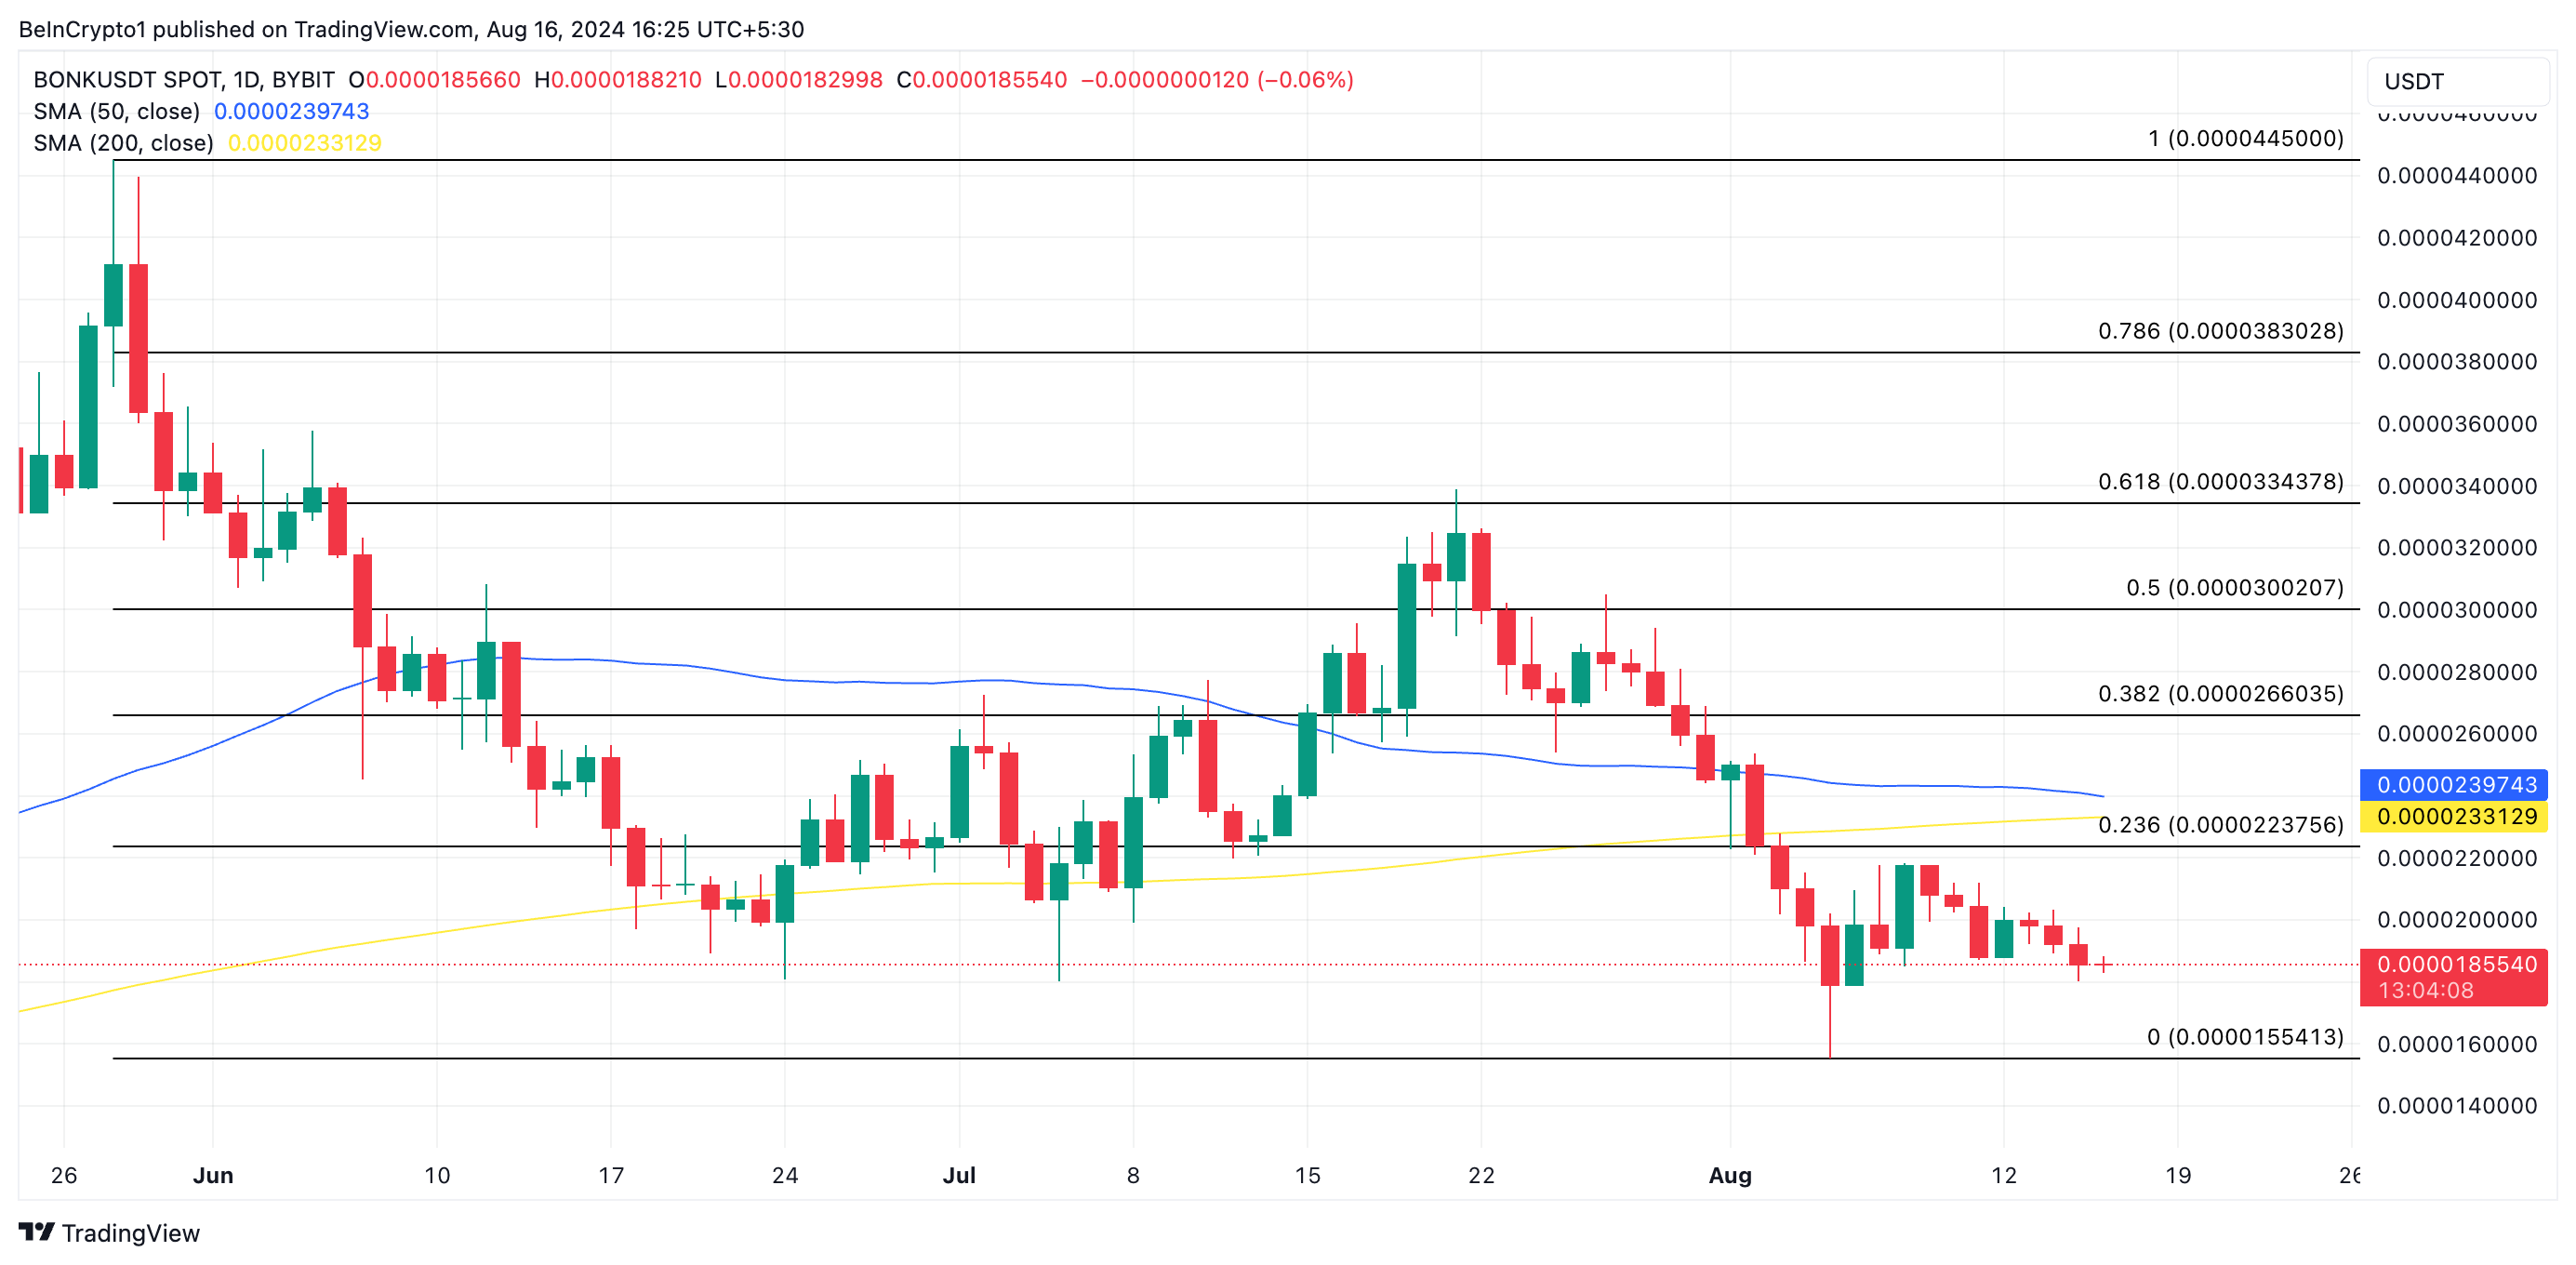
At press time, BONK trades at $0.000018, having declined 11% this week. If selling pressure mounts as the “death cross” forms, its price will drop to $0.0000015. However, if the moving averages change course due to any rally in demand, it may push BONK’s price up to $0.000022.
Disclaimer
In line with the Trust Project guidelines, this price analysis article is for informational purposes only and should not be considered financial or investment advice. BeInCrypto is committed to accurate, unbiased reporting, but market conditions are subject to change without notice. Always conduct your own research and consult with a professional before making any financial decisions. Please note that our Terms and Conditions, Privacy Policy, and Disclaimers have been updated.


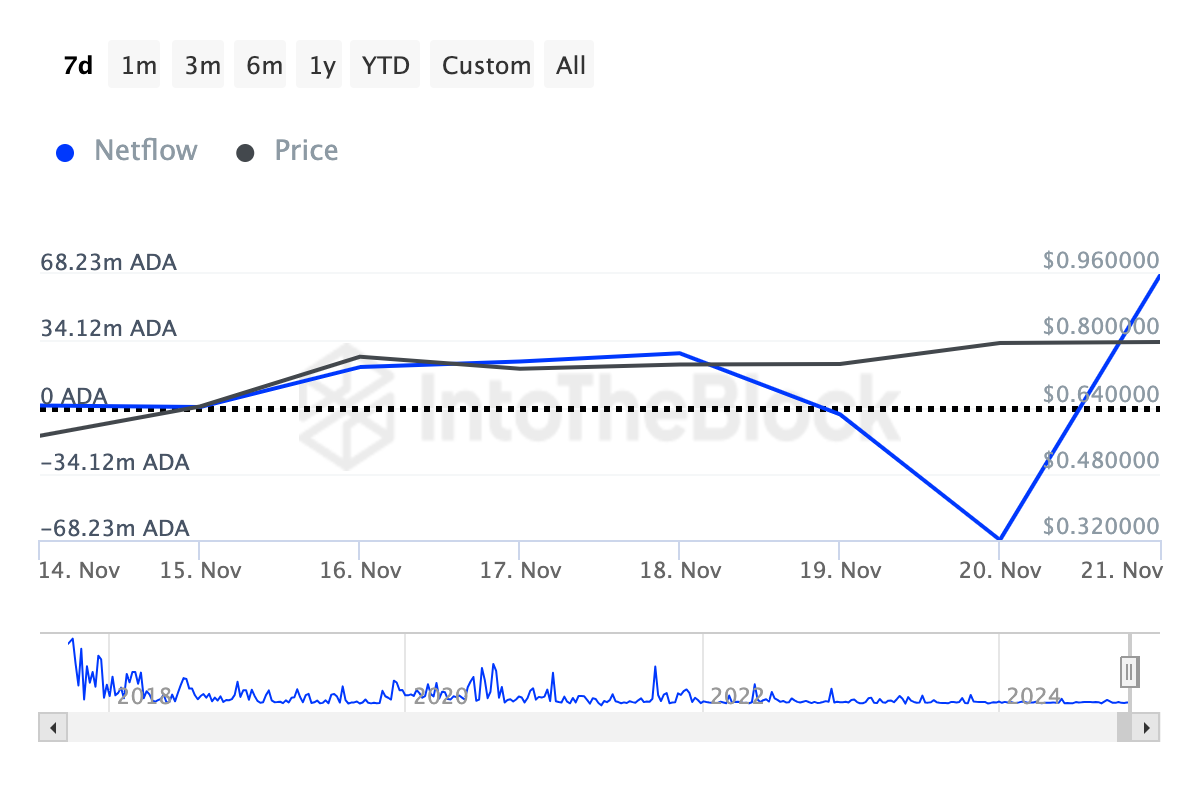
On November 20, crypto whales offloaded significant amounts of Cardano (ADA), disrupting its bullish momentum. However, the narrative shifted today as the Cardano whales’ accumulation has taken center stage.
This renewed buying activity suggests that ADA’s price might regain its bullish momentum toward $1. But does the data support this bullish outlook?
Cardano Key Investors Change Their Stance
According to IntoTheBlock, Cardano’s large holders’ netflow has surged to 67.51 million ADA, signaling a significant shift in sentiment among crypto whales. The netflow represents the difference between the amount of ADA purchased and sold by large holders over a specific period.
When netflow increases, it indicates that whales are buying more than they are selling. Typically, this is a bullish signal. Conversely, a drop in netflow suggests more selling by whales, which is generally regarded as bearish.
In this case, the recent netflow increase, valued at approximately $55 million, aligns with ADA’s 11% price surge over the last 24 hours. Thus, this Cardano whales accumulation suggests that ADA may be poised for further gains, with the recent uptick serving as a potential foundation for a higher value.
Furthermore, the In/Out of Money Around Price (IOMAP) indicator provides further support for this bullish outlook. For context, the IOMAP analyzes token clusters based on three groups: holders who purchased below the current price (in the money), above the current price (out of the money), and those at breakeven.
This metric is essential for identifying potential support and resistance zones. Specifically, if there is a higher number of tokens “in the money, ” it signifies solid support, as many holders are at a profit and less likely to sell, potentially driving the price higher.
On the other hand, a higher “out of the money,” volume points to resistance, as holders might sell to recover losses, putting downward pressure on the price.
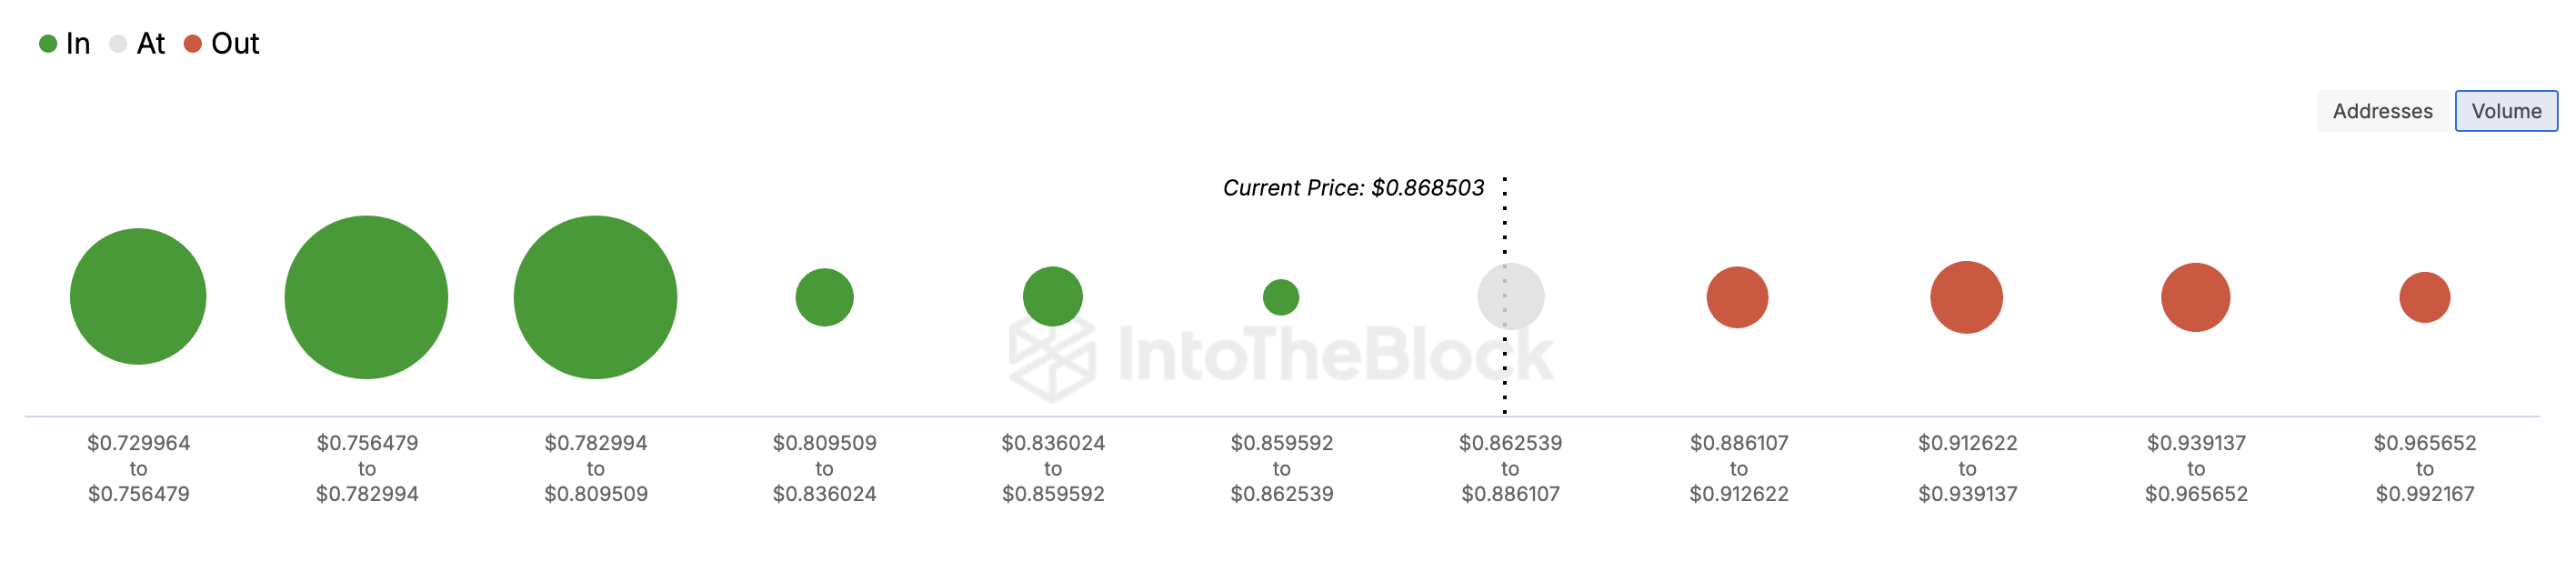
Currently, ADA’s IOMAP shows strong support levels outweighing resistance zones, reinforcing the potential for its price to climb further.
ADA Price Prediction: Move Toward $1 Almost Valid
On the daily chart, ADA’s price has risen above the key Exponential Moving Averages (EMAs). Specifically, the 20-day EMA (blue) and 50 EMA (yellow) are below Cardano’s price. When the price is above the indicator, the trend is bullish.
On the other hand, if the price is below the indicator, the trend is bearish. Therefore, it appears that, with the current trend, ADA could rise higher than $0.87. If this happens, the altcoin might rally toward the $1 mark.
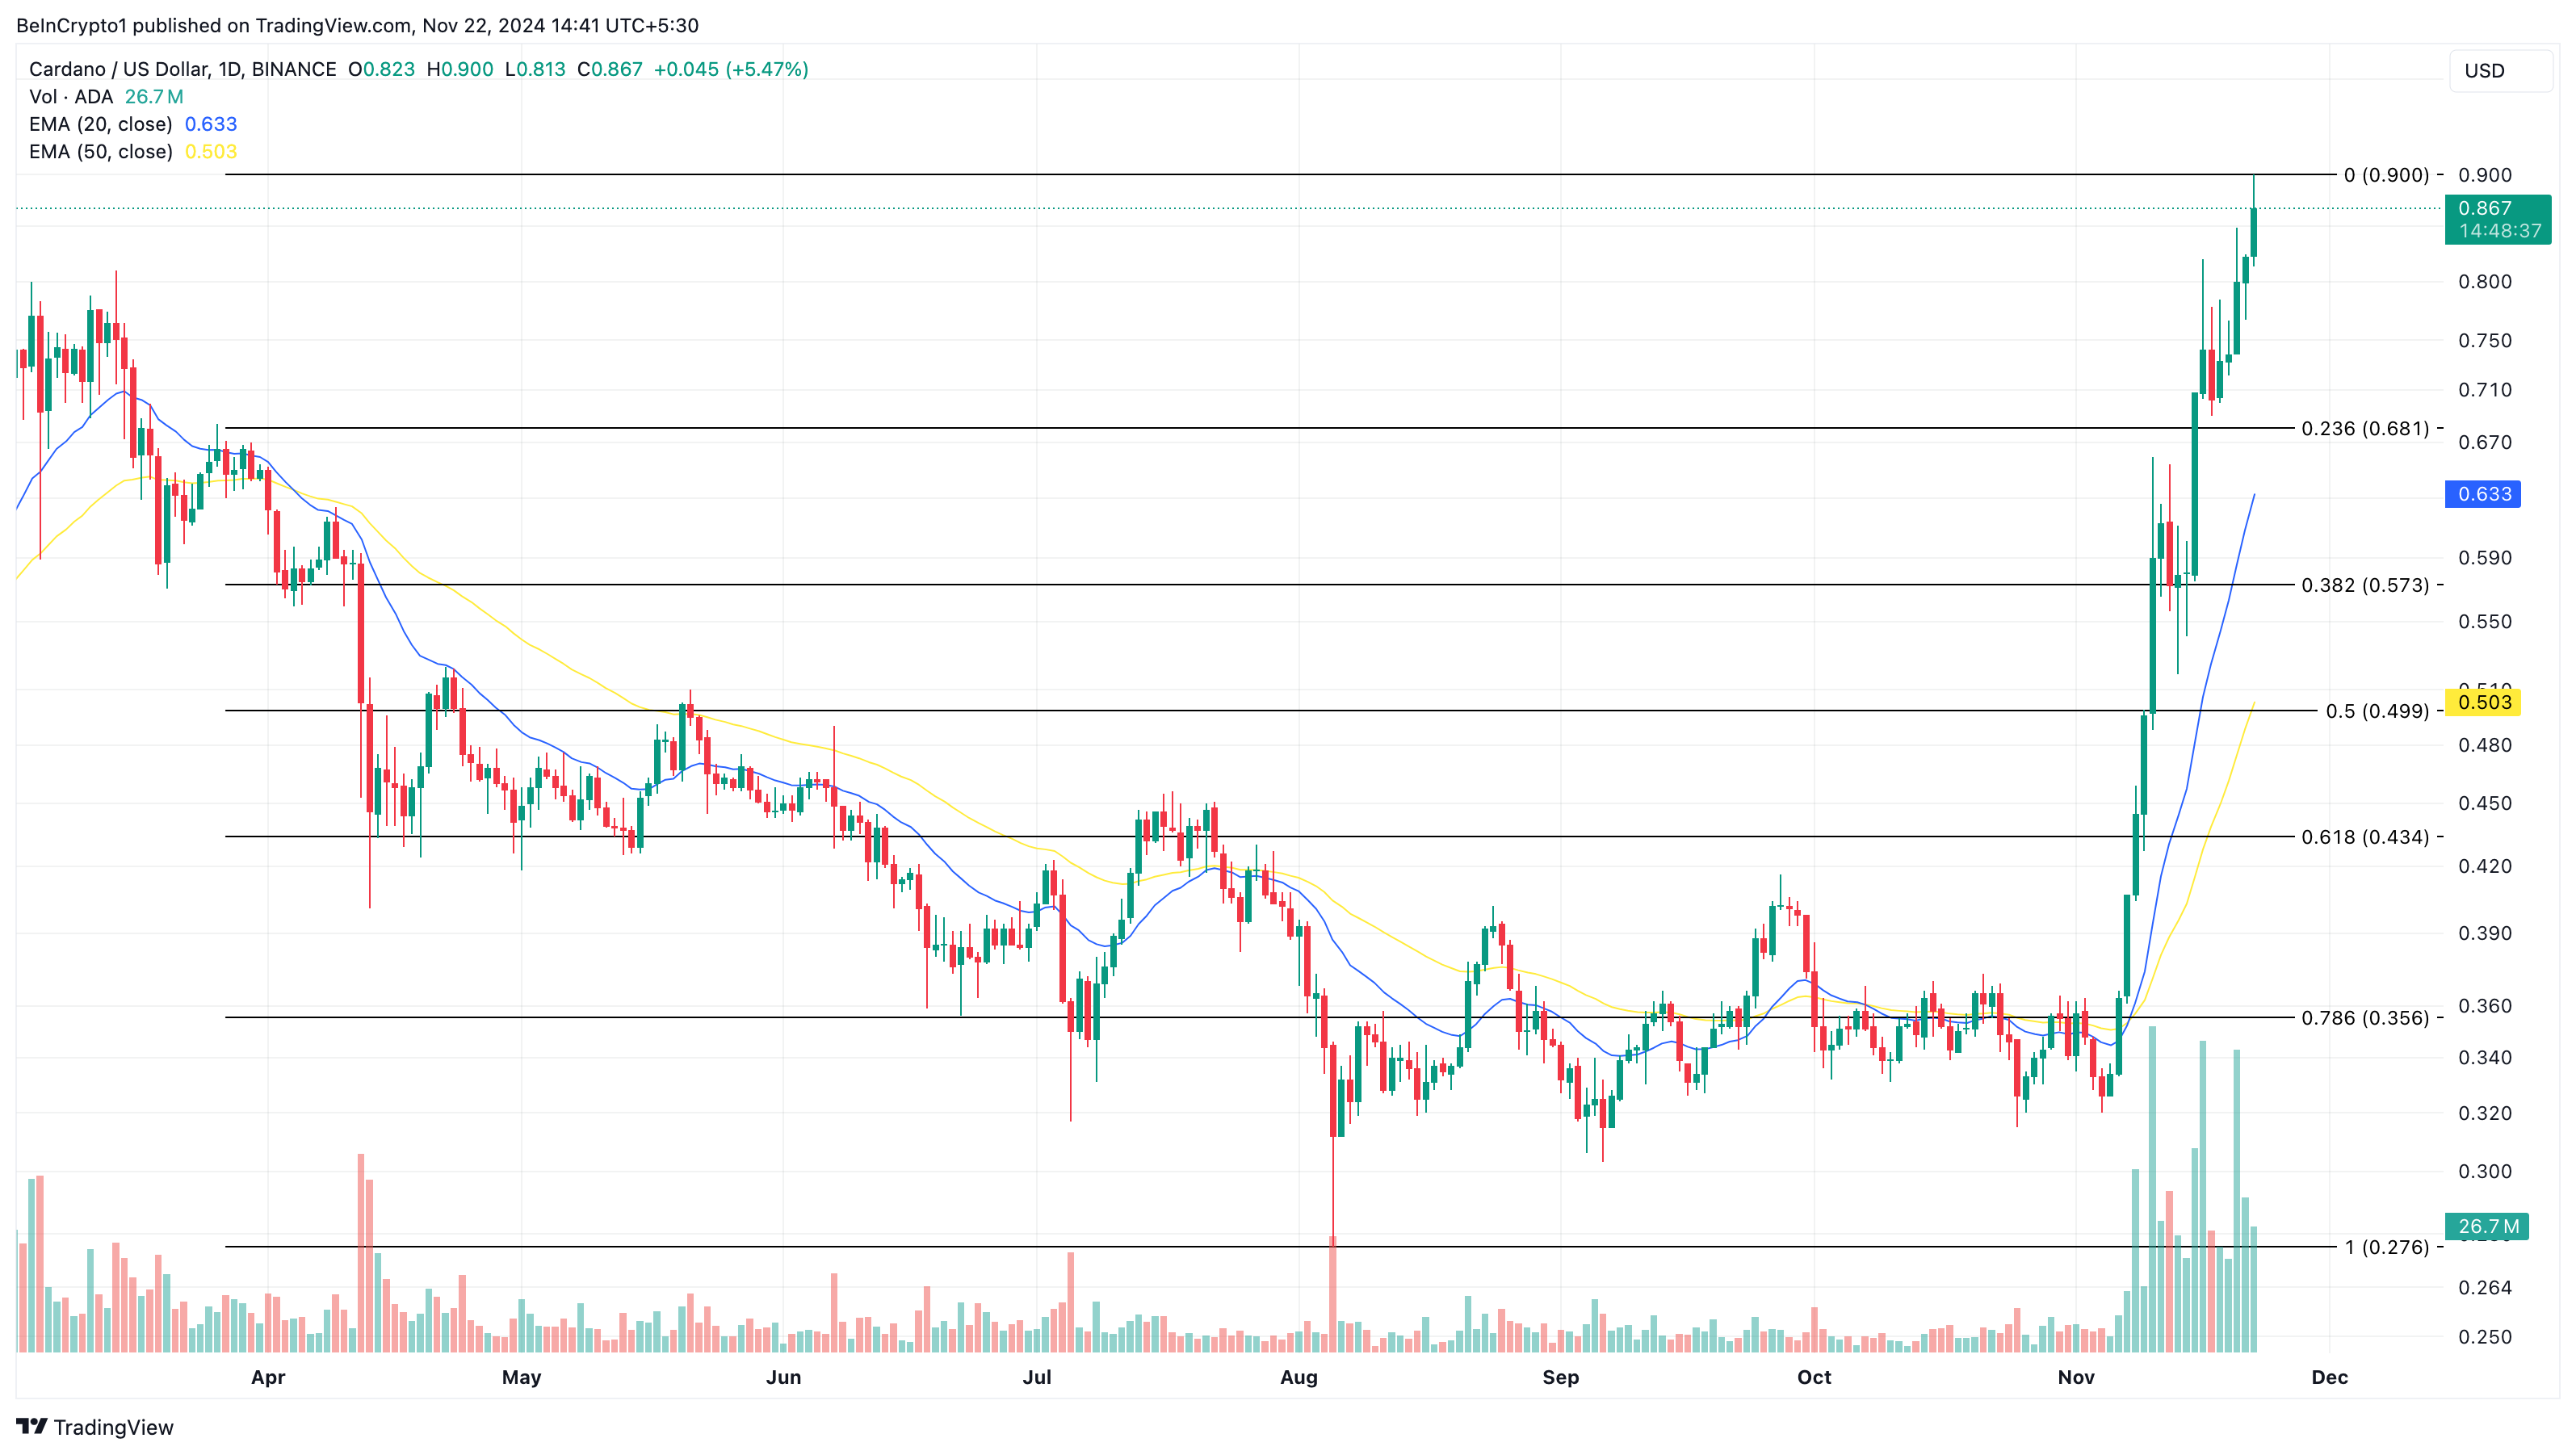
However, if Cardano whales decide to sell and book profits, this prediction might not come to pass. Instead, the price could drop to $0.68.
Disclaimer
In line with the Trust Project guidelines, this price analysis article is for informational purposes only and should not be considered financial or investment advice. BeInCrypto is committed to accurate, unbiased reporting, but market conditions are subject to change without notice. Always conduct your own research and consult with a professional before making any financial decisions. Please note that our Terms and Conditions, Privacy Policy, and Disclaimers have been updated.

Bitcoin price is rising steadily above the $95,000 zone. BTC is showing positive signs and might soon hit the $100,000 milestone level.
- Bitcoin started a fresh increase above the $95,000 zone.
- The price is trading above $95,000 and the 100 hourly Simple moving average.
- There is a key bullish trend line forming with support at $95,200 on the hourly chart of the BTC/USD pair (data feed from Kraken).
- The pair could continue to rise if it clears the $100,000 resistance zone.
Bitcoin Price Sets Another ATH
Bitcoin price remained supported above the $92,000 level. BTC formed a base and started a fresh increase above the $95,000 level. It cleared the $96,500 level and traded to a new high at $98,999 before there was a pullback.
There was a move below the $98,000 level. However, the price remained stable above the 23.6% Fib retracement level of the upward move from the $91,500 swing low to the $98,990 high. There is also a key bullish trend line forming with support at $95,200 on the hourly chart of the BTC/USD pair.
The trend line is close to the 50% Fib retracement level of the upward move from the $91,500 swing low to the $98,990 high. Bitcoin price is now trading above $96,000 and the 100 hourly Simple moving average.
On the upside, the price could face resistance near the $98,880 level. The first key resistance is near the $99,000 level. A clear move above the $99,000 resistance might send the price higher. The next key resistance could be $100,000.

A close above the $100,000 resistance might initiate more gains. In the stated case, the price could rise and test the $102,000 resistance level. Any more gains might send the price toward the $104,500 resistance level.
Downside Correction In BTC?
If Bitcoin fails to rise above the $100,000 resistance zone, it could start a downside correction. Immediate support on the downside is near the $98,000 level.
The first major support is near the $96,800 level. The next support is now near the $95,500 zone and the trend line. Any more losses might send the price toward the $92,000 support in the near term.
Technical indicators:
Hourly MACD – The MACD is now gaining pace in the bullish zone.
Hourly RSI (Relative Strength Index) – The RSI for BTC/USD is now above the 50 level.
Major Support Levels – $96,800, followed by $95,500.
Major Resistance Levels – $99,000, and $100,000.
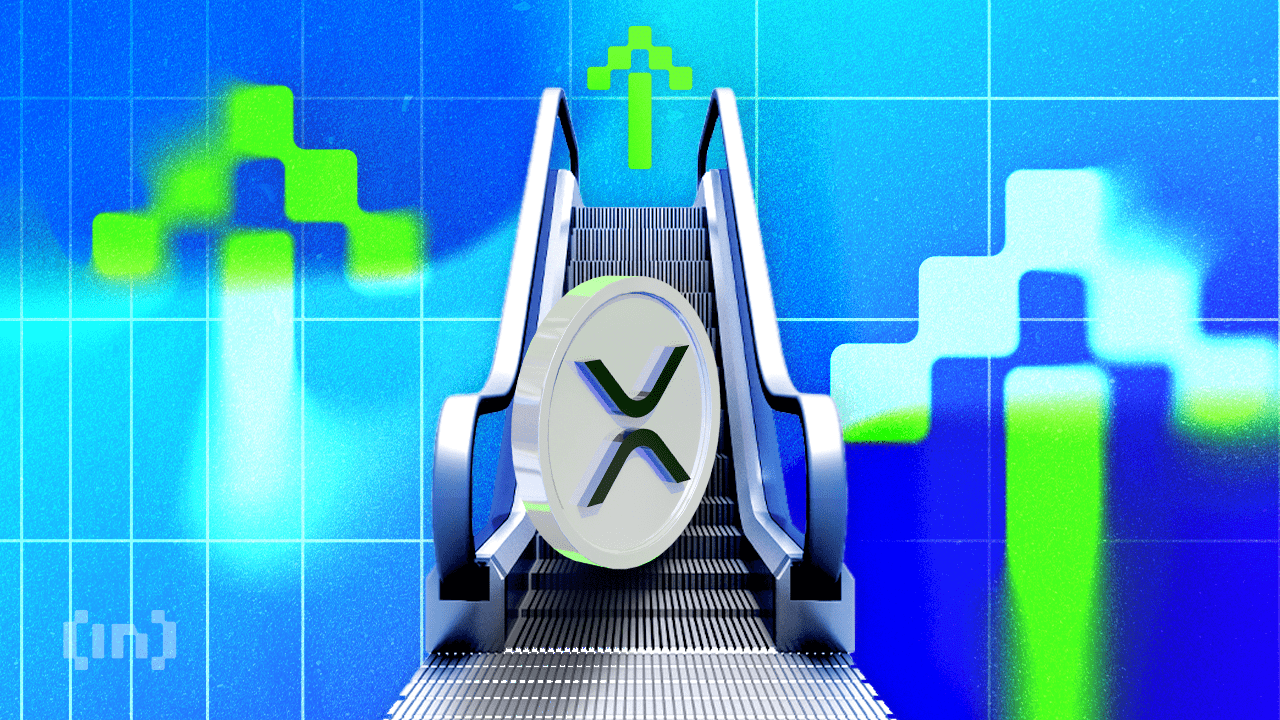
Ripple’s (XRP) price rallied by 25% in the last 24 hours following Gary Gensler’s announcement that he would resign as the US Securities and Exchange Commission (SEC) chair on January 20, 2025.
This development comes as a relief to the popular “XRP Army,” which has had to deal with suppressed price action due to the Gensler-led SEC’s nonstop petitions against Ripple. But that is not all that happened.
Ripple Bears Face Notable Liquidation Following Gensler’s Notification
Gensler’s announcement appears to be a positive development for the broader crypto market. But XRP holders seemed to benefit the most. This was particularly significant given the unresolved Ripple-SEC legal issues that have persisted throughout the SEC Chair’s tenure.
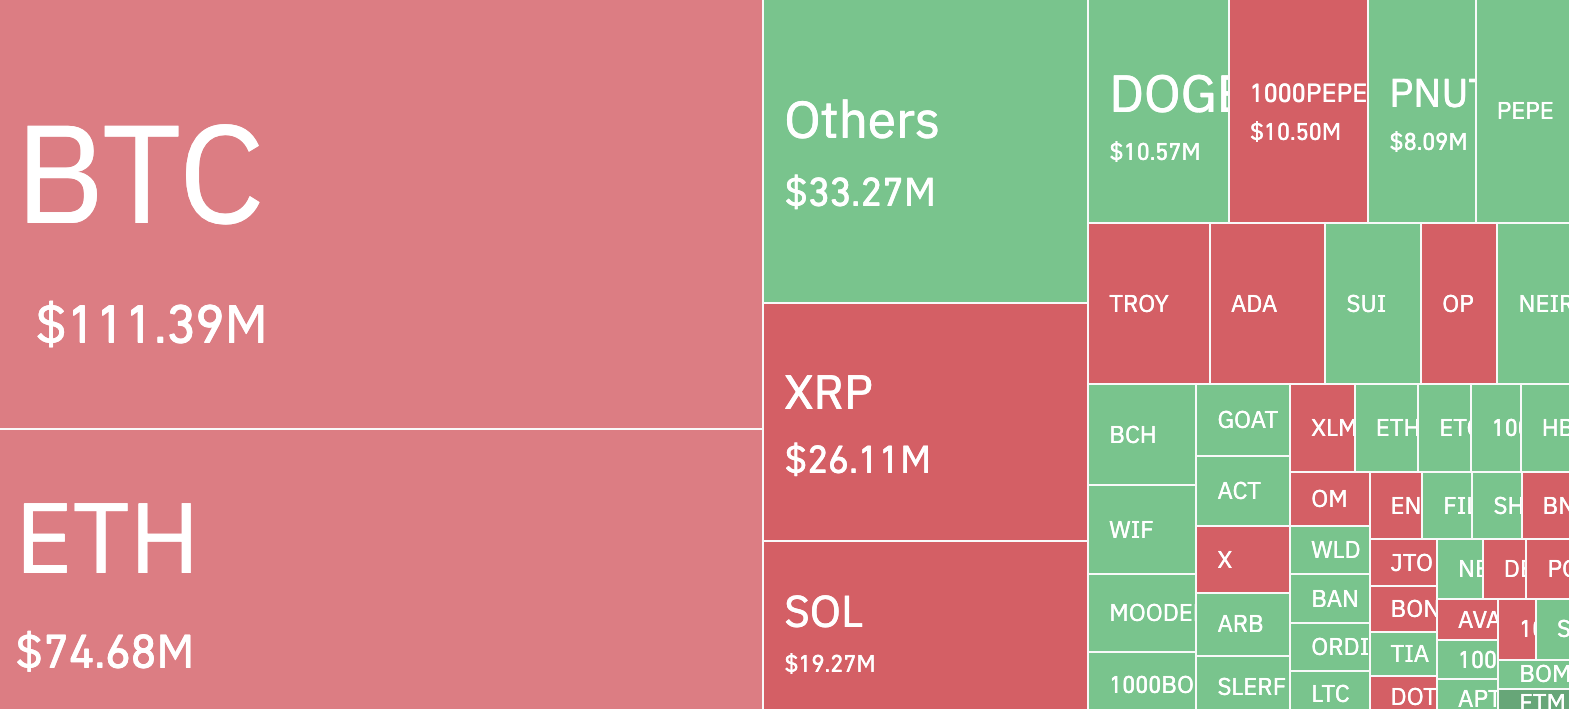
As a result, it came as no surprise that XRP price rallied and outpaced those of any other cryptocurrency in the top 10. Furthermore, the development triggered liquidations totaling $26.11 million over the last 24 hours.
Liquidation occurs when a trader fails to meet the margin requirements for a leveraged position. This forces the exchange to sell off their assets to prevent further losses. In XRP’s case, the liquidation primarily resulted in a short squeeze.
A short squeeze happens when a large number of short positions (traders betting on price declines) are forced to close, driving the price higher as they rush back to buy back the asset.
At press time, XRP trades at $1.40 and currently has a market cap of $80.64 billion. With Gensler almost gone, crypto lawyer John Deaton noted that XRP price gains could be higher, and the market cap could climb to $100 billion.
“XRP soon will achieve a $100B market cap. Times are changing,” Deaton wrote on X.
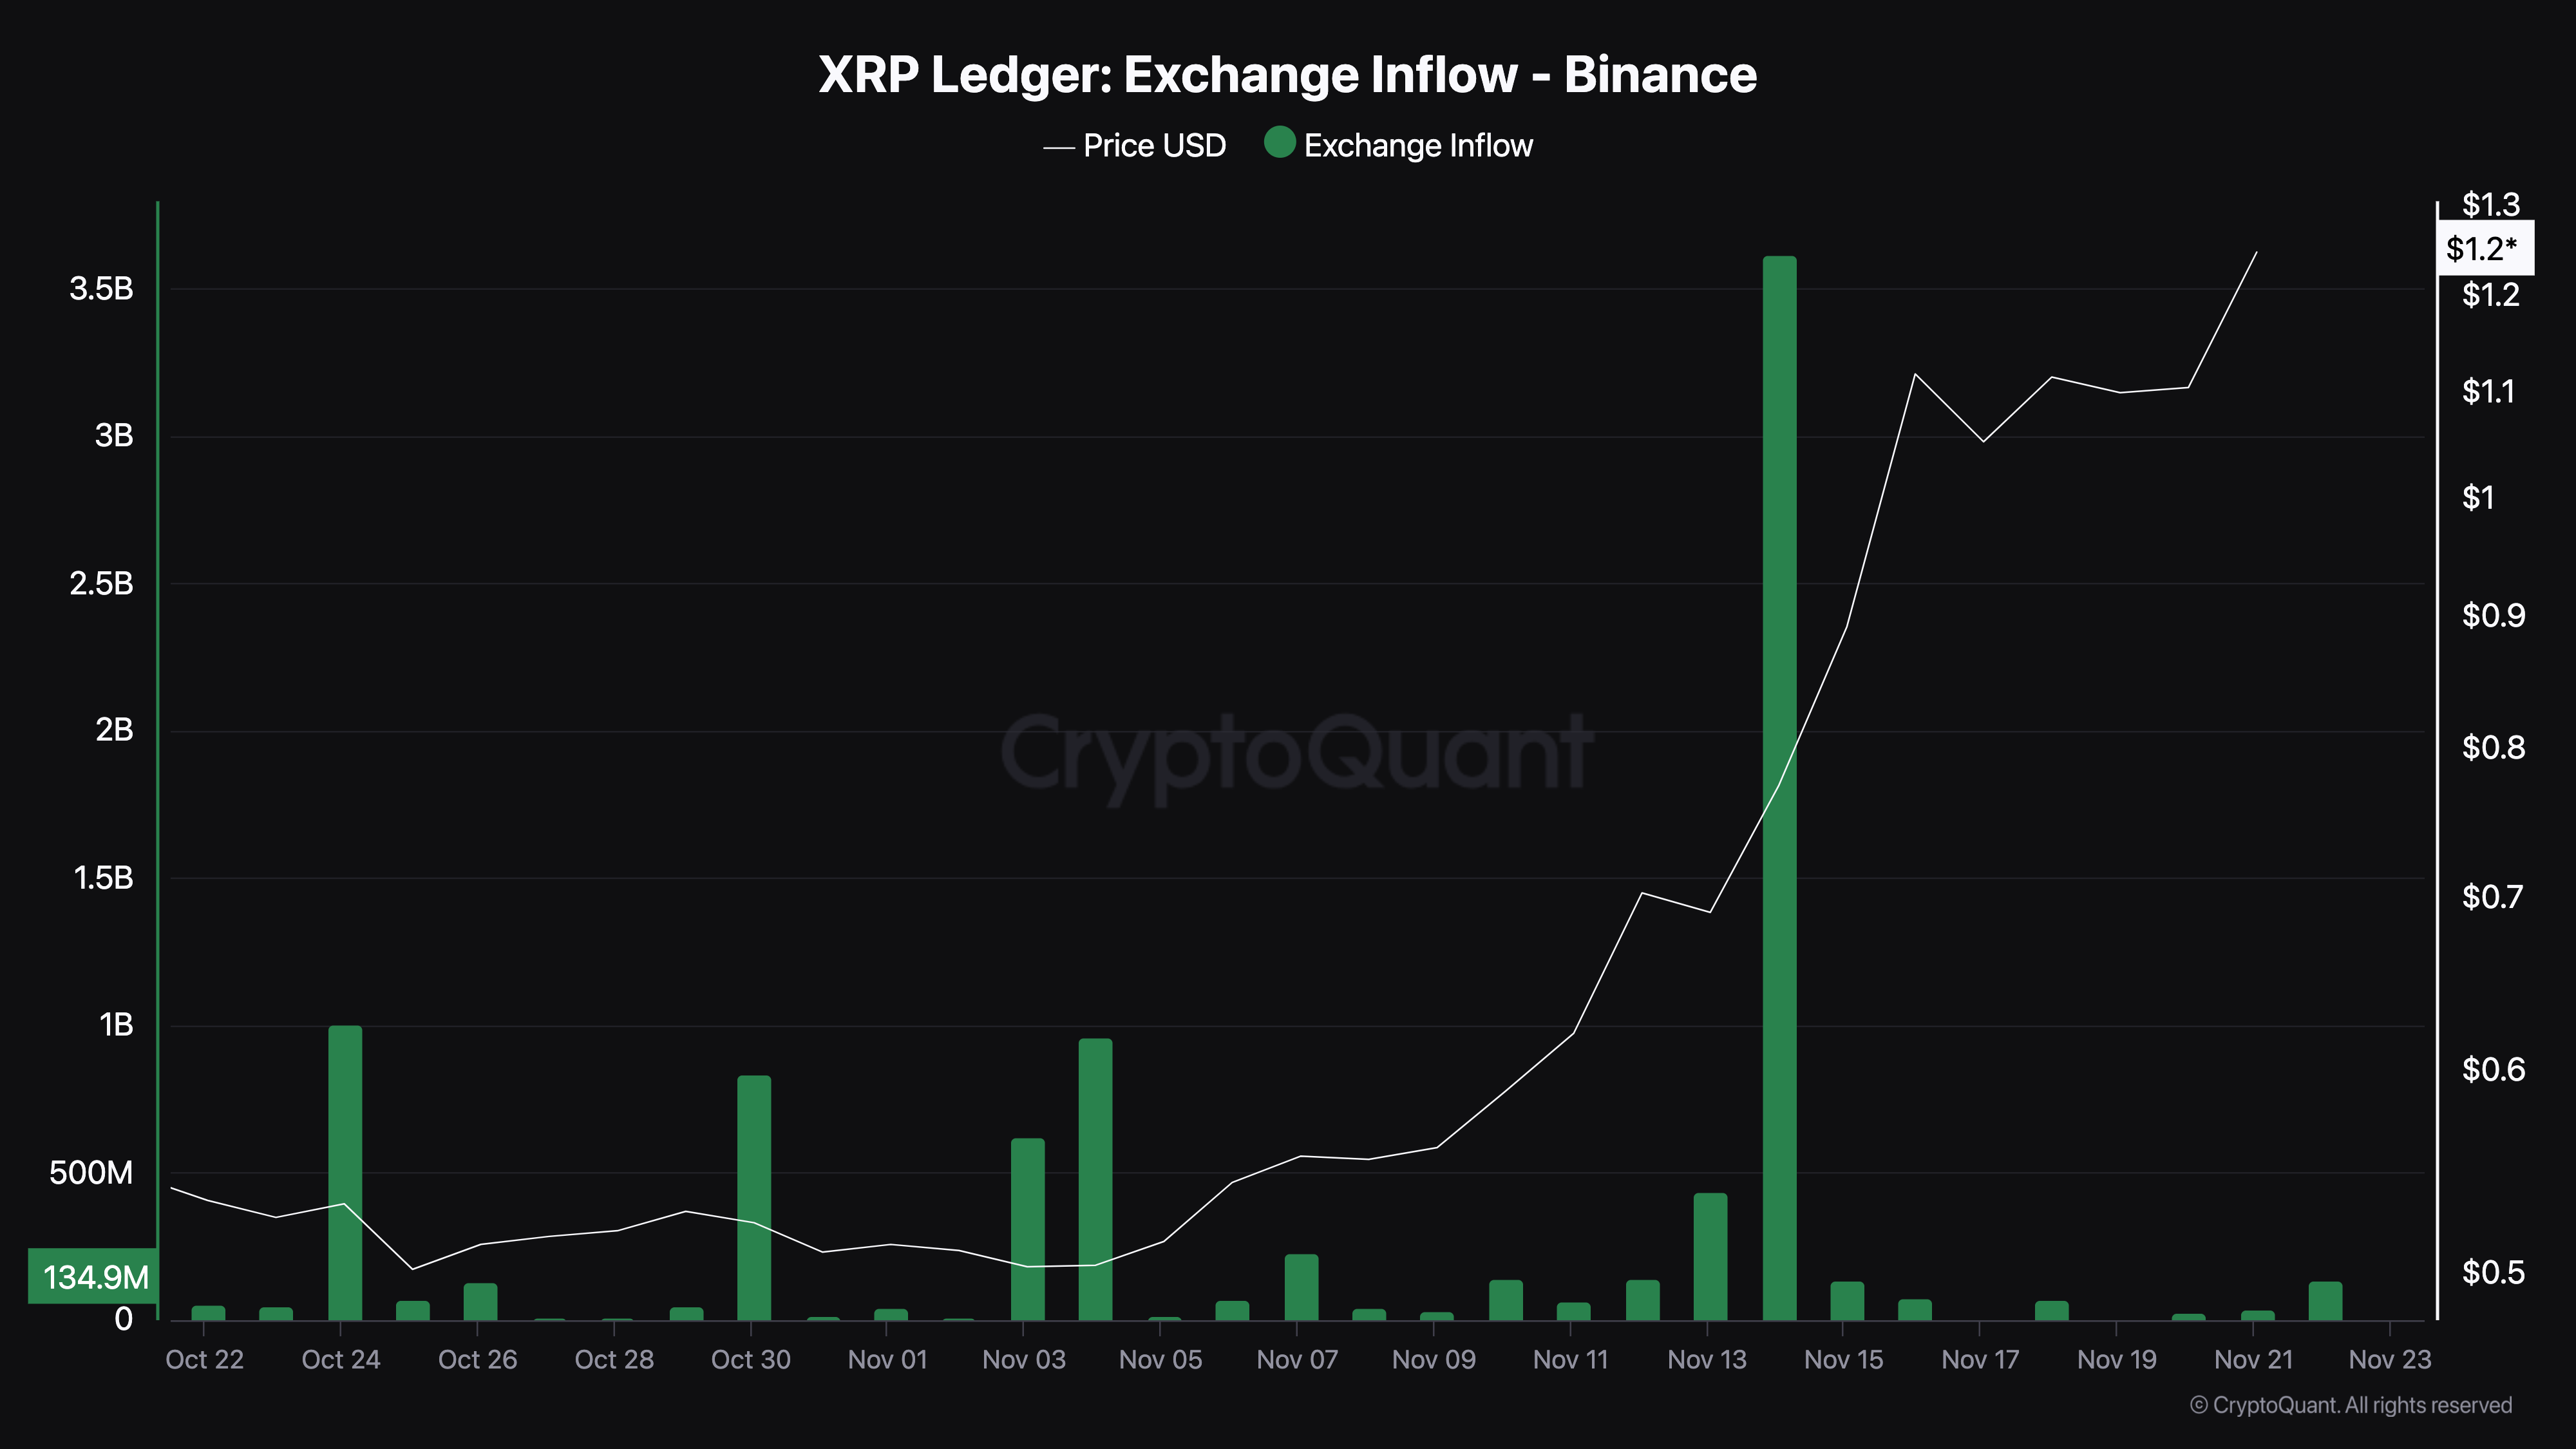
Meanwhile, CryptoQuant data shows that the total number of XRP sent into exchange has significantly decreased. Typically, high values indicate increased selling pressure in the spot market. This is because it suggests that more assets are being offloaded, potentially driving prices lower.
However, since it is low, XRP holders are refraining from selling. If this remains the case, the token’s value could rise higher than $1.40.
XRP Price Prediction: $2 Coming?
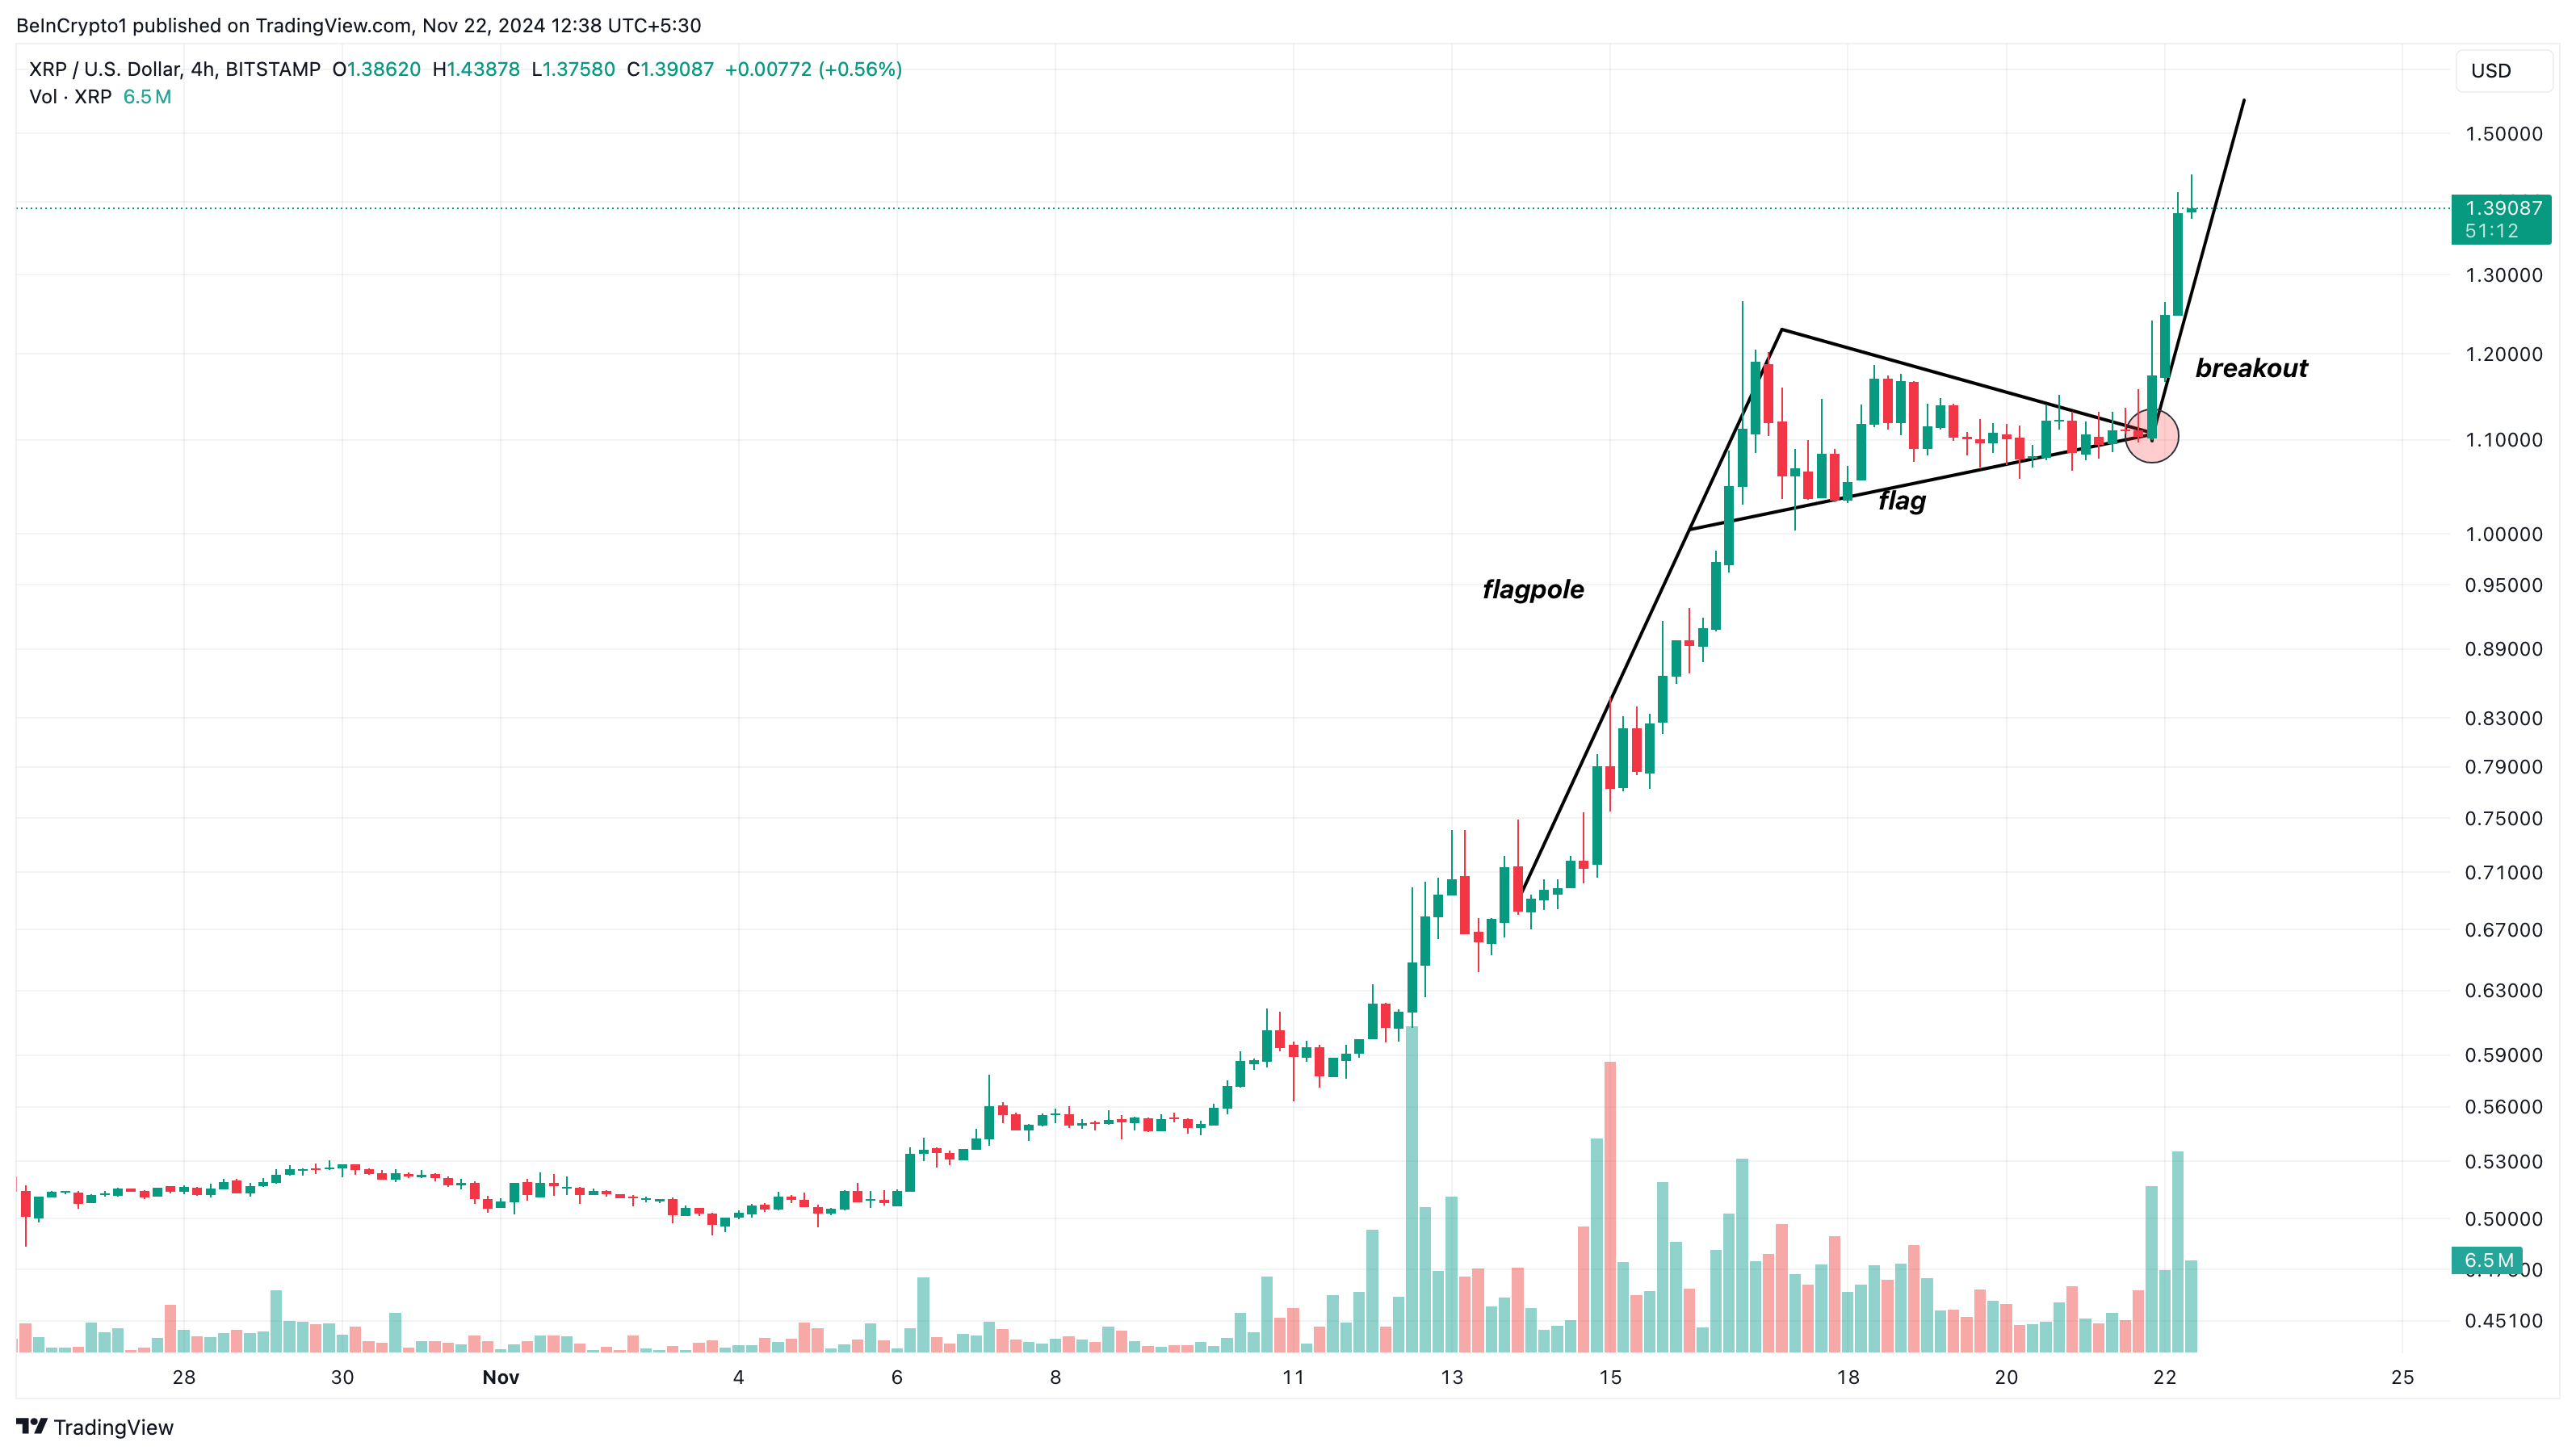
According to the 4-hour chart, XRP has been trading within a range of $1.04 to $1.17 since November 18. This sideways movement has resulted in the formation of a bull flag — a bullish chart pattern that signals potential upward momentum.
The bull flag begins with a sharp price surge, forming the flagpole, driven by significant buying pressure that outpaces sellers. This is followed by a consolidation phase, where the price retraces slightly and moves within parallel trendlines, creating the flag structure.
Yesterday, XRP broke out of this pattern, signaling that bulls have seized control of the market. If this momentum persists, XRP’s price could surpass $1.50, potentially approaching the $2 threshold.
However, this bullish scenario hinges on market behavior. If holders decide to secure profits, selling pressure could push XRP’s price below $1, erasing recent gains.
Disclaimer
In line with the Trust Project guidelines, this price analysis article is for informational purposes only and should not be considered financial or investment advice. BeInCrypto is committed to accurate, unbiased reporting, but market conditions are subject to change without notice. Always conduct your own research and consult with a professional before making any financial decisions. Please note that our Terms and Conditions, Privacy Policy, and Disclaimers have been updated.

Cardano Whales Accumulation Hits $55 Million: $1 Target Soon?

Ethereum Attempts Key Breakout: Analysts Set $3,700 Target

Bitcoin Price Approaches $100K: The Countdown Is On
Top Neiro Ethereum Holder Dumps $3M NEIRO Sparking Price Dip Concerns

This Is Why XRP Price Rallied By 25% and Could Soon Hit $2

Hidden Bullish Divergence Appears On Dogecoin Price Chart, Here’s What To Expect Next

2.52 Million Altcoins Are Ruining Crypto’s Future

Animoca Brands Valuation Tanks 75% In Two Years, Here’s Why

Crypto exchange BingX hacked for $43 million

Are The Big Players Losing Interest?

Hong Kong’s Securities Association Tips Authorities On Crypto Self-Regulation

Coinbase cbBTC Set to go Live on Solana
2.52 Million Altcoins Are Ruining Crypto’s Future
Animoca Brands Valuation Tanks 75% In Two Years, Here’s Why
Crypto exchange BingX hacked for $43 million
Are The Big Players Losing Interest?
Hong Kong’s Securities Association Tips Authorities On Crypto Self-Regulation
Coinbase cbBTC Set to go Live on Solana
-
 Altcoin22 hours ago
Dogecoin Whale Accumulation Sparks Optimism, DOGE To Rally 9000% Ahead?
-

 Bitcoin20 hours ago
Marathon Digital Raises $1B to Expand Bitcoin Holdings
-

 Regulation15 hours ago
UK to unveil crypto and stablecoin regulatory framework early next year
-
 Market20 hours ago
ETH/BTC Ratio Plummets to 42-Month Low Amid Bitcoin Surge
-
 Altcoin23 hours ago
Sui Network Back Online After 2-Hour Outage, Price Slips
-

 Ethereum18 hours ago
Analyst Reveals When The Ethereum Price Will Reach A New ATH, It’s Closer Than You Think
-

 Market17 hours ago
Why SUI Network Outage Did Not Cause a Price Crash
-
 Market21 hours ago
Bitcoin Cash (BCH) Price Up, Leads Daily Gains