
Market
Analyst Says God Candle Will Send Price To $57
Crypto analyst Amonyx has laid an ultra bullish price prediction for the XRP price, predicting that the crypto token could reach double digits at some point. This comes amid XRP’s continued underperformance despite the conclusion of the case between Ripple and the US Securities and Exchange Commission (SEC).
Massive God Candle To Send XRP Price To $57
Crypto analyst Amonyx mentioned in an X (formerly Twitter) post that a massive God candle was loading, which would send XRP’s price to $57. Based on the chart that the analyst shared, the crypto token will rise to this price level sometime next year, possibly at the peak of this market cycle.
Related Reading
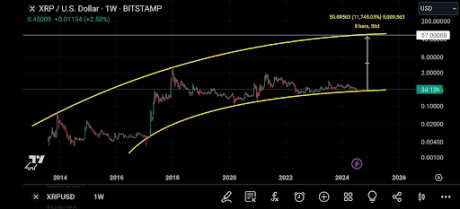
The analyst failed to provide insights into what could cause XRP to reach such an ambitious price target. However, a more recent X post from the analysts suggests that the analyst believes that the potential launch of a Spot XRP ETF could allow the crypto token to reach such unprecedented heights.
A Spot XRP ETF is a catalyst that other crypto analysts, like Common Sense Crypto, have also alluded to explain why XRP’s price could even reach three digits. An XRP ETF will undoubtedly cause new money to flow into the XRP ecosystem, leading to a price surge. However, it remains uncertain that such a fund can push XRP to such lofty heights.
The likelihood of a Spot XRP ETF launching looks higher following the recent conclusion of the case between Ripple and the SEC. However, members of the XRP community will likely be cautious about getting their hopes too high about the launch of such a fund and the impact it could have on XRP’s price, especially having seen how the crypto token has performed since the lawsuit ended.
The conclusion of the case between Ripple and the SEC was projected to be a catalyst that could send XRP to as high as $1 in the short term. However, XRP has shown no signs of reaching that price mark anytime soon, as it failed to break above the $0.6 resistance even after Judge Analisa Torres’ recent ruling.
XRP’s Bullish Breakout Will Send Price To $263
Crypto analyst Javon Marks has offered a more bullish price prediction for XRP, stating that a bullish breakout could send the crypto token to $263 based on the Full Logarithmic Follow-Through indicator.
Related Reading
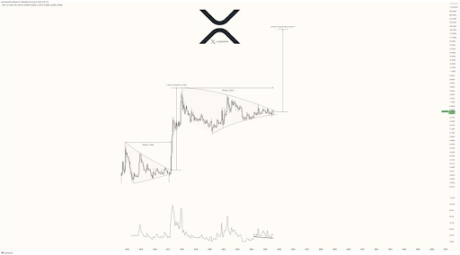
The analyst added that this bullish breakout is more than possible, noting that XRP is nearing the converging point of a near “7-year consolidation/pattern development.” He added that the crypto token has also displayed multiple bullish signals, suggesting that this bullish breakout could happen at some point.
At the time of writing, XRP is trading at around $0.56, down over 2% in the last 24 hours, according to data from CoinMarketCap.
Featured image created with Dall.E, chart from Tradingview.com


Dogecoin is consolidating gains above the $0.380 resistance against the US Dollar. DOGE is holding gains and eyeing more upsides above $0.400.
- DOGE price started a fresh increase above the $0.3750 resistance level.
- The price is trading above the $0.3800 level and the 100-hourly simple moving average.
- There was a break above a short-term contracting triangle with resistance at $0.390 on the hourly chart of the DOGE/USD pair (data source from Kraken).
- The price could continue to rally if it clears the $0.400 and $0.4080 resistance levels.
Dogecoin Price Eyes More Upsides
Dogecoin price remained supported above the $0.350 level and recently started a fresh increase like Bitcoin and Ethereum. DOGE was able to clear the $0.3650 and $0.3750 resistance levels.
The price climbed above the 50% Fib retracement level of the downward move from the $0.4208 swing high to the $0.3652 low. Besides, there was a break above a short-term contracting triangle with resistance at $0.390 on the hourly chart of the DOGE/USD pair.
Dogecoin price is now trading above the $0.3750 level and the 100-hourly simple moving average. Immediate resistance on the upside is near the $0.3950 level or the 61.8% Fib retracement level of the downward move from the $0.4208 swing high to the $0.3652 low.

The first major resistance for the bulls could be near the $0.400 level. The next major resistance is near the $0.4080 level. A close above the $0.4080 resistance might send the price toward the $0.4200 resistance. Any more gains might send the price toward the $0.4500 level. The next major stop for the bulls might be $0.500.
Are Dips Supported In DOGE?
If DOGE’s price fails to climb above the $0.400 level, it could start a downside correction. Initial support on the downside is near the $0.3850 level. The next major support is near the $0.3750 level.
The main support sits at $0.3550. If there is a downside break below the $0.3550 support, the price could decline further. In the stated case, the price might decline toward the $0.3200 level or even $0.300 in the near term.
Technical Indicators
Hourly MACD – The MACD for DOGE/USD is now gaining momentum in the bullish zone.
Hourly RSI (Relative Strength Index) – The RSI for DOGE/USD is now above the 50 level.
Major Support Levels – $0.3850 and $0.3750.
Major Resistance Levels – $0.4000 and $0.4200.
On Friday, Solana (SOL) soared to a new all-time high (ATH), now trading at approximately $261. This breakthrough surpasses its previous peak set in November 2021.
Solana’s rise to a new ATH marks an increase of over 32 times from its lows recorded in December 2022.
Solana Hits All-Time High as Gary Gensler Plans Resignation
Solana’s path to this new high has been anything but smooth. After reaching its previous high in 2021, the platform faced a downturn in 2022 amid a broader crypto bear market, further exacerbated by technical issues and network downtimes.
The collapse of FTX in November 2022 pushed Solana’s price down to around $8.

However, Solana has since made a remarkable recovery, increasing more than 32-fold from its low. Now, Solana enthusiasts believe that SOL could eventually outpace Ethereum (ETH) in market capitalization.
“Solana has been at an all-time high by market cap for a while actually. Now, we’re finally in price discovery. The flippening is coming,” Birch, the founder of PathCrypto, said.
The surge in Solana’s market value coincides with the news of SEC Chairman Gary Gensler’s planned resignation, slated for January 20, 2025, as Donald Trump assumes office.
Known for his strict regulatory stance on cryptocurrencies, Gensler’s departure signals a potential shift toward a more crypto-friendly administration. Consequently, this political change is stoking speculations about the approval of a Solana exchange-traded fund (ETF). According to Fox Business journalist Eleanor Terrett, the SEC has begun engaging with issuers to explore the possibility of a Solana ETF.
“Talks between SEC staff and issuers looking to launch a Solana spot ETF are “progressing” with the SEC now engaging on S-1 applications. Recent engagement from staff, coupled with the incoming pro-crypto administration, is sparking a renewed sense of optimism that a Solana ETF could be approved sometime in 2025,” Terrett claimed.
Previous efforts to launch a Solana ETF were stalled by regulatory roadblocks, often stopping early in the process. However, the changing political environment and the SEC’s increased openness have reignited hopes within the crypto community. Recent filings for a Solana ETF by Canary Capital and BitWise reflect a growing interest and anticipation for regulatory approval.
Despite these encouraging developments, the odds of a Solana ETF approval in 2024 remain low, with Polymarket estimates placing it at around 4%.

Meanwhile, the crypto community is also closely watching Bitcoin as it approaches the highly anticipated $100,000 mark. On Friday, Bitcoin recorded a new high of about $99,300. This milestone is viewed as a pivotal moment for Bitcoin and could impact other cryptocurrencies, including Solana.
Disclaimer
In adherence to the Trust Project guidelines, BeInCrypto is committed to unbiased, transparent reporting. This news article aims to provide accurate, timely information. However, readers are advised to verify facts independently and consult with a professional before making any decisions based on this content. Please note that our Terms and Conditions, Privacy Policy, and Disclaimers have been updated.
XRP price rallied above the $1.15 and $1.20 resistance levels. The price is up over 25% and might rise further above the $1.420 resistance.
- XRP price started a fresh surge above the $1.20 resistance level.
- The price is now trading above $1.250 and the 100-hourly Simple Moving Average.
- There was a break above a key bearish trend line with resistance at $1.1400 on the hourly chart of the XRP/USD pair (data source from Kraken).
- The pair is up over 25% and it seems like the bulls are not done yet.
XRP Price Eyes Steady Increase
XRP price formed a base above $1.050 and started a fresh increase. There was a move above the $1.150 and $1.20 resistance levels. It even pumped above the $1.25 level, beating Ethereum and Bitcoin in the past two sessions.
There was also a break above a key bearish trend line with resistance at $1.1400 on the hourly chart of the XRP/USD pair. A high was formed at $1.4161 and the price is now consolidating gains. It is trading above the 23.6% Fib retracement level of the upward move from the $1.0649 swing low to the $1.4161 high.
The price is now trading above $1.30 and the 100-hourly Simple Moving Average. On the upside, the price might face resistance near the $1.400 level. The first major resistance is near the $1.420 level. The next key resistance could be $1.450.

A clear move above the $1.450 resistance might send the price toward the $1.50 resistance. Any more gains might send the price toward the $1.550 resistance or even $1.620 in the near term. The next major hurdle for the bulls might be $1.750 or $1.80.
Are Dips Supported?
If XRP fails to clear the $1.420 resistance zone, it could start a downside correction. Initial support on the downside is near the $1.3350 level. The next major support is near the $1.2850 level.
If there is a downside break and a close below the $1.2850 level, the price might continue to decline toward the $1.240 support or the 50% Fib retracement level of the upward move from the $1.0649 swing low to the $1.4161 high in the near term. The next major support sits near the $1.20 zone.
Technical Indicators
Hourly MACD – The MACD for XRP/USD is now gaining pace in the bearish zone.
Hourly RSI (Relative Strength Index) – The RSI for XRP/USD is now above the 50 level.
Major Support Levels – $1.3350 and $1.2850.
Major Resistance Levels – $1.4000 and $1.4200.

Hidden Bullish Divergence Appears On Dogecoin Price Chart, Here’s What To Expect Next

Dogecoin (DOGE) Shows Renewed Energy: Rally Incoming?

XRP Price Rally to $2 As Paul Atkins Leads to Replace US SEC Chair Gary Gensler

Solana Hits New All-Time High After 3 Years

Bitcoin’s Put-to-Call Ratio Tops 1.0: Bearish Signs Ahead?
Solana Hits New ATH On Huge Whale Accumulation, More Gains Ahead?

2.52 Million Altcoins Are Ruining Crypto’s Future

Animoca Brands Valuation Tanks 75% In Two Years, Here’s Why

Crypto exchange BingX hacked for $43 million

Are The Big Players Losing Interest?

Hong Kong’s Securities Association Tips Authorities On Crypto Self-Regulation

Coinbase cbBTC Set to go Live on Solana
2.52 Million Altcoins Are Ruining Crypto’s Future
Animoca Brands Valuation Tanks 75% In Two Years, Here’s Why
Crypto exchange BingX hacked for $43 million
Are The Big Players Losing Interest?
Hong Kong’s Securities Association Tips Authorities On Crypto Self-Regulation
Coinbase cbBTC Set to go Live on Solana
-

 Market22 hours ago
South Korea Unveils North Korea’s Role in Upbit Hack
-
 Altcoin24 hours ago
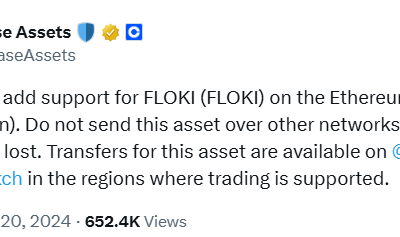
Why FLOKI Price Hits 6-Month Peak With 5% Surge?
-

 Bitcoin17 hours ago
Marathon Digital Raises $1B to Expand Bitcoin Holdings
-

 Regulation11 hours ago
UK to unveil crypto and stablecoin regulatory framework early next year
-
 Market17 hours ago
ETH/BTC Ratio Plummets to 42-Month Low Amid Bitcoin Surge
-

 Market16 hours ago
SEC Moves Toward Solana ETF Approval Amid Pro-Crypto Shift
-
 Altcoin20 hours ago
Sui Network Back Online After 2-Hour Outage, Price Slips
-
 Altcoin19 hours ago
Dogecoin Whale Accumulation Sparks Optimism, DOGE To Rally 9000% Ahead?