
Market
A Distant Threat or Imminent Reality?

On average, a crypto bear market lasts about a year, sometimes extending to two. This phase occurs when supply surpasses demand, causing prices to decline over an extended period.
One of the most severe bear markets unfolded in 2022. During this time, FTX, one of the largest crypto exchanges by trading volume, collapsed following a massive bank run. The downfall triggered a ripple effect, leading to the collapse of several hedge funds and lending protocols, marking a significant low point for the industry.
Bear Market Psychology Explained
Recently, there’s been talk about the crypto market heading back into a bear phase. Many cryptocurrencies have struggled since Bitcoin (BTC) hit $73,750 in March. The decline has raised concerns that the market might be entering another long period of falling prices.
The event, which surprisingly happened before the halving, sent shockwaves around the market. At that time, many suggested that crypto prices would hit higher highs.
However, this has not been the case. Instead, BTC’s price, alongside other cryptocurrencies, has either been consolidating, falling, or involved in false breakouts.
These factors, among others, have led some participants to suggest that the market might be heading into a bear phase. To evaluate this possibility, BeInCrypto examines the market cycle psychology chart for insights.
Read more: How To Make Money in a Bear Market
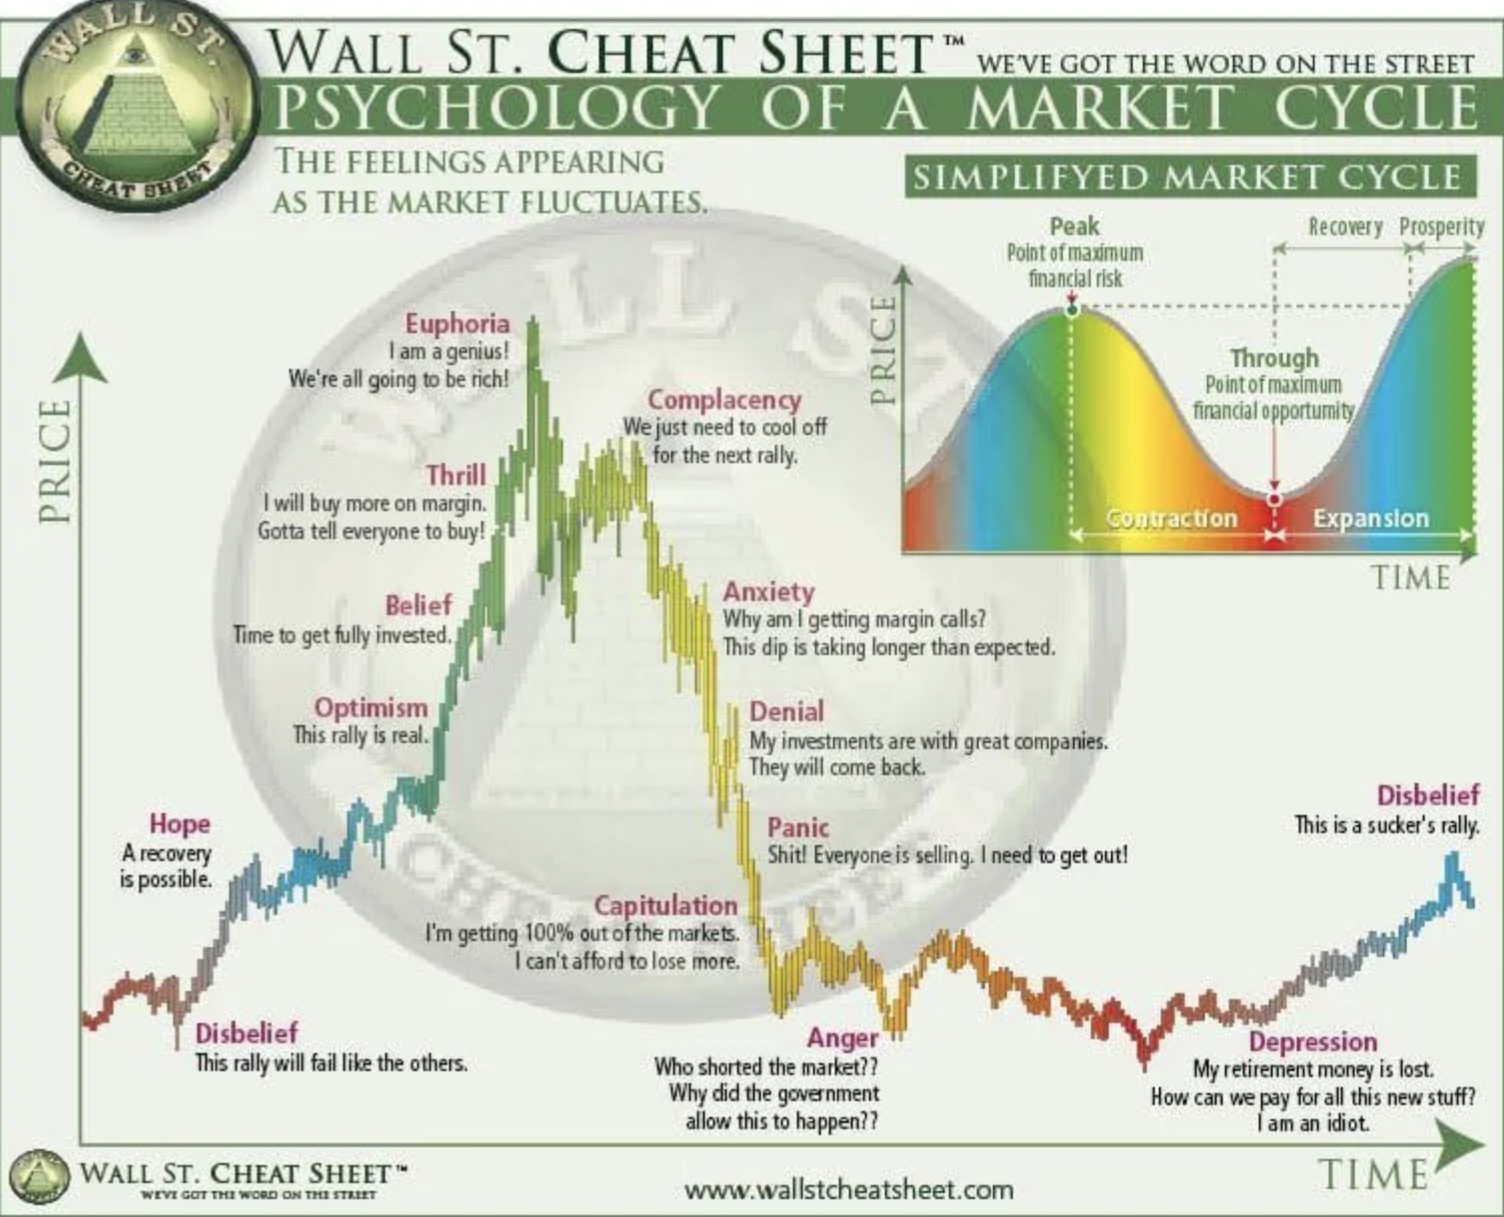
As seen above, this chart shows 14 different stages. For instance, the disbelief marks the end of the bear market when cryptos begin to move into the bull phase. There are also phases of thrill, anxiety, euphoria, or complacency.
From the look of things, the disbelief stage happened around the first quarter of 2023, when the Bitcoin price began to post gains consistently. Meanwhile, the “Thrill” period probably happened during the ETF approval earlier in January this year, as there were calls for people to double down on buying BTC.
Euphoria probably occurred in between March when BTC and many other altcoins and meme coins reached different heights. The cool-off in recent times may suggest that this cycle is between complacency and anxiety, which usually precedes a bear market.
Bitcoin Holders Say a Big No to the Downturn Despite ETH Issues
However, the periods of complacency and anxiety may have been false alarms. According to Glassnode, the Bitcoin Long-Term Holder Sell-side Risk Ratio offers a clue. This metric measures the level of profit-taking compared to past market cycles.
Currently, the ratio remains below the peak seen during the 2021 bull market, indicating that long-term Bitcoin holders are refraining from selling.
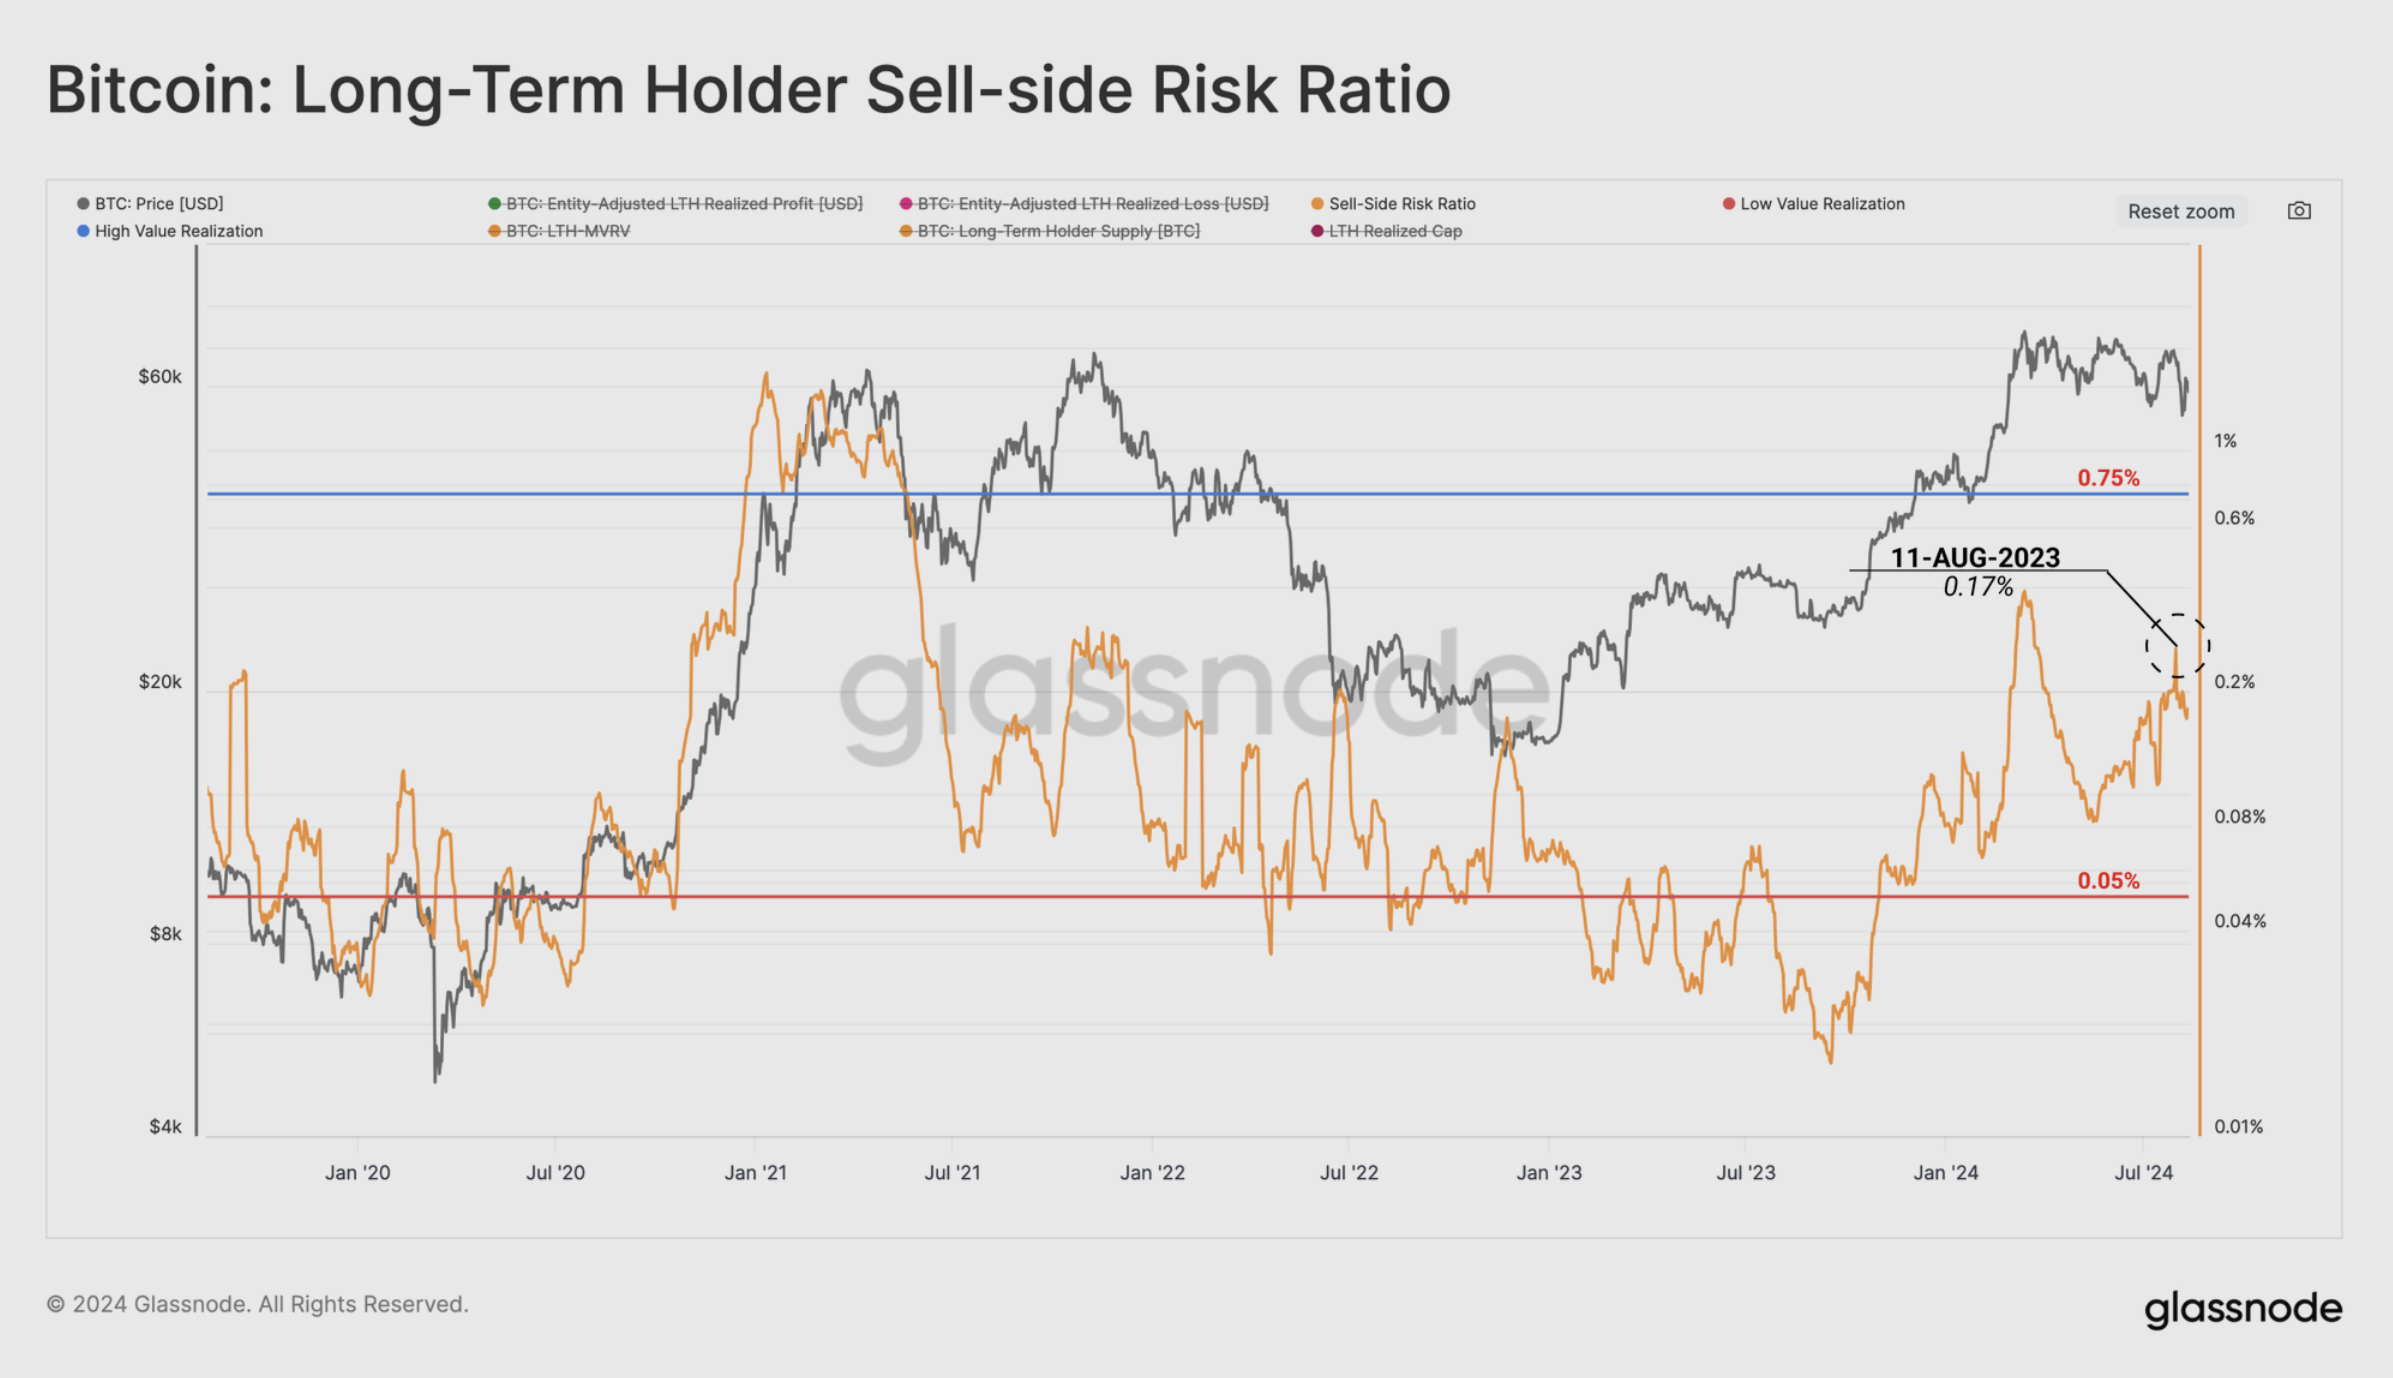
Actions like this suggest high conviction among long-term holders. With respect to this, the on-chain analytic platform explains that:
“An elevated percentage of Bitcoin network wealth is held by this investor cohort relative to previous cycle ATH breaks, which suggests there is a degree of investor patience on display, and waiting for higher prices.”
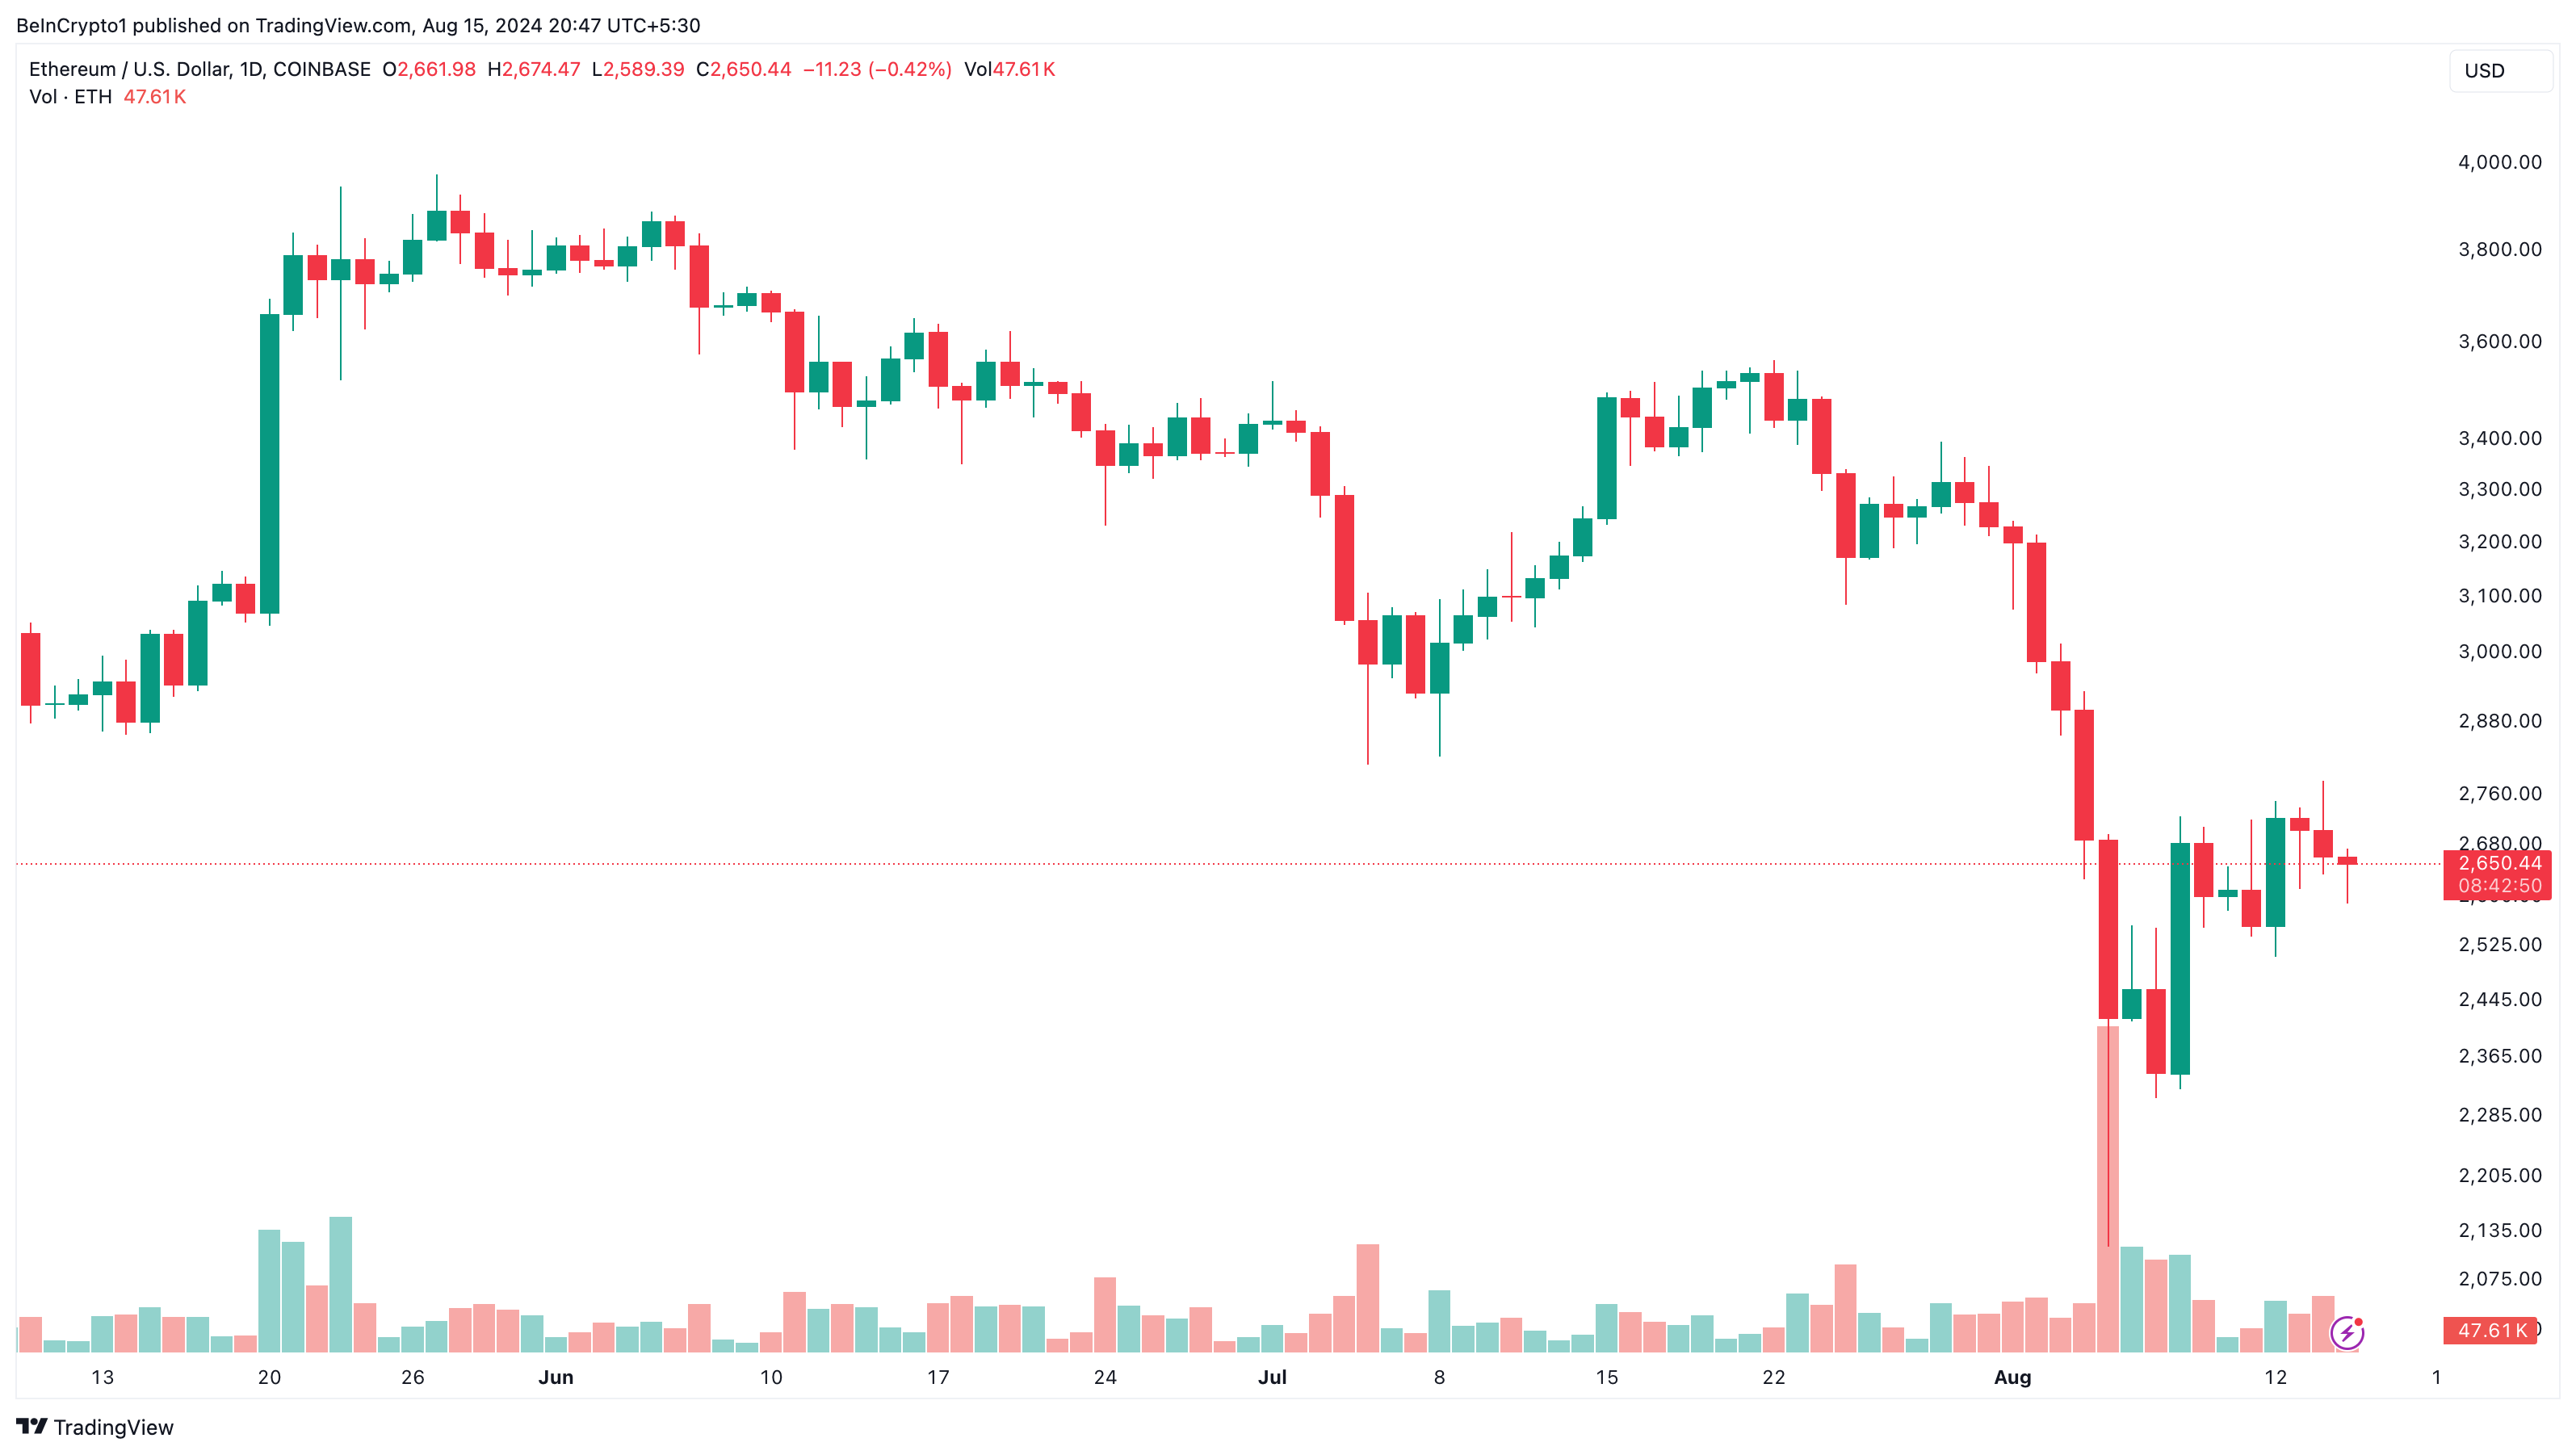
If this holds true, the bear market might not be imminent, and the cycle could still be in its bear phase. However, some market participants remain skeptical due to the underperformance of certain altcoins, particularly Ethereum (ETH).
In 2021, after Bitcoin reached its all-time high (ATH), ETH quickly followed suit and surpassed its previous peak. This time, however, the situation is different, even with the launch of spot Ethereum ETFs.
Currently, ETH trades at $2,657, marking a 45% drop from its ATH. Earlier, many market participants confidently predicted that the altcoin would reach between $8,000 and $10,000, but those expectations have yet to be realized.
Some of those optimistic predictions have faded as ETH continues to underperform, strengthening the belief that a bear market is approaching. However, it’s important to recognize that top cryptocurrencies, including BTC and ETH, recently underwent a period of distribution, which contributed to the recent price correction.
Bears Are Still Lurking for a Crypto Winter
Market participants might also worry that crypto whales have slowed down on buying BTC. However, these pauses are typical during a bull cycle. Despite this, caution is advised, as indicated by the Net Unrealized Profit/Loss (NUPL).
The NUPL measures whether investors are in profit or loss. When the reading increases, it shows that more investors are seeing higher profits. Conversely, a decrease signals declining gains.
This metric also helps determine whether the market has entered a bear phase. An increase points to a stronger bull cycle, while a significant decrease raises the likelihood of a bear market.
Read more: Bitcoin Halving History: Everything You Need To Know
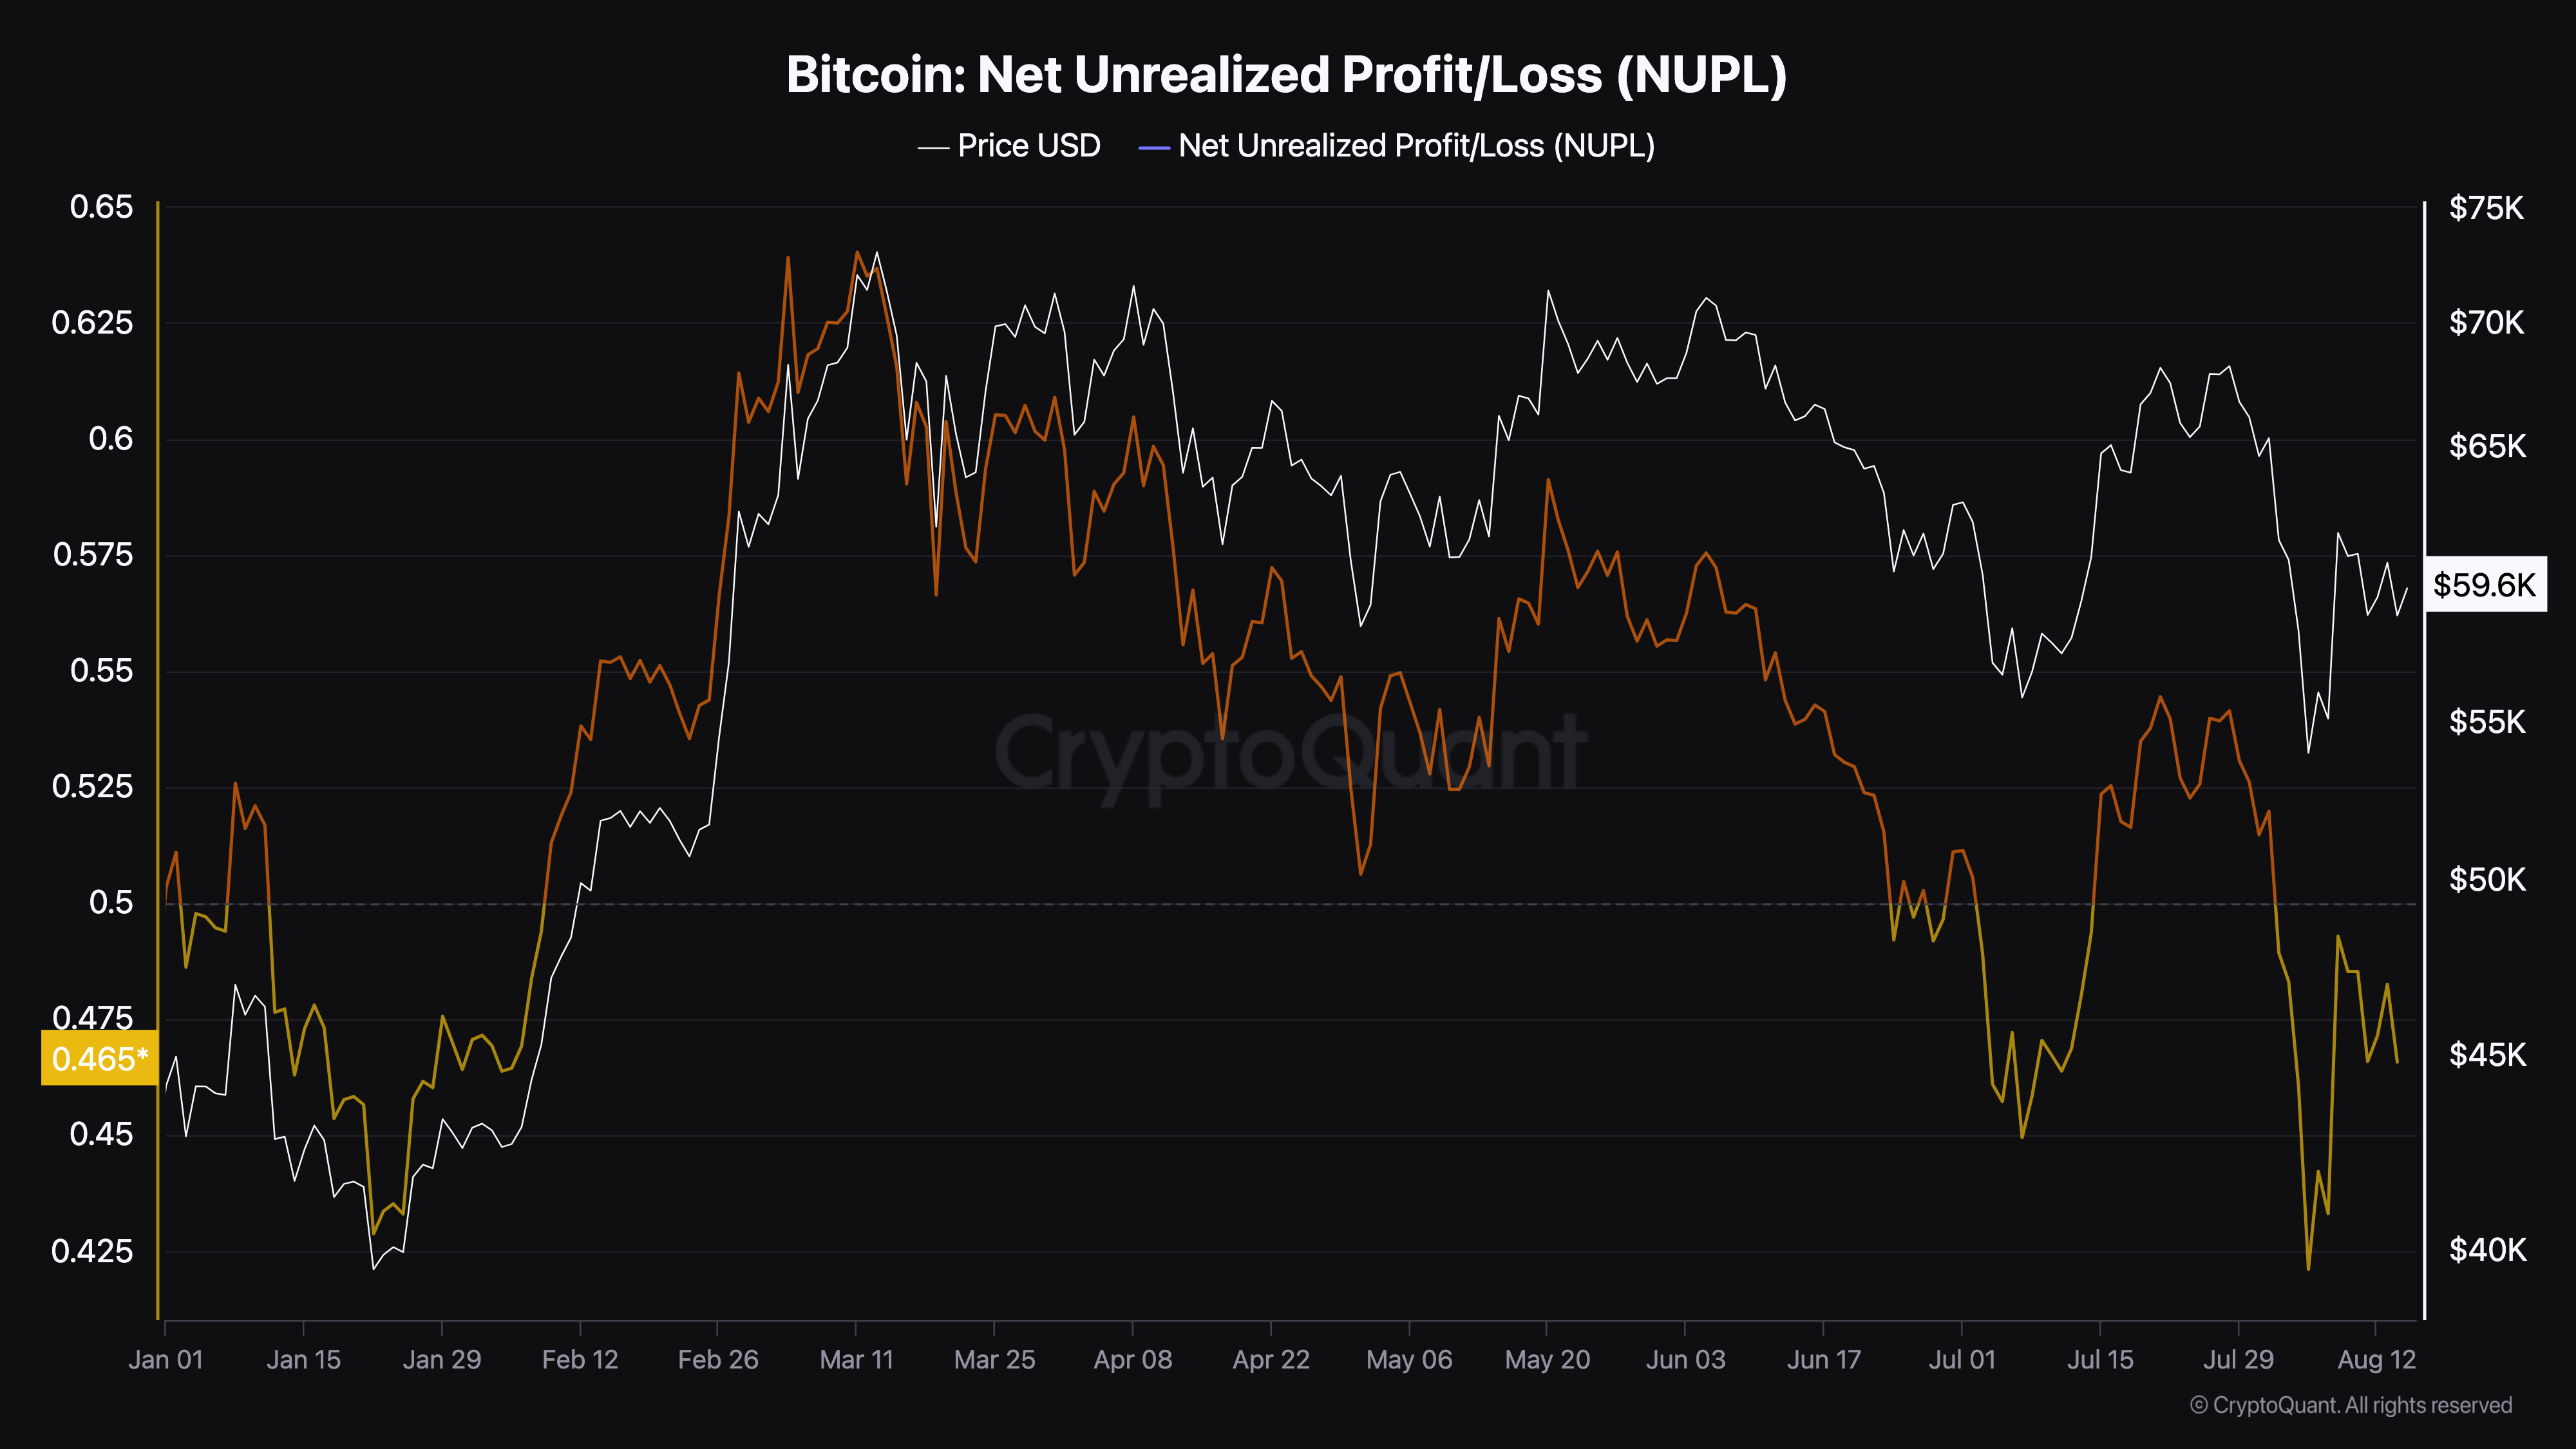
At press time, Bitcoin’s NUPL stands at 0.46. In July, a similar drop in this range led BTC’s price to decline to $55,857. The last time the indicator hit this level, Bitcoin’s price fell to $42,576.
This makes the current reading a critical point for the market. If the NUPL continues to decrease and reaches 0.40 or lower, bears could take control. According to Grizzly, a pseudonymous analyst on CryptoQuant, if that happens, BTC could potentially drop to $40,000.
“If the index continues its downward movement, it’s reasonable to anticipate that the bears could take full control of the market. In such a scenario, the price could drop to around $40,000,” Grizzly wrote in his analysis.
Disclaimer
In line with the Trust Project guidelines, this price analysis article is for informational purposes only and should not be considered financial or investment advice. BeInCrypto is committed to accurate, unbiased reporting, but market conditions are subject to change without notice. Always conduct your own research and consult with a professional before making any financial decisions. Please note that our Terms and Conditions, Privacy Policy, and Disclaimers have been updated.


GOAT price has skyrocketed 214.29% in one month, recently breaking into the $1 billion market cap and securing its place as the 10th largest meme coin. It now stands just ahead of MOG, which closely trails its position in the rankings.
However, recent indicators suggest that GOAT’s uptrend may be weakening, raising questions about whether it can sustain its rally or face a potential correction.
GOAT BBTrend Is Negative For The First Time In 4 Days
GOAT BBTrend has turned negative for the first time since November 17, now sitting at -0.54. This shift suggests that bearish momentum is beginning to take hold, with the asset’s recent upward trajectory starting to weaken potentially.
BBTrend measures the strength and direction of price trends using Bollinger Bands, with positive values indicating an uptrend and negative values signaling a downtrend. A negative BBTrend reflects increased downward pressure, which could indicate the start of a broader market shift.
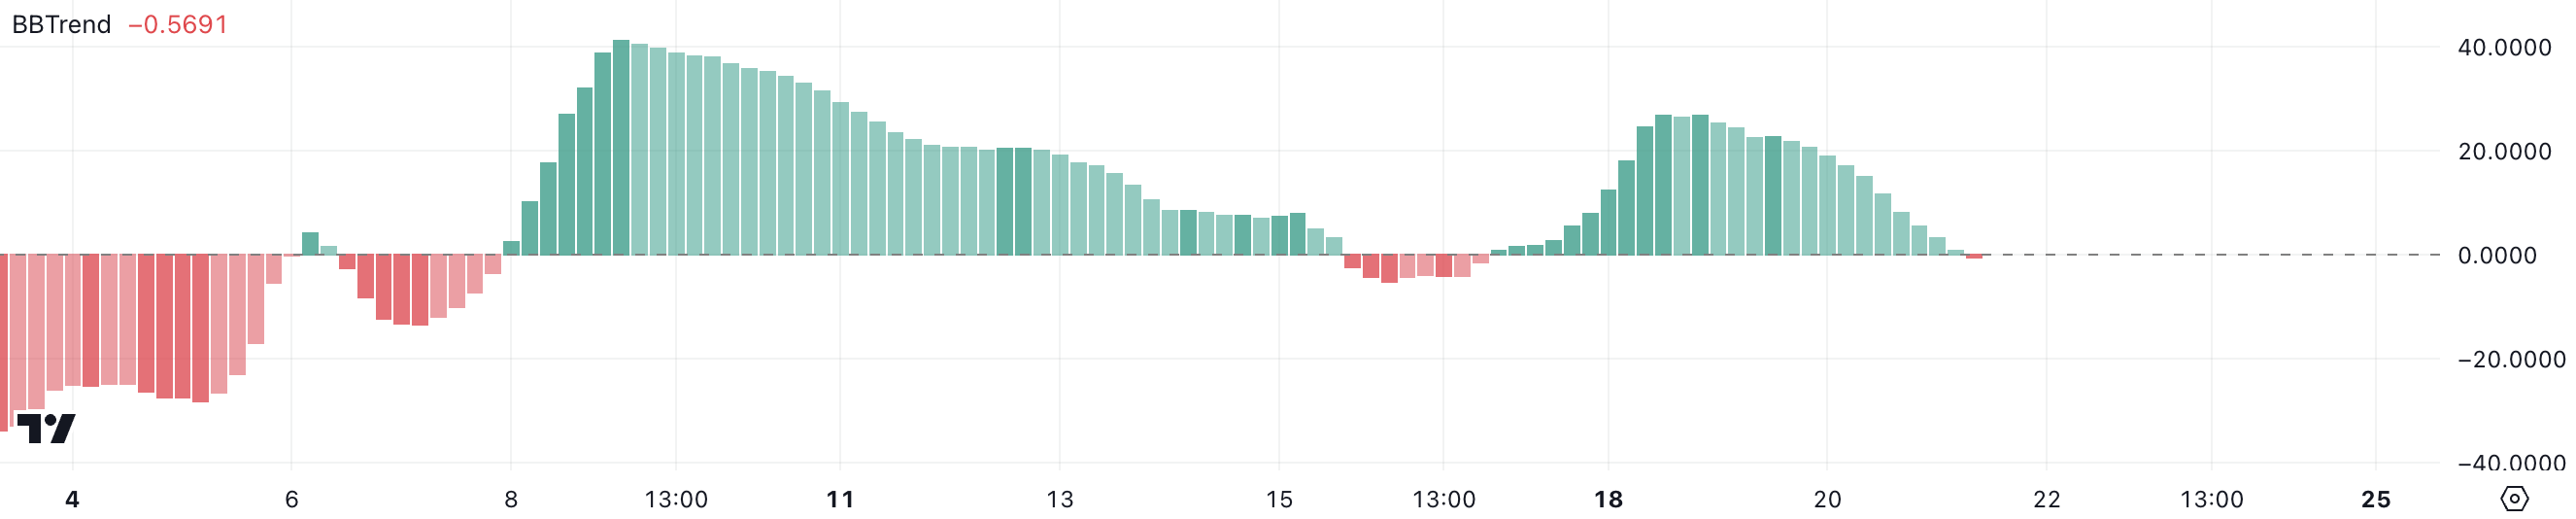
GOAT has had an impressive November, gaining 61% and reaching a new all-time high on November 17.
However, the current negative BBTrend, if it persists and grows, could signal the potential for further bearish momentum.
GOAT Is In A Neutral Zone
GOAT’s RSI has dropped to 52, down from over 70 a few days ago when it reached its all-time high. This decline indicates that buying momentum has cooled off, and the market has moved out of the overbought zone.
The drop suggests a shift toward a more neutral sentiment as traders consolidate gains and the strong bullish pressure seen earlier subsides.
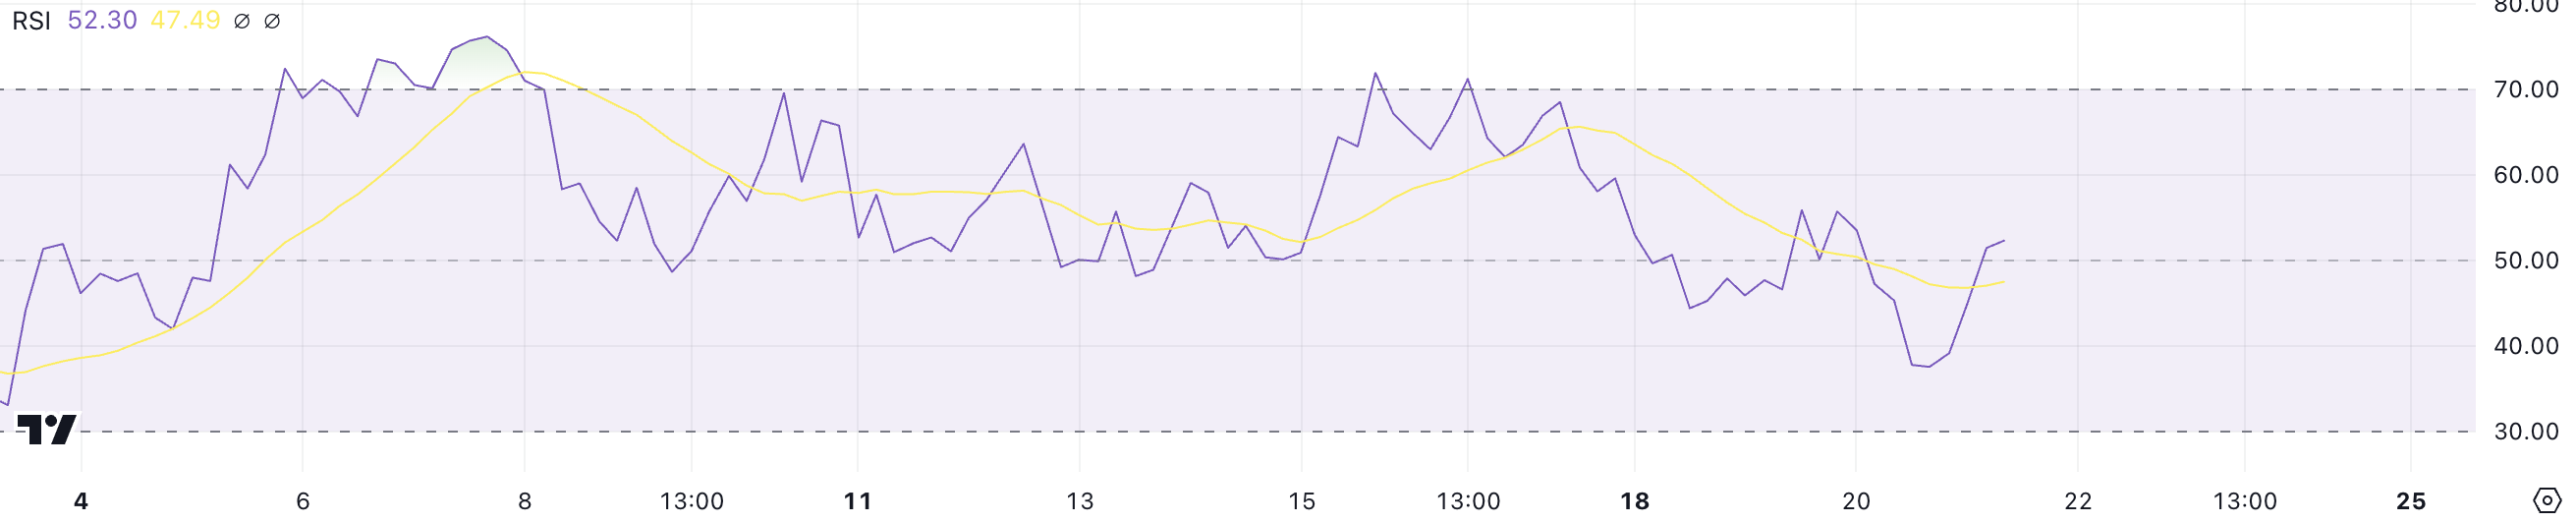
RSI measures the strength and velocity of price changes, with values above 70 indicating overbought conditions and below 30 signaling oversold levels. At 52, GOAT’s RSI is in a neutral zone, neither signaling strong bullish nor bearish momentum.
This could mean the current uptrend is losing strength, and the price may consolidate or move sideways unless renewed buying pressure reignites upward momentum.
GOAT Price Prediction: A New Surge Until $1.50?
If GOAT current uptrend regains strength, it could retest its all-time high of $1.37, establishing its market cap above $1 billion, a fundamental threshold for being among the biggest meme coins in the market today.
Breaking above this level could pave the way for further gains, potentially reaching the next thresholds at $1.40 or even $1.50, signaling renewed bullish momentum and market confidence.
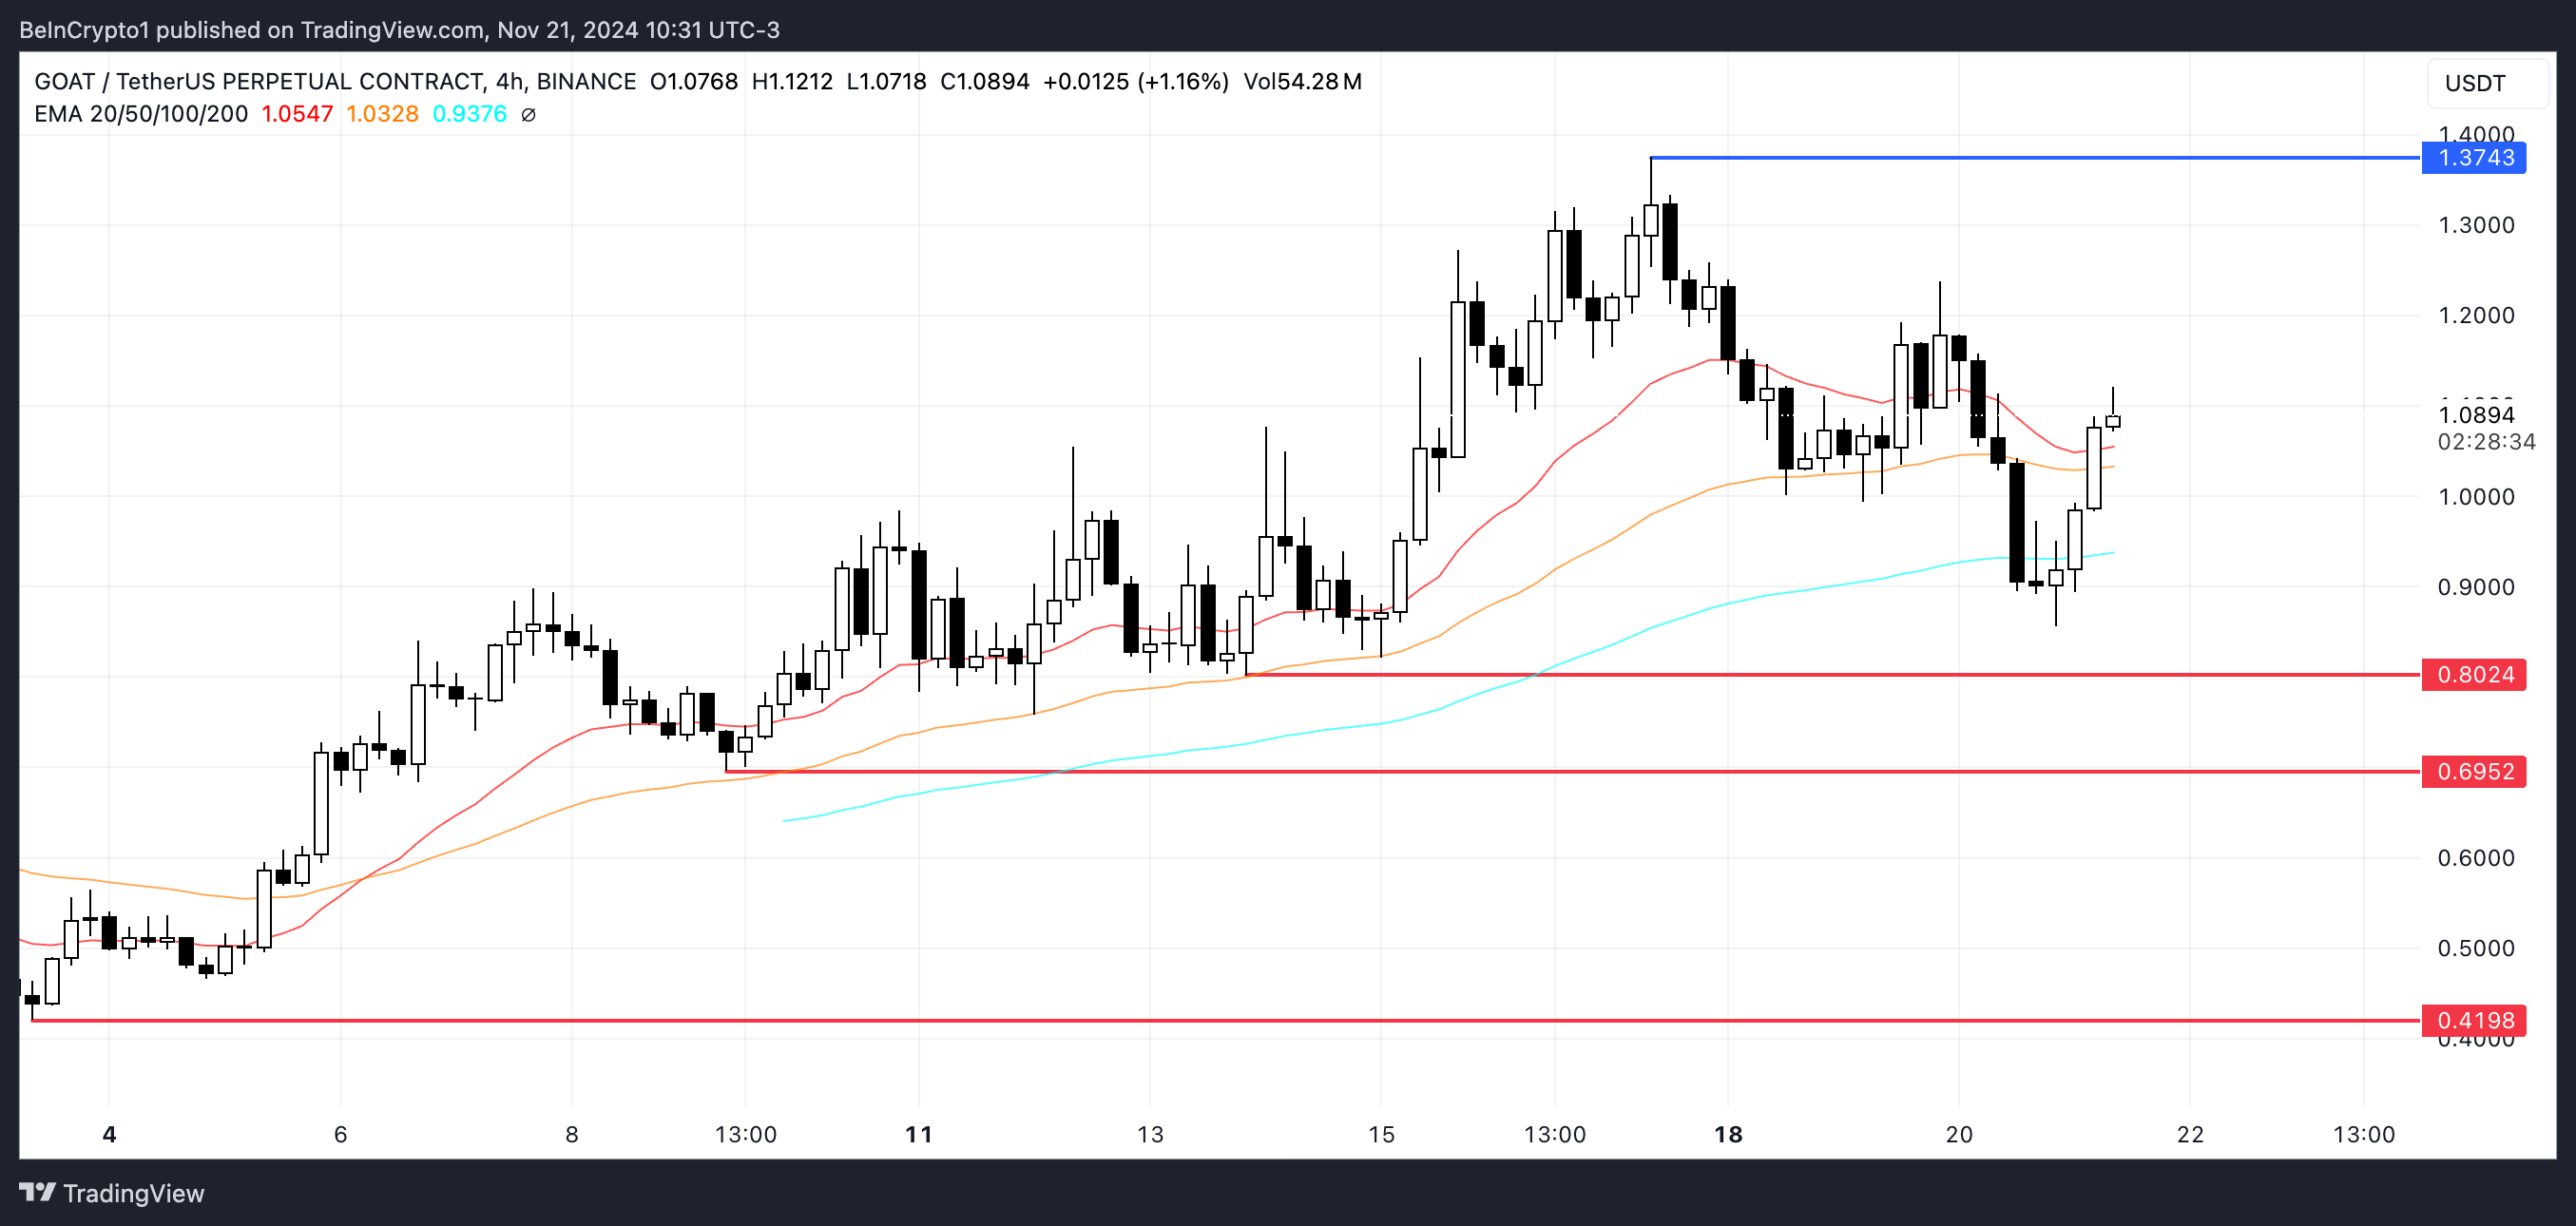
However, as shown by indicators like RSI and BBTrend, the uptrend may be losing steam. If a downtrend emerges, GOAT price could test its nearest support zones at $0.80 and $0.69.
Should these levels fail to hold, the price could fall further, potentially reaching $0.419, putting its position in the top 10 ranking of biggest meme coins at risk.
Disclaimer
In line with the Trust Project guidelines, this price analysis article is for informational purposes only and should not be considered financial or investment advice. BeInCrypto is committed to accurate, unbiased reporting, but market conditions are subject to change without notice. Always conduct your own research and consult with a professional before making any financial decisions. Please note that our Terms and Conditions, Privacy Policy, and Disclaimers have been updated.
Ripple (XRP) price has experienced a significant rally, rising 51.33% in the last seven days and an impressive 109.09% over the past month. This strong momentum has propelled XRP into a bullish phase, with key indicators like EMA lines supporting its upward trajectory.
However, signs of weakening momentum, such as a declining RSI and negative CMF, suggest that caution may be warranted. Whether XRP continues to push higher or faces a steep correction will depend on how the market reacts to these shifting dynamics.
XRP RSI Is Below The Overbought Zone
XRP’s RSI has dropped to 60 after nearly hitting 90 on November 16 and staying above 70 between November 15 and November 17.
This decline indicates that Ripple has moved out of the overbought zone, where intense buying pressure previously drove its price higher. The drop suggests that the market is cooling off, with traders potentially taking profits after the strong rally.
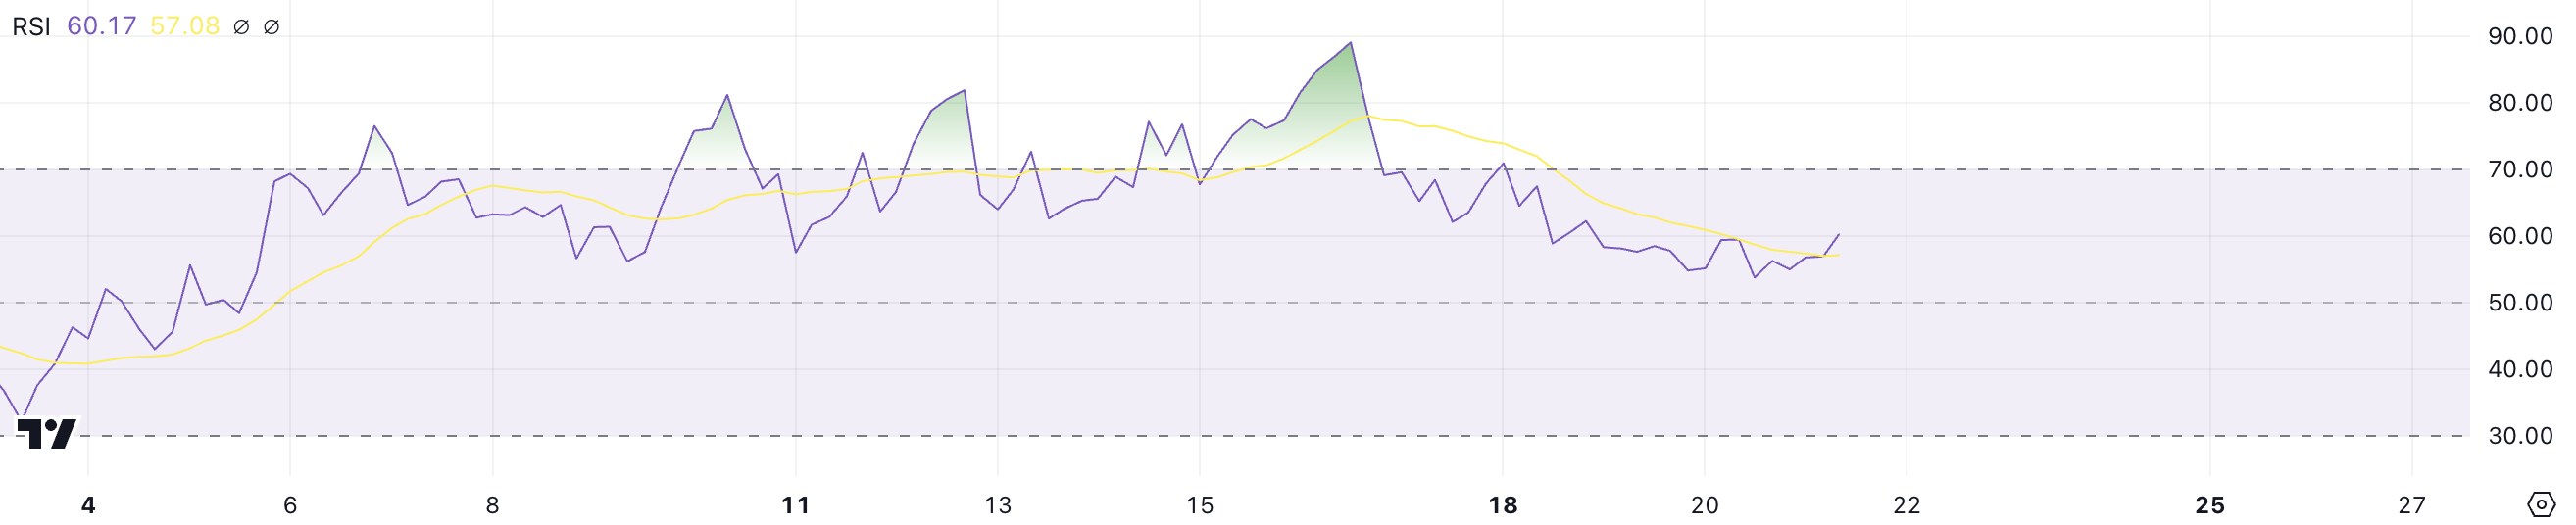
The RSI measures the speed and magnitude of price changes, with values above 70 indicating overbought conditions and below 30 signaling oversold levels. At 60, XRP’s RSI reflects a still-positive momentum but shows a more balanced sentiment compared to the previous surge.
While the uptrend remains intact, the lower RSI could indicate a slower pace of gains, with the possibility of consolidation as the market stabilizes. If buying pressure returns, XRP price could extend its upward movement, but a further decline in RSI might signal a weakening bullish momentum.
Ripple CMF Is Now Negative After Staying Positive For 14 Days
XRP Chaikin Money Flow (CMF) is currently at -0.12, after showing positive levels between November 5 and November 19. That is also its lowest level since October 31. This shift into negative territory reflects increased selling pressure and a potential outflow of capital from the asset.
The transition from positive CMF values earlier this month signals a weakening in bullish momentum as more market participants reduce exposure to Ripple.
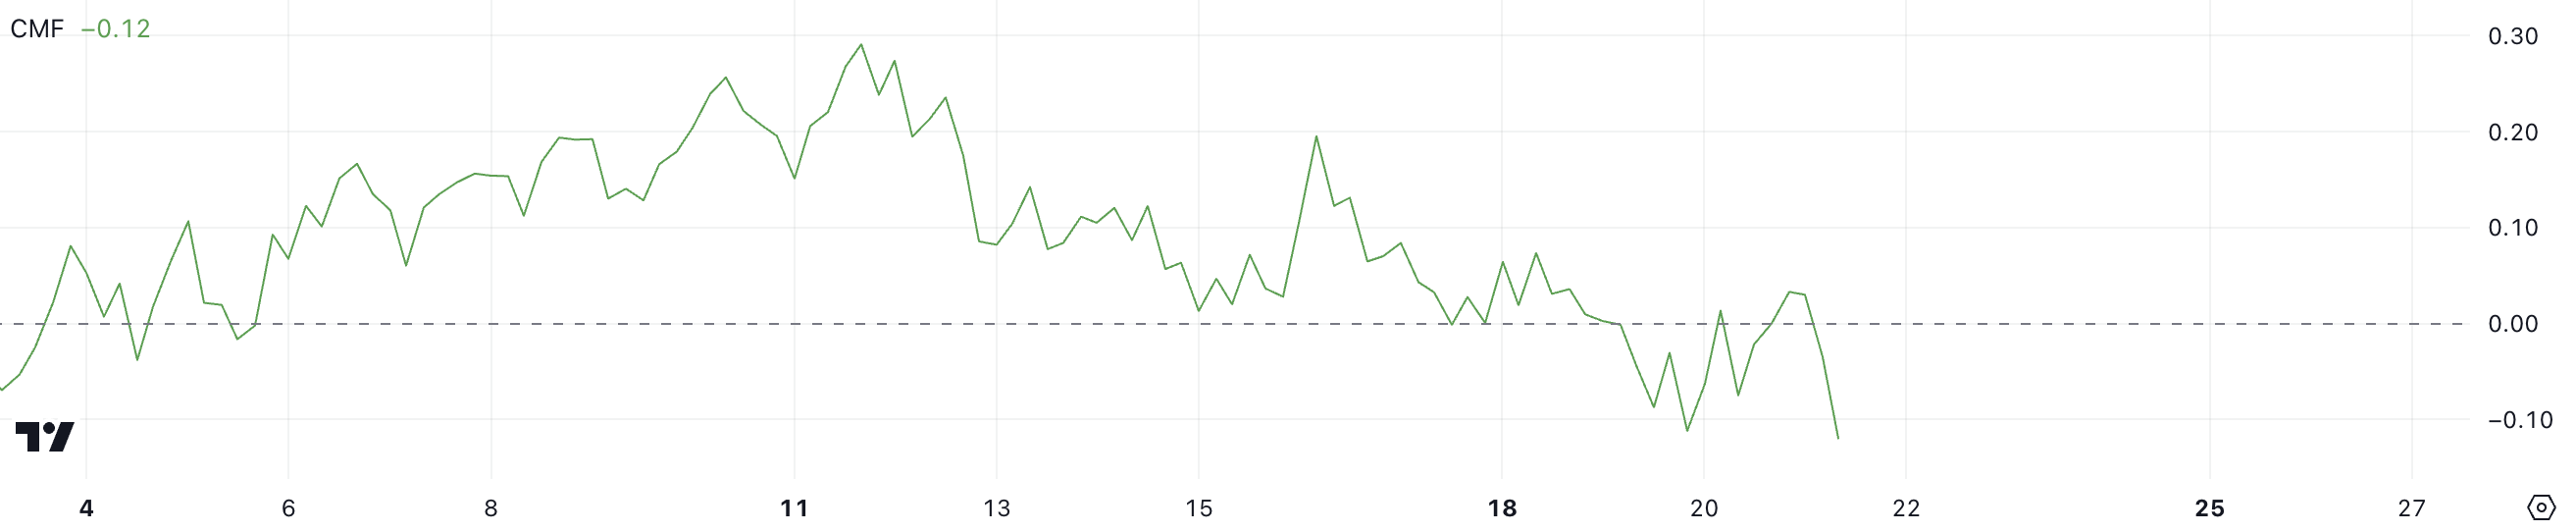
The CMF measures the volume and flow of money into or out of an asset, with positive values indicating capital inflow (bullish) and negative values showing capital outflow (bearish).
XRP’s CMF at -0.12 suggests that bearish sentiment is beginning to gain traction, potentially putting pressure on its price despite the recent uptrend. If the CMF remains negative or declines further, it could indicate sustained selling pressure, challenging Ripple’s ability to continue its upward movement.
Ripple Price Prediction: Biggest Price Since 2021?
XRP’s EMA lines currently display a bullish setup, with short-term lines positioned above the long-term lines and the price trading above all of them.
However, the narrowing distance between the price and some of these lines suggests a potential slowdown in bullish momentum. This could signal that the uptrend is weakening, leaving XRP price vulnerable to a shift in market sentiment.
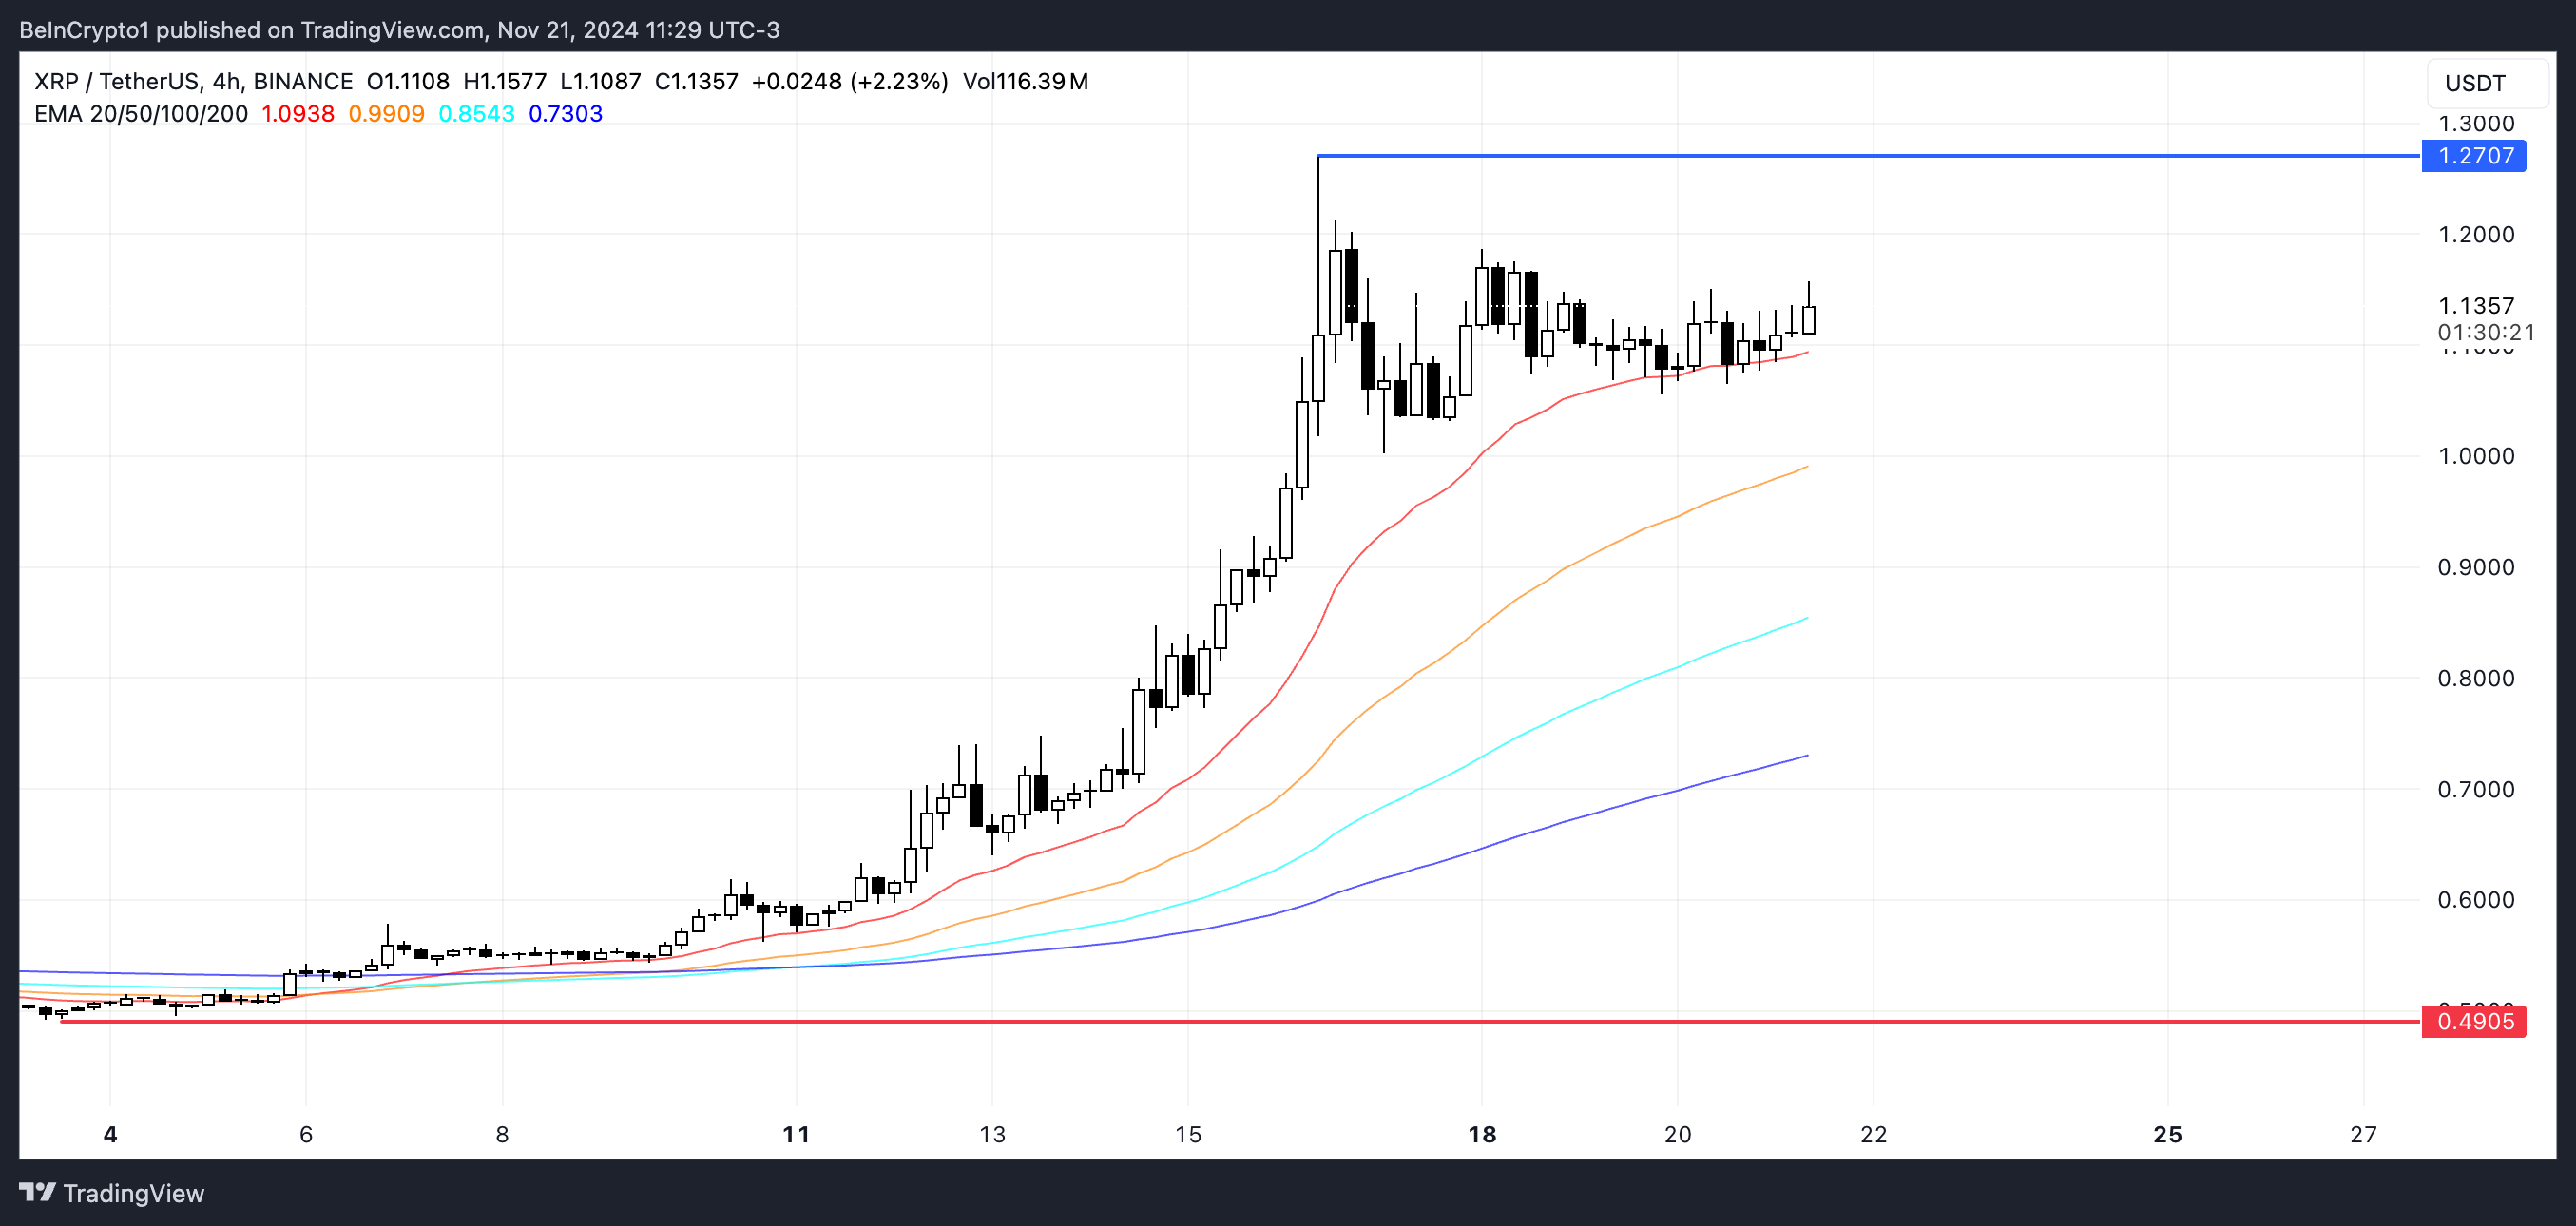
If a downtrend emerges, as indicated by the weakening RSI and negative CMF, Ripple price could face significant pressure and potentially drop to its support at $0.49, representing a substantial 56% correction.
On the other hand, if the uptrend regains strength, XRP could climb to test the $1.27 level and potentially break through to $1.30, which would mark its highest price since May 2021.
Disclaimer
In line with the Trust Project guidelines, this price analysis article is for informational purposes only and should not be considered financial or investment advice. BeInCrypto is committed to accurate, unbiased reporting, but market conditions are subject to change without notice. Always conduct your own research and consult with a professional before making any financial decisions. Please note that our Terms and Conditions, Privacy Policy, and Disclaimers have been updated.

Trump Media & Technology Group is exploring the development of a crypto payment platform, as revealed by a recent trademark filing.
The application, submitted by Donald Trump’s social media company on Monday, outlines plans for a service named TruthFi. The proposed platform aims to offer crypto payments, financial custody, and digital asset trading.
Following the trademark announcement, Trump Media’s stock rose approximately 2%. At the time of writing, the stock was trading at $30.44, up by nearly 75% this year.
However, details about TruthFi remain scarce, including its timeline or operational specifics. This initiative suggests an effort by Trump Media to expand its business model beyond Truth Social.
The social media platform was established back in 2022, after Trump was banned from Facebook and X (formerly Twitter).
Nevertheless, launching a large-scale cryptocurrency platform could require Trump Media to acquire additional resources or partner with an established firm. This is because the firm currently has a small workforce of less than 40 employees.
“The filing, made with the USPTO on Monday, indicates that Trump Media plans to offer: Digital wallets, Cryptocurrency payment processing services, and A digital asset trading platform,” US Trademark Attorney Josh Gerben wrote on X (formerly Twitter).
As reported by BeInCrypto earlier, Trump Media is also in discussions to purchase the b2b crypto trading platform Bakkt. Shares in Bakkt surged by nearly 140% since the news earlier this week.
Meanwhile, the President-elect’s crypto plans seem to be in full swing even before he takes office in January. He is also reportedly considering the first-ever crypto advisor role for the White House, and interviewing several potential candidates.
Earlier today, the current SEC chair Gary Gensler announced his resignation before Trump’s term begins. Gensler’s resignation boosted the crypto market, as it signals a major change in the SEC’s regulatory stance.
Notably, XRP surged 7% to its highest value in three years. Bitcoin also neared $99,000, as the overall crypto market cap reached $3.4 trillion.
Disclaimer
In adherence to the Trust Project guidelines, BeInCrypto is committed to unbiased, transparent reporting. This news article aims to provide accurate, timely information. However, readers are advised to verify facts independently and consult with a professional before making any decisions based on this content. Please note that our Terms and Conditions, Privacy Policy, and Disclaimers have been updated.

“Crypto Dad” Chris Giancarlo Emerges Top For White House Crypto Czar Role
Dogecoin Code Appears In CyberTruck And Model 3 Website, Will Tesla Accept DOGE Payments For Cars Soon?

GOAT Price Sees Slower Growth After Reaching $1B Market Cap

Ripple (XRP) Price Hits 109% Monthly Gain as Indicators Weaken

Ethereum Sees Neutral Netflow On Binance: What Does This Signal?
Trump Media Files Trademark for Crypto Platform TruthFi

2.52 Million Altcoins Are Ruining Crypto’s Future

Animoca Brands Valuation Tanks 75% In Two Years, Here’s Why

Crypto exchange BingX hacked for $43 million

Are The Big Players Losing Interest?

Hong Kong’s Securities Association Tips Authorities On Crypto Self-Regulation

Coinbase cbBTC Set to go Live on Solana
2.52 Million Altcoins Are Ruining Crypto’s Future
Animoca Brands Valuation Tanks 75% In Two Years, Here’s Why
Crypto exchange BingX hacked for $43 million
Are The Big Players Losing Interest?
Hong Kong’s Securities Association Tips Authorities On Crypto Self-Regulation
Coinbase cbBTC Set to go Live on Solana
-

 Market23 hours ago
This is Why MoonPay Shattered Solana Transaction Records
-

 Ethereum20 hours ago
Fundraising platform JustGiving accepts over 60 cryptocurrencies including Bitcoin, Ethereum
-

 Market24 hours ago
Steady Climb Toward New Highs
-

 Market20 hours ago
Cardano’s Hoskinson Wants Brian Armstrong for US Crypto-Czar
-
 Altcoin22 hours ago
BTC Reaches $97K, Altcoins Gains
-

 Market16 hours ago
South Korea Unveils North Korea’s Role in Upbit Hack
-
 Market11 hours ago
ETH/BTC Ratio Plummets to 42-Month Low Amid Bitcoin Surge
-
 Altcoin21 hours ago
SHIB Burn Rate Surges 2200%, Shiba Inu Eyes Parabolic Rally Ahead?