
Bitcoin
Mt. Gox Moves Another $2 Billion In Bitcoin, How Much Is Left?

The defunct crypto exchange Mt. Gox isn’t done with its Bitcoin repayments to creditors, as on-chain data shows that the exchange recently moved a significant amount of BTC. This has raised the question of how much Bitcoin Mt. Gox has left, considering the negative impact these BTC repayments have had on the flagship crypto’s price action so far.
Mt. Gox’s $2 Billion BTC On The Move
The on-chain analytics platform Arkham Intelligence revealed in an X (formerly Twitter) post that a wallet (bc1q26) that had received $2.19 billion worth of Bitcoin from Mt. Gox had recently initiated test transactions. This development is significant as the wallet that received the 33,105 BTC ($2.19 billion) from Mt. Gox is believed to belong to Bitgo, the fifth and final exchange the trustee approved for the BTC repayments.
As such, Bitgo may be preparing to distribute these Bitcoins to creditors. Following the test transaction, Bitgo moved Mt. Gox’s $2 billion BTC to another wallet (bc1qpn5), which could be a security precaution before they begin repayments to creditors. These Bitcoin transfers are also believed to be related to creditor repayments because some users on a Mt. Gox Reddit channel recently claimed they received BTC in their Bitgo account.
Mt. Gox’s Bitcoin repayments began last month, spreading panic through the crypto market as BTC dropped to as low as $54,000. These BTC distributions raised concerns that Mt. Gox creditors may sell off their BTC once received, which would put significant selling pressure on the flagship crypto.
However, the on-chain analytics platform Cryptoquant revealed that these Mt. Gox creditors chose to hold rather than offload their BTC holdings. Cryptoquant cited a spike in withdrawals from Kraken following the Mt. Gox Bitcoin repayments through the exchange, which suggests that these creditors were moving their coins to cold wallets.
This explains why Bitcoin remained steady despite the recent Mt. Gox BTC transfers. However, the defunct crypto exchange still holds 46,164 BTC ($2.81 billion), which could still significantly impact the market depending on whether other creditors choose to hold.
Bitcoin Awaits Critical Inflation Report
Bitcoin has continued to trade sideways as investors await the July Consumer Price Index (CPI) inflation report, which will be released on August 14. A positive inflation reading would strengthen the case for the US Federal Reserve to cut rates in September, boosting investors’ confidence in risk assets like Bitcoin and other cryptocurrencies.
The July Producer Price Index (PPI) inflation report, released on August 13, was positive, coming in lower than expectations. As such, a positive CPI inflation report might be all the confirmation that the Fed needs that inflation has indeed slowed and that now is the perfect time for the rate cuts. Following the August 5 Bitcoin crash, Bernstein analysts predicted that Bitcon’s price would turn bullish again when the Fed cuts interest rates.
Featured image created with Dall.E, chart from Tradingview.com


Marathon Digital Holdings, one of the largest Bitcoin miners, has completed a record $1 billion offering of 0% convertible senior notes due 2030. The net proceeds from the sale were approximately $980 million.
According to the firm’s statement, the net proceeds will be primarily used to buy Bitcoin.
Marathon Digital Holds over $2.5 Billion Worth of Bitcoin
After its last purchase in September, Marathon Digital’s Bitcoin holdings stand at 25,945 BTC. This is currently worth approximately $2.52 billion, as Bitcoin reached an all-time high of $98,000 earlier today.
However, the company’s decision to expand its holdings potentially points to a larger bullish cycle for the token in the long term. According to its press release, Marathon Digital plans to use $199 million of the net proceeds to repurchase existing convertible notes due 2026.
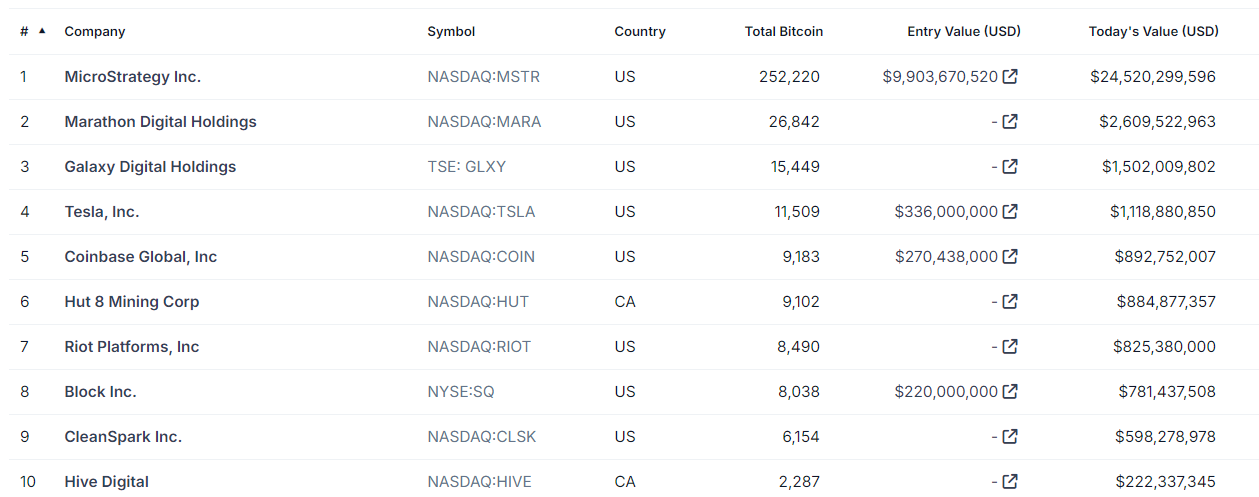
The remainder will be used to acquire additional Bitcoin and for general corporate purposes. Marathon Digital is currently the second largest Bitcoin holder among publicly traded companies.
The notes offer flexibility, with options for conversion into cash, shares of Marathon’s common stock, or a combination of both. Redemption terms include the ability for the company to redeem the notes at full principal value plus accrued interest.
“$1 Billion. 0% interest. MARA has completed the largest convertible notes offering ever amongst BTC miners. The mission, as always: Provide value. Acquire #bitcoin,” the company wrote on X (formerly Twitter).
Increasing Bitcoin Acquisition Among Public Firms
Marathon Digital is following an ongoing trend of public companies increasing their Bitcoin holdings in this bull market. Earlier this week, MicroStrategy announced plans to issue $1.75 billion in convertible notes maturing in 2029. The proceeds will be used to fund additional Bitcoin purchases.
On the same day, the company secured $4.6 billion worth of Bitcoin, building on a $2 billion acquisition from the prior week.
Bitcoin’s all-time high and these aggressive purchases propelled MicroStrategy’s stock price by nearly 120% in a single month. The largest Bitcoin holder also entered the list of top 100 public companies in the US.
Meanwhile, Marathon Digital has faced challenges despite its growing Bitcoin reserves. The company reported a $125 million net loss in Q3. This was driven by a $92 million year-over-year increase in operating costs.
However, its operational capacity has strengthened. Earlier this month, its energized hash rate surged by 93%, signaling increased mining efficiency. Marathon Digital also signed an $80 million agreement with the Keynan government to expand its Bitcoin mining capabilities.
Disclaimer
In adherence to the Trust Project guidelines, BeInCrypto is committed to unbiased, transparent reporting. This news article aims to provide accurate, timely information. However, readers are advised to verify facts independently and consult with a professional before making any decisions based on this content. Please note that our Terms and Conditions, Privacy Policy, and Disclaimers have been updated.

Coinbase, the largest US-based crypto exchange, has announced it will suspend trading for Wrapped Bitcoin (WBTC) on December 19, 2024, at approximately 12 p.m. ET.
The decision, revealed in a post on X (formerly Twitter), cites a routine review of its listed assets to ensure compliance with listing standards.
Coinbase Sidesteps WBTC Amid cbBTC Boom
The suspension will apply to both Coinbase Exchange and Coinbase Prime. Although trading will cease, WBTC holders will retain full access to their funds and the ability to withdraw them at any time. In preparation for the transition, Coinbase has moved WBTC trading to a limit-only mode, where users can place and cancel limit orders while matches may still occur.
“Coinbase will suspend trading for WBTC (WBTC) on December 19, 2024, at or around 12 pm ET. Your WBTC funds will remain accessible to you, and you will continue to have the ability to withdraw your funds at any time. We have moved our WBTC order books to limit-only mode. Limit orders can be placed and canceled, and matches may occur,” Coinbase detailed.
Coinbase’s move to suspend WBTC comes amid the rapid success of its wrapped Bitcoin token, cbBTC. Recently, cbBTC surpassed a $1 billion market capitalization, reflecting growing adoption and trust within the crypto community. This milestone has further cemented cbBTC’s position as a strong competitor to WBTC in the decentralized finance (DeFi) space.

As of this writing, data on Dune shows that cbBTC market capitalization has increased to $1.44 billion. CBTC’s native availability on networks like Solana, Ethereum, and Base has significantly expanded its accessibility, with Arbitrum being the latest addition.
“cbBTC is live on Arbitrum. cbBTC is an ERC-20 token that is backed 1:1 by Bitcoin (BTC) held by Coinbase. It is natively available on Arbitrum and securely accessible to more users across the Ethereum ecosystem,” Coinbase shared on Tuesday.
Additionally, prominent DeFi protocol Aave is targeting cbBTC for its Version 3 (V3) platform, enhancing its utility within the ecosystem. This growing momentum may have played a key role in Coinbase’s decision to phase out WBTC trading.
WBTC Core Team Urge Coinbase to Reconsider
The team behind Wrapped Bitcoin expressed regret and surprise at Coinbase’s decision. In a statement on X, WBTC’s core team emphasized its commitment to compliance, transparency, and decentralization.
“We regret and are surprised by Coinbase’s decision to delist WBTC…We urge Coinbase to reconsider this decision and continue supporting WBTC trading,” the team said.
The statement outlined WBTC’s longstanding reputation for novel mechanisms, regulatory compliance, and decentralized governance. Highlighting its seamless integration with DeFi protocols, WBTC described itself as an essential liquidity solution for Bitcoin users. Urging Coinbase to reconsider, WBTC reaffirmed its readiness to address any concerns or provide additional information to support its case.
Meanwhile, Coinbase’s announcement has sparked mixed reactions across the crypto community. Some users criticized the exchange, suggesting the decision reflects an inability to handle competition.
“Coinbase can’t handle fair competition?? WBTC superior to cbBTC” said Gally Sama in a post.
Nevertheless, others support the move, citing concerns over WBTC’s custody model, with one user referencing BitGo’s recent adoption of a multi-jurisdictional custody system.
“You put custody in the hands of a fraud. What did you think was gonna happen?” the user expressed.
This critique aligns with growing fears about Justin Sun’s involvement in WBTC’s custody processes, as BeInCrypto reported recently. Some users have acted preemptively to avoid potential risks, with one commenter sharing their reservations.
“When Sun got on the multisig for WBTC, I sent all my WBTC on OP to Coinbase and exchanged for true BTC that I withdrew to my hardware wallet… You gave me confirmation just now that I made the right move,” they wrote.
The decision to suspend WBTC trading could mark a pivotal moment in the competition between wrapped Bitcoin solutions. While cbBTC’s integration across multiple blockchain networks has gained momentum, skepticism surrounding WBTC’s custody model and leadership has intensified.
Justin Sun has voiced criticism of Coinbase’s cbBTC strategy, labeling it a setback for Bitcoin’s broader adoption. As the debate continues, the industry watches closely to see whether Coinbase’s cbBTC will solidify its dominance or if WBTC can regain its position as a leading wrapped Bitcoin solution. Regardless, the shifting dynamics reflect the importance of transparency, governance, and community trust in shaping the future of DeFi.
Disclaimer
In adherence to the Trust Project guidelines, BeInCrypto is committed to unbiased, transparent reporting. This news article aims to provide accurate, timely information. However, readers are advised to verify facts independently and consult with a professional before making any decisions based on this content. Please note that our Terms and Conditions, Privacy Policy, and Disclaimers have been updated.

Bitcoin (BTC) may be at risk of a catastrophic “bank run,” according to Justin Bons, founder and CIO of Cyber Capital.
A bank run is when customers withdraw their deposits from a financial institution over fears of insolvency.
Bitcoin Cannot Handle Mass Exits, Bons Says
In a detailed social media thread, Bons highlighted critical flaws in Bitcoin’s transaction capacity, self-custody model, and network security. In his opinion, these could lead to a crisis that would destabilize the network and devastate investors.
Bons’ analysis centers on Bitcoin’s limited transaction processing capability, which he calculated at approximately seven transactions per second (TPS). Using data from Glassnode and Bitcoin’s code, he argued that Bitcoin’s 33 million on-chain users would face a bottleneck if a mass panic triggered simultaneous exits.
“At this rate, the queue would be 1.82 months long under optimal conditions. However, in reality, transactions would get stuck and eventually be dropped, making it impossible for smaller parties to exit unless they pay exorbitant fees,” Bons explained.
Bons warned that this limitation could lead to a “death spiral,” where a price crash forces miners to shut down, slowing the network further. The resulting delays could deepen the panic, creating a vicious cycle of declining hash rates, prolonged block times, and falling prices.
Further in his critique of BTC, Bons claimed Bitcoin’s transaction capacity is insufficient for real-world use. He compared Bitcoin’s 7 TPS to other systems, such as Visa’s 5,000 TPS, or even competitors in the crypto space that exceed 10,000 TPS without sacrificing decentralization.
“There are literally ZERO use cases that can be supported by 7 TPS. Mass self-custody over BTC is a dangerous narrative. The only scalable path forward for BTC adoption is through centralized custodians and banks, contradicting its ethos as ‘freedom money’,” he stated.
Bons also questioned Bitcoin’s long-term sustainability, citing its shrinking security budget. This, in his opinion, is a critical issue that could exacerbate the risks he outlined. The thread also touches on Bitcoin’s deviation from its original vision as “peer-to-peer (P2P) electronic cash.” He lamented that the network’s constraints and governance have turned it into a speculative asset rather than a practical medium of exchange.
Bons’ remarks ignited a heated debate on X (formerly Twitter). Patrick Flanagan, a self-described tech expert, dismissed the claims.
“This is pure fantasy. If this was going to occur, it would have occurred years ago,” Flanagan argued.
Bons rebutted, asserting that the risk increases as the number of users grows. He noted that even a fraction of users leaving could trigger a run and added that the larger the network gets, the more severe the problem becomes.
Other users highlighted potential alternatives, such as trading wrapped Bitcoin (WBTC) on Ethereum, which bypasses Bitcoin’s base layer limitations. Bons acknowledged this but noted that wrapped BTC users could exit quickly while on-chain users would be trapped, exacerbating the sell-off. The discussion also extended to Bitcoin’s self-custody model.
“This is something that self-custody advocates should pay attention to. One tiny bit of FUD and everyone gets their money stuck,” DashPay’s Joel Venezuela remarked.
Bons responded, acknowledging the difficult position he finds himself in as a cypherpunk and self-custody advocate. Another user raised a comparison to gold, questioning how long it would take to liquidate global gold holdings. Bons countered that while gold also has practical limits, its theoretical transaction capacity far exceeds Bitcoin’s, making it less susceptible to such bottlenecks.
Critics of Bons’ analysis argue that Bitcoin has weathered similar concerns in the past without collapsing. However, his warning adds to a growing chorus of voices calling for a reevaluation of Bitcoin’s scalability and usability.
Despite his grim outlook for Bitcoin, Bons remains optimistic about the broader cryptocurrency space. “There is much hope left for cryptocurrency as a whole,” he concluded, suggesting that Bitcoin’s original ethos now thrives in other blockchain projects.
Meanwhile, while Bitcoin remains the dominant cryptocurrency, debates over its scalability and resilience continue. Bons’ warning serves as a stark reminder of the challenges Bitcoin faces as it seeks broader adoption in a changing financial space. Elsewhere, Galaxy CEO Mike Novogratz has almost similar reservations about a Bitcoin reserve in the US.
“I think that it would be very smart for the United States to take the Bitcoin they have and maybe add some to it… I don’t necessarily think that the dollar needs anything to back it up,” Novogratz claimed.
Disclaimer
In adherence to the Trust Project guidelines, BeInCrypto is committed to unbiased, transparent reporting. This news article aims to provide accurate, timely information. However, readers are advised to verify facts independently and consult with a professional before making any decisions based on this content. Please note that our Terms and Conditions, Privacy Policy, and Disclaimers have been updated.

“Crypto Dad” Chris Giancarlo Emerges Top For White House Crypto Czar Role
Dogecoin Code Appears In CyberTruck And Model 3 Website, Will Tesla Accept DOGE Payments For Cars Soon?

GOAT Price Sees Slower Growth After Reaching $1B Market Cap

Ripple (XRP) Price Hits 109% Monthly Gain as Indicators Weaken

Ethereum Sees Neutral Netflow On Binance: What Does This Signal?
Trump Media Files Trademark for Crypto Platform TruthFi

2.52 Million Altcoins Are Ruining Crypto’s Future

Animoca Brands Valuation Tanks 75% In Two Years, Here’s Why

Crypto exchange BingX hacked for $43 million

Are The Big Players Losing Interest?

Hong Kong’s Securities Association Tips Authorities On Crypto Self-Regulation

Coinbase cbBTC Set to go Live on Solana
2.52 Million Altcoins Are Ruining Crypto’s Future
Animoca Brands Valuation Tanks 75% In Two Years, Here’s Why
Crypto exchange BingX hacked for $43 million
Are The Big Players Losing Interest?
Hong Kong’s Securities Association Tips Authorities On Crypto Self-Regulation
Coinbase cbBTC Set to go Live on Solana
-

 Market21 hours ago
This is Why MoonPay Shattered Solana Transaction Records
-

 Ethereum18 hours ago
Fundraising platform JustGiving accepts over 60 cryptocurrencies including Bitcoin, Ethereum
-

 Market23 hours ago
Dogecoin (DOGE) Price Momentum Weakens Despite Rally
-

 Altcoin23 hours ago
Crypto Analyst Says Dogecoin Price Has Entered Parabolic Surge To $23.36. Here Are The Reasons Why
-

 Market22 hours ago
Steady Climb Toward New Highs
-

 Market15 hours ago
South Korea Unveils North Korea’s Role in Upbit Hack
-

 Market19 hours ago
Cardano’s Hoskinson Wants Brian Armstrong for US Crypto-Czar
-
 Altcoin21 hours ago
BTC Reaches $97K, Altcoins Gains