
Market
BNB Price Back on Track: Can It Break $535 to Move Higher?

BNB price is recovering higher from the $500 support zone. The price is now showing positive signs and might aim for more upsides above $535.
- BNB price started a recovery wave from the $500 support zone.
- The price is now trading above $515 and the 100-hourly simple moving average.
- There is a key rising channel forming with resistance at $528 on the hourly chart of the BNB/USD pair (data source from Binance).
- The pair could gain bullish momentum if it clears the $535-$538 resistance zone.
BNB Price Eyes More Upsides
After forming a base above the $500 level, BNB price started a decent upward move like Ethereum and Bitcoin. The price cleared the $510 and $515 resistance levels to move into a short-term bullish zone.
The price surpassed the 50% Fib retracement level of the downward move from the $5376 swing high to the $499 low. It even cleared the $520 resistance. The price is now trading above $515 and the 100-hourly simple moving average.
It is now consolidating near the 61% Fib retracement level of the downward move from the $5376 swing high to the $499 low. On the upside, the price could face resistance near the $528 level. There is also a key rising channel forming with resistance at $528 on the hourly chart of the BNB/USD pair.
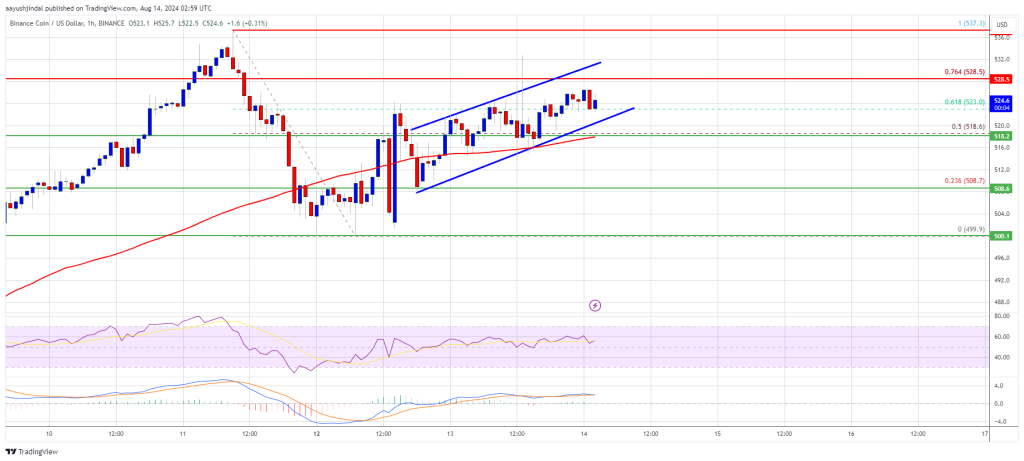
The next resistance sits near the $535 level. A clear move above the $535 zone could send the price higher. In the stated case, BNB price could test $550. A close above the $550 resistance might set the pace for a larger increase toward the $565 resistance. Any more gains might call for a test of the $580 level in the near term.
Another Decline?
If BNB fails to clear the $535 resistance, it could start another decline. Initial support on the downside is near the $520 level. The next major support is near the $518 level.
The main support sits at $508. If there is a downside break below the $508 support, the price could drop toward the $500 support. Any more losses could initiate a larger decline toward the $480 level.
Technical Indicators
Hourly MACD – The MACD for BNB/USD is gaining pace in the bullish zone.
Hourly RSI (Relative Strength Index) – The RSI for BNB/USD is currently above the 50 level.
Major Support Levels – $518 and $508.
Major Resistance Levels – $528 and $535.


On April 9, 2025, the US Senate confirmed Paul Atkins as the new Chair of the SEC with a majority 52–44 vote. This marked a new chapter for the crypto industry in the US.
The crypto community welcomed the news enthusiastically. Atkins is widely seen as someone who will bring transparency and support innovation—unlike the heavy-handed approach of his predecessor, Gary Gensler.
Paul Atkins Will Bring Clarity and New Direction to the US Crypto Industry
In Wednesday’s episode of the Crypto in America podcast, Republican Congressman Tom Emmer—House Majority Whip and Co-Chair of the Congressional Crypto Caucus—shared his optimistic expectations for Atkins’ role in reshaping crypto policy.
Emmer expressed strong confidence that Paul Atkins will steer the SEC back to its core mission: ensuring that all Americans have access to the world’s greatest financial markets, including digital assets.
“I think Paul Atkins will bring the clarity and certainty that we need. I’ve been saying for over nine years, we need to understand what is currency, what is security, and what is a commodity. I’m sick and tired of hearing about the case law and that, oh well, you know, the attorneys, the courts—why are we doing that? We’re Congress. Why don’t we act? And I think it’ll start with the new SEC Chair, but he will give us direction much like Trump is doing with executive orders.” Emmer said.
This statement reflects the long-standing demand from the crypto industry for a clear legal framework.
Paul Atkins is well-acquainted with the SEC and the financial sector. He served as an SEC Commissioner from 2002 to 2008 under President George W. Bush. During that time, Atkins gained recognition for his pro-free market stance and efforts to reduce regulatory burdens.
After his tenure at the SEC, Atkins founded Patomak Global Partners, a consulting firm that helps crypto companies navigate complex regulatory frameworks.
Notably, since 2017, he has served as Co-Chair of the Token Alliance, an initiative of the Digital Chamber of Commerce, where he has led efforts to develop best practices for the issuance and trading of digital assets.
Atkins’ career demonstrates a deep understanding of the intersection between technology and finance. Emmer expects him to adopt a “light-touch” approach—one that focuses on supporting innovation rather than stifling it.
“I think he’s gonna make sure that that’s the SEC that we believe it should be. Gary Gensler took it off mission. What it’s supposed to do is make sure that every single American has access to the greatest financial markets on the face of the planet. And what Gary Gensler was doing was saying, well, if you’re traditional finance, you can have access. But if you’re this new digital stuff, this is bad. We’re gonna make sure that we stop you from doing anything.” Emmer said.
Emmer added that this shift in leadership could pave the way for critical legislation like the FIT 21 Act, which passed the House in May 2024 to provide clear rules for digital assets.
With support from Atkins and the Trump administration—who had pledged to make America the “crypto capital of the world”—Emmer believes Congress can soon codify these reforms into law, creating a lasting impact on the market.
Criticism of Gary Gensler: A Legacy of Obstruction
In contrast to his optimism about Atkins, Emmer did not hesitate to criticize Gary Gensler, saying that he had set “a pretty low bar” for the SEC.
“We need to have clarity and certainty in the system so investors, entrepreneurs, can, you know, take risk and innovate. And what was Gary Gensler doing? He was stopping all of that. He was telling people, my door is open. Bring any idea you got, we’re happy to talk to you about it. Well, if you were naive enough to do that, he usually sued you, or he sent you a letter that you’re under investigation afterward.” Emmer criticized.
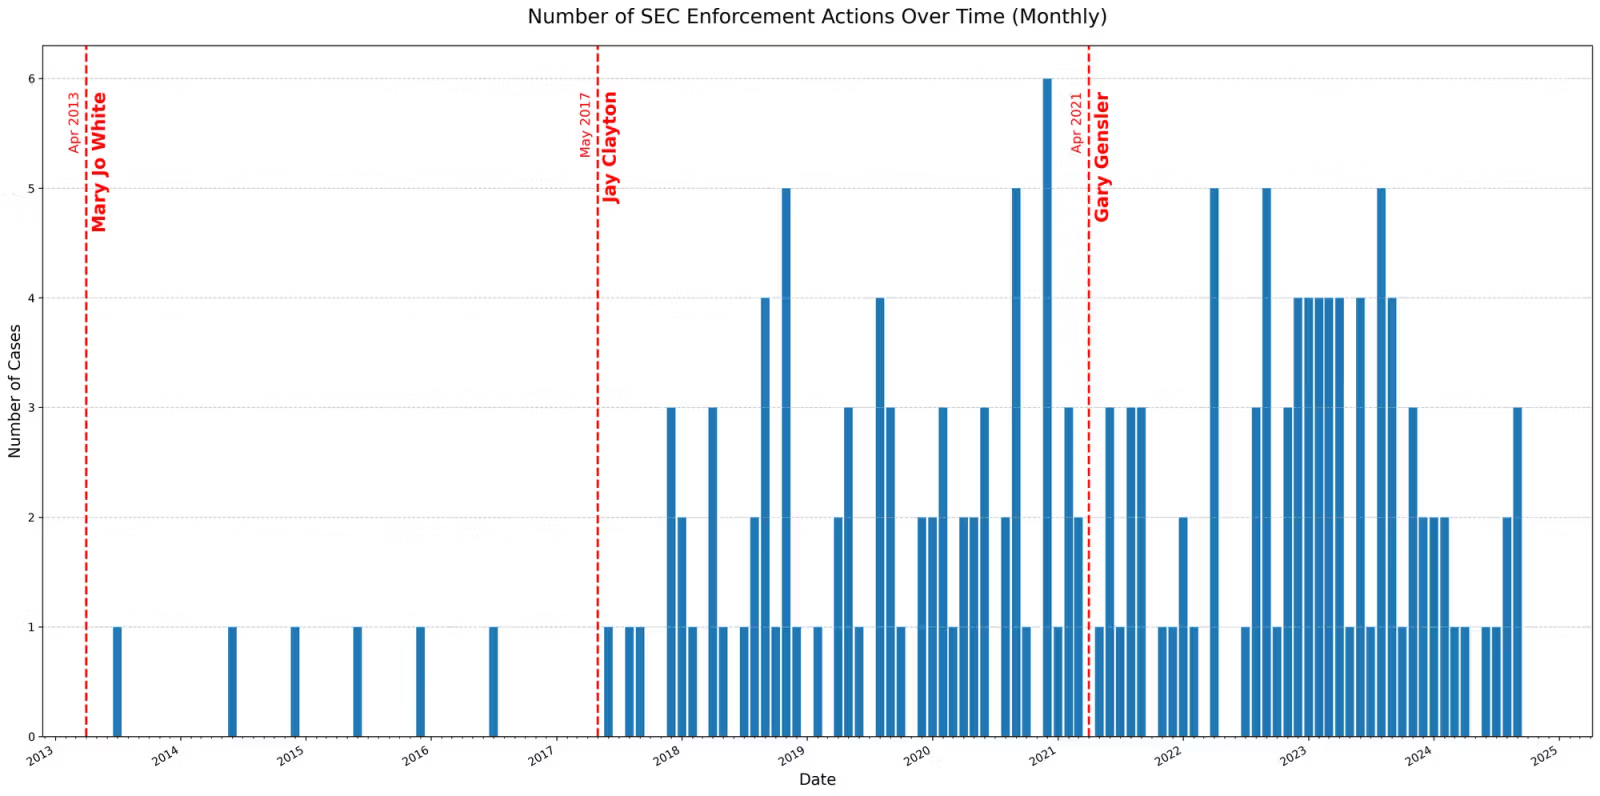
According to a report by Paradigm, since the SEC’s first crypto-related enforcement in 2015, the agency has taken action against 171 projects and individuals.
These actions spanned three presidential terms and three confirmed SEC chairs. Nearly half of them—88 cases—occurred under Gensler’s leadership.
Emmer also pointed out a striking contradiction in Gensler’s approach to meme coins, often criticized as vehicles for fraud.
“I heard a lot of complaints about meme coins yesterday during the hearing… But you realize Gary Gensler is the one that said, this is what we could use meme coins for. He’s the one that actually empowered the creation of meme coins the way we see it right now… If you don’t like it, stop complaining about it, and let’s figure out how we can put some guardrails on that.” Emmer revealed.
His remarks emphasized Gensler’s failure to provide guidance—instead choosing to criticize and punish. With Atkins, Emmer hopes to reverse that trend. He envisions an SEC that doesn’t just enforce but enables the crypto industry to grow within the United States.
A New Era for Crypto Policy
According to Tom Emmer, Paul Atkins’ appointment is more than a change in leadership. It’s an opportunity to reset crypto policy in America. Atkins could be the catalyst for Congress to turn reforms into reality—and, more importantly, to keep crypto businesses in the US rather than driving them overseas.
With a clear and supportive approach, Atkins could transform the SEC into an agency that champions the digital financial future rather than blocking it.
If successful, the crypto industry may be entering a new era of unprecedented growth under his leadership.
Disclaimer
In adherence to the Trust Project guidelines, BeInCrypto is committed to unbiased, transparent reporting. This news article aims to provide accurate, timely information. However, readers are advised to verify facts independently and consult with a professional before making any decisions based on this content. Please note that our Terms and Conditions, Privacy Policy, and Disclaimers have been updated.

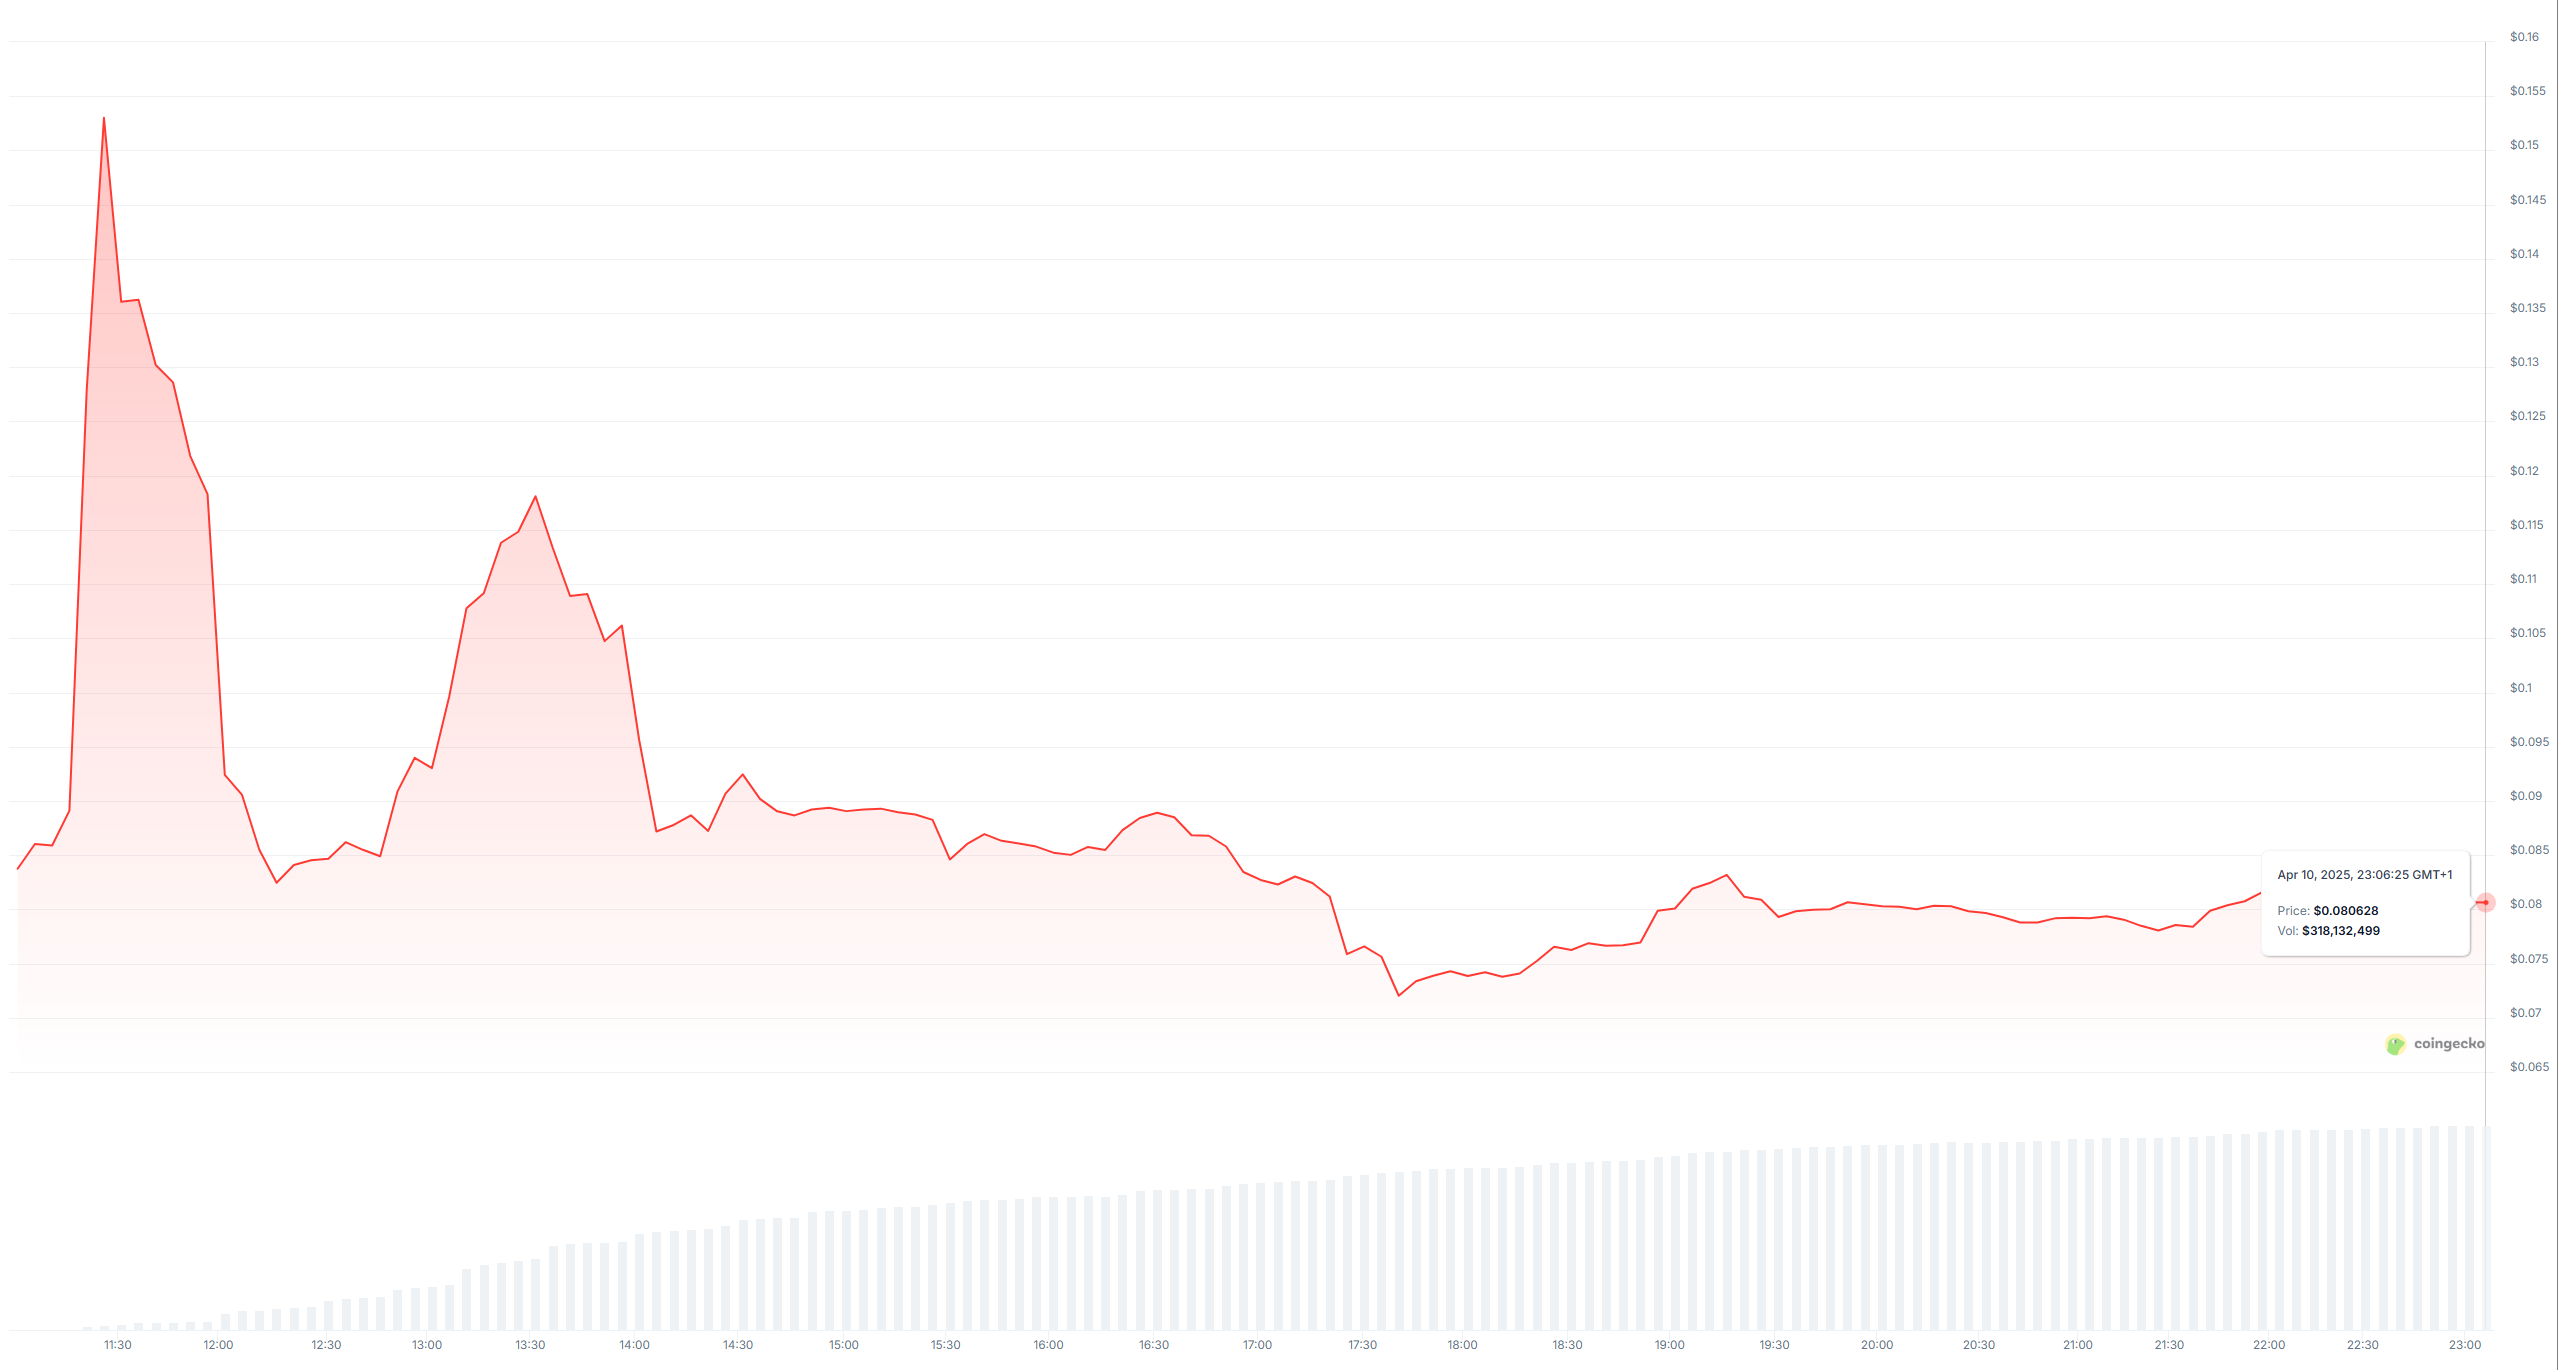
Babylon launched its BABY token today after a brief delay from Binance. The toke quickly surged 40% to hit $0.15. driven by the listing hype, but airdrop sell-offs and profit-taking saw BABY crash shortly after.
Over the past week, Babylon’s airdrop has been subjected to much controversy. At the time of reporting, the token’s market cap stands just below $185 million.
BABY Airdrop and Token Launch
Token staking is a popular way to gain passive income in the space, and it’s growing noticeably. Last year, Babylon began offering Bitcoin staking and added on-chain yields soon after.
Today, Babylon launched its new BABY token, which began trading on Binance.
“Binance is excited to announce that Babylon (BABY) will be added to Binance Simple Earn, ‘Buy Crypto,’ Binance Convert, Binance Margin, and Binance Futures,” the exchange claimed in its announcement.
Binance, the world’s largest crypto exchange, was a natural candidate for Babylon’s BABY launch. It dominates the vast majority of crypto airdrops, and it offers very popular listings. The firm had to delay the official launch for a few hours, but it went off smoothly.
BABY was also listed by several other exchanges, including MEXC, which conducted an exclusive BTC Fixed Saving Event offering an Annual Percentage Rate (APR) of up to 99% in anticipation of the BABY token listing.
Babylon is a decentralized protocol that enables native, self-custodial Bitcoin staking. It allows holders to stake directly on the Bitcoin network to enhance security without relinquishing control of their assets.
Last week, the project airdropped 600 million tokens ahead of the token launch. The initial airdrop represented 6% of the total supply of BABY tokens, which were distributed to early adopters in several categories.
These include Phase 1 stakers, Pioneer Pass NFT holders, and contributing developers.
However, shortly after this airdrop, over $21 million worth of Bitcoin was unstaked from the Babylon protocol within 24 hours.
Increasing Concerns About Tokenomics
Also, its tokenomics indicate that nearly 66% of the total supply is controlled by insiders or the foundation. The substantial allocation raises concerns about potential centralization and the influence insiders may have on the project’s future.
Yet, there are community members refuting these concerns and backing the project. While insider allocation is high, access to that allocation is gated and structured to avoid market abuse.
Compared to recent examples where insiders had early staking rights and sold off rewards, such as EigenLayer, Babylon has deliberately built protections into its tokenomics to maintain fairness and avoid token dumping dynamics.
VCs, team, and advisors have no token unlocks in Year 1. This prevents early investors from front-running the market and dumping tokens during the protocol’s most fragile growth phase.
Most importantly, locked insider tokens are not allowed to be staked, which is rare.
Overall, the long-term performance of the token will reflect how sustainable this tokenomics is. Babylon’s approach to Bitcoin staking has gained significant attention, but the airdrop and subsequent unstaking activities highlight the dynamic nature of user engagement in response to incentive programs
Disclaimer
In adherence to the Trust Project guidelines, BeInCrypto is committed to unbiased, transparent reporting. This news article aims to provide accurate, timely information. However, readers are advised to verify facts independently and consult with a professional before making any decisions based on this content. Please note that our Terms and Conditions, Privacy Policy, and Disclaimers have been updated.

The SEC and Ripple filed a joint motion today, asking a US Appeals Court to halt any appeals and cross-appeals between the two parties. This is a prelude to a formal settlement, which both parties are inclined towards.
The filing notes that any further procedural developments may take up to 60 days despite expectations that the outcome is largely predetermined. In the meantime, the XRP market appears to have priced in the likelihood of a resolution.
Ripple and The SEC Move To Settle
The SEC vs Ripple case has been one of crypto’s most important legal battles over the last few years. After months of hints and credible rumors, the Commission finally dropped its lawsuit last month.
Today, both parties are getting close to a final agreement, filing a joint motion regarding one of the case’s remaining loose ends:
“The parties have filed a joint motion to hold the appeal in abeyance based on the parties’ agreement to settle. The settlement is awaiting Commission approval. No brief will be filed on April 16th,” claimed James Filan, a lawyer and Ripple supporter who is in no way directly affiliated with the firm’s legal efforts.
Specifically, the loose end between Ripple and the SEC regards Ripple’s cross-appeal, which was filed last October. With this new joint motion, the two parties have “reached an agreement-in-principle” to resolve all outstanding business.
This includes the SEC’s initial appeal, the aforementioned cross-appeal, and any other claims involving individual actors.
Technically, both parties publicly announced that they were ready to settle over two weeks ago. It’s unclear why Ripple and the SEC took so long to file this joint motion.
The price of XRP has persistently been less impacted by lawsuit updates since the comission first dropped its case, and this development seems fully priced in.
The joint motion also mentions that further progress may take another 60 days. When they completely finalize a settlement, it could likely have landmark implications for US crypto policy.
However, based on the way that the SEC is improving relations with Ripple, Coinbase, Kraken, etc., a favorable outcome seems extremely likely.
Disclaimer
In adherence to the Trust Project guidelines, BeInCrypto is committed to unbiased, transparent reporting. This news article aims to provide accurate, timely information. However, readers are advised to verify facts independently and consult with a professional before making any decisions based on this content. Please note that our Terms and Conditions, Privacy Policy, and Disclaimers have been updated.

How SEC Chair Paul Atkins Will Reset US Crypto Policy

Controversy Follows Babylon’s BABY Token Launch and Airdrop

Ripple And The SEC File Joint Motion for Final Settlement

Ethereum Price Climbs, But Key Indicators Still Flash Bearish

ADA Price Surge Signals a Potential Breakout

Bitcoin Holders are More Profitable Than Ethereum Since 2023

2.52 Million Altcoins Are Ruining Crypto’s Future

Animoca Brands Valuation Tanks 75% In Two Years, Here’s Why

Crypto exchange BingX hacked for $43 million

Are The Big Players Losing Interest?

Hong Kong’s Securities Association Tips Authorities On Crypto Self-Regulation

Coinbase cbBTC Set to go Live on Solana
2.52 Million Altcoins Are Ruining Crypto’s Future
Animoca Brands Valuation Tanks 75% In Two Years, Here’s Why
Crypto exchange BingX hacked for $43 million
Are The Big Players Losing Interest?
Hong Kong’s Securities Association Tips Authorities On Crypto Self-Regulation
Coinbase cbBTC Set to go Live on Solana
-

 Market21 hours ago
Bitcoin Rallies After Trump Pauses Tariff—Crypto Markets Cheer the Move
-

 Market20 hours ago
THORWallet CEO Explains Why DeFi is Here to Stay
-

 Altcoin20 hours ago
Most Altcoins Now In ‘Opportunity’ Zone, Santiment Reveals
-

 Market23 hours ago
Solana (SOL) Drops 4% as Selling Pressure Intensifies
-
 Altcoin23 hours ago
Argentina Opens LIBRA Investigation, Top Officials May Be Implicated
-
 Market22 hours ago
Top 3 Exchange Tokens to Keep An Eye For April 2025
-
 Market19 hours ago
Experts Reveal What Could Drive Ethereum’s Price Recovery
-

 Market17 hours ago
Is Trump’s Tariff Delay Masking a Crypto Dead Cat Bounce?