
Bitcoin
Bitcoin Whales Load Their Bags: $1.7 Billion In BTC Flow Out Of Exchanges
The price of Bitcoin — and the general market — started the week with one of the largest declines they have seen in 2024. While this broad market downturn resulted in widespread fear and panic amongst crypto enthusiasts, it appears that many investors took the opportunity to amass more digital assets at low prices.
According to the latest on-chain data, significant amounts of Bitcoin have moved out of cryptocurrency exchanges. The question here is — what does this mean and how does it affect the BTC price?
Are Investors Backing The Bull Run To Continue?
According to recent data from IntoTheBlock, more than 28,000 BTC (worth over $1.7 Billion) were transferred out of crypto exchanges in the past week. This on-chain revelation is based on changes in the Netflows metric, which monitors the amount of a particular cryptocurrency sent in and out of centralized exchanges.
An increase in the Netflows’ value (or when it is positive) signals that more funds are entering than leaving crypto exchanges. On the other hand, when the metric’s value falls below, it implies that more crypto assets are flowing out of than into trading platforms.
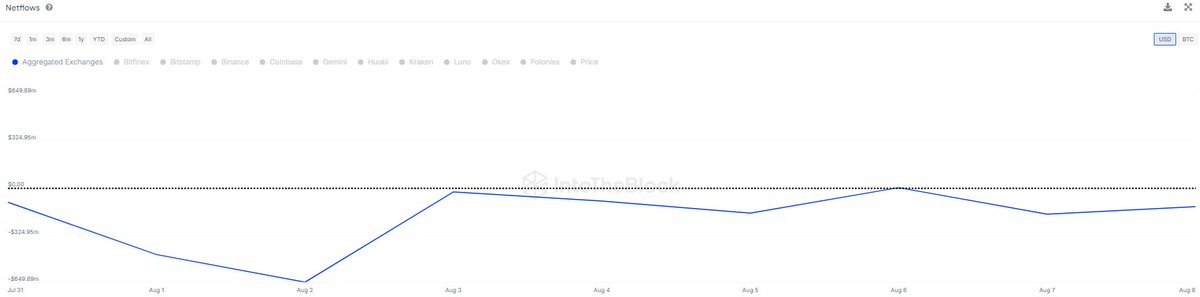
Source: IntoTheBlock
As shown in the chart above, the Netflows metric for Bitcoin has been on a decline over the past few days, implying that large investors have been transferring their assets from centralized exchanges. According to IntoTheBlock, the $1.7 billion in BTC withdrawn in the last seven-day period is the largest outflow seen within this timeframe so far in 2024.
Although it is difficult to tell the rationale behind this massive exodus, crypto movements of this magnitude away from centralized exchanges typically indicate a shift in investor sentiment. It suggests a change in holding strategy or even fresh accumulation by large investors, showing their faith in the long-term promise of Bitcoin.
Moreover, the decline in the availability of the premier cryptocurrency on trading platforms could result in a supply crunch. Ultimately, this fall in BTC’s exchange reserve may trigger a surge in the Bitcoin price.
Bitcoin Price At A Glance
Following a steep decline from above $64,000 to $48,000 on Monday, August 5, the price of Bitcoin has shown great resilience in the past week, fighting its way back above the $62,000 level.
As of this writing, the premier cryptocurrency stands at around $60,400, reflecting a 1% price decline in the last 24 hours. Meanwhile, data from CoinGecko shows that BTC is still down by over 3% this week.
The price of Bitcoin hovering around the $60,000 mark on the daily timeframe | Source: BTCUSDT chart on TradingView
Featured image from iStock, chart from TradingView


Following the events of the past week, it is more of a matter of “when” rather than of “if” the Bitcoin price will hit a historic six-figure value. The crypto commentary channels and waves have been largely occupied with the premier cryptocurrency potentially reaching $100,000 over the last few weeks.
A six-figure value for BTC is not only an impressive milestone for the entire crypto industry but also one that comes with “unfavorable” events such as liquidations for short traders. Here is an on-chain insight into “what next” if the Bitcoin price climbs above $100,000.
What’s Next For BTC’s Price After $100,000?
In a recent report, blockchain analytics firm Glassnode shared an insight into the on-chain performance of the premier cryptocurrency since starting its latest rally. While the $100,000 price mark seems inevitable, the blockchain firm expects Bitcoin price to lose some of its momentum after crossing the target.
One of the rationales behind this projection lies in the recent behavior of an investor cohort known as the Long-term holders (LTH). According to Glassnode, the long-term holders are beginning to offload their assets for profits and may be waiting to sell more coins as the price action continues to grow strong.
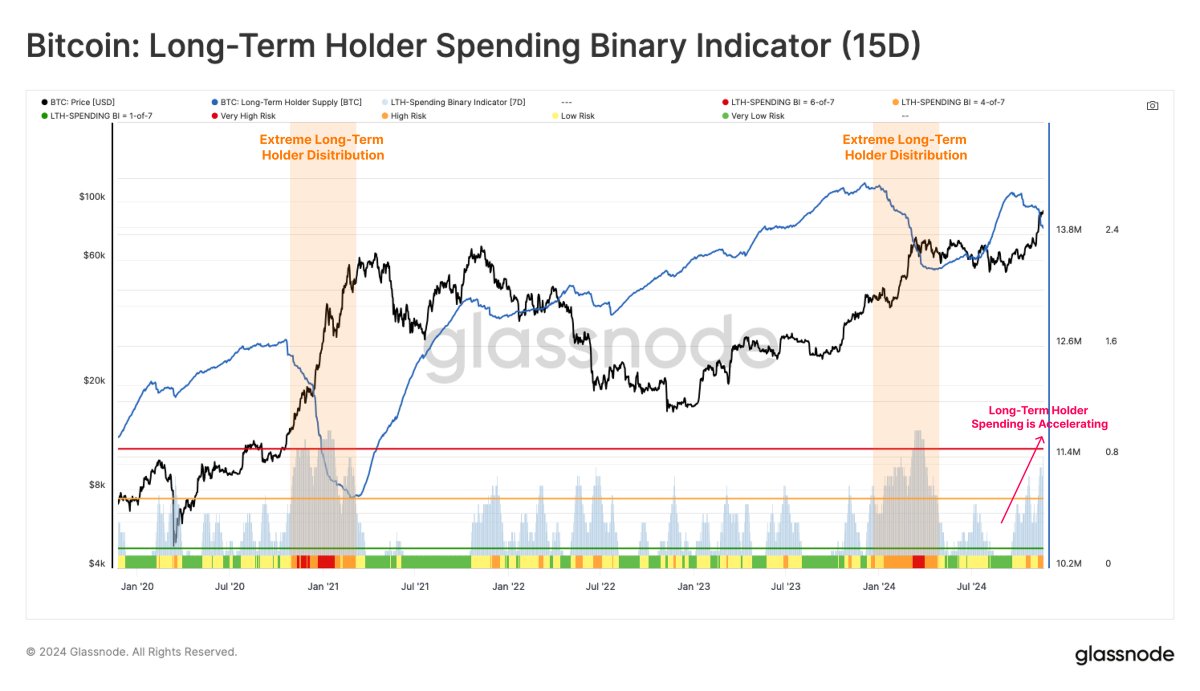
Source: Glassnode/X
Based on data from the LTH Spending Binary Indicator, which tracks the intensity of the sell-side pressure of the long-term holders, these major investors have been increasingly distributing their assets. This Spending Binary metric shows that the LTH balance has declined on 11 of the last 15 days.
While the demand from institutional investors, specifically via the US spot exchange-traded funds (ETFs), has absorbed 90% of the sell-side pressure from long-term investors, Glassnode noted that the spending pressure of this investor cohort has begun to outpace ETF net inflows in recent days. This pattern was also noticed earlier in February 2024.
According to Glassnode, if the sell-side pressure continues to outpace the ETF demand, it could result in short-term price volatility or lead to price consolidation. The on-chain firm said:
However, since 13 November, LTH sell-side pressure has begun to outpace ETF net inflows, echoing a pattern observed in late February 2024, where the imbalance between supply and demand led to increased market volatility, and consolidation.
$1.89 Billion To Be Liquidated If Bitcoin Price Crosses This Level
In a November 22 post on X, prominent crypto analyst Ali Martinez sounded a warning to the Bitcoin bears. According to data from CoinGlass, a massive $1.89 billion looks set for liquidation if the Bitcoin price hits $100,625.
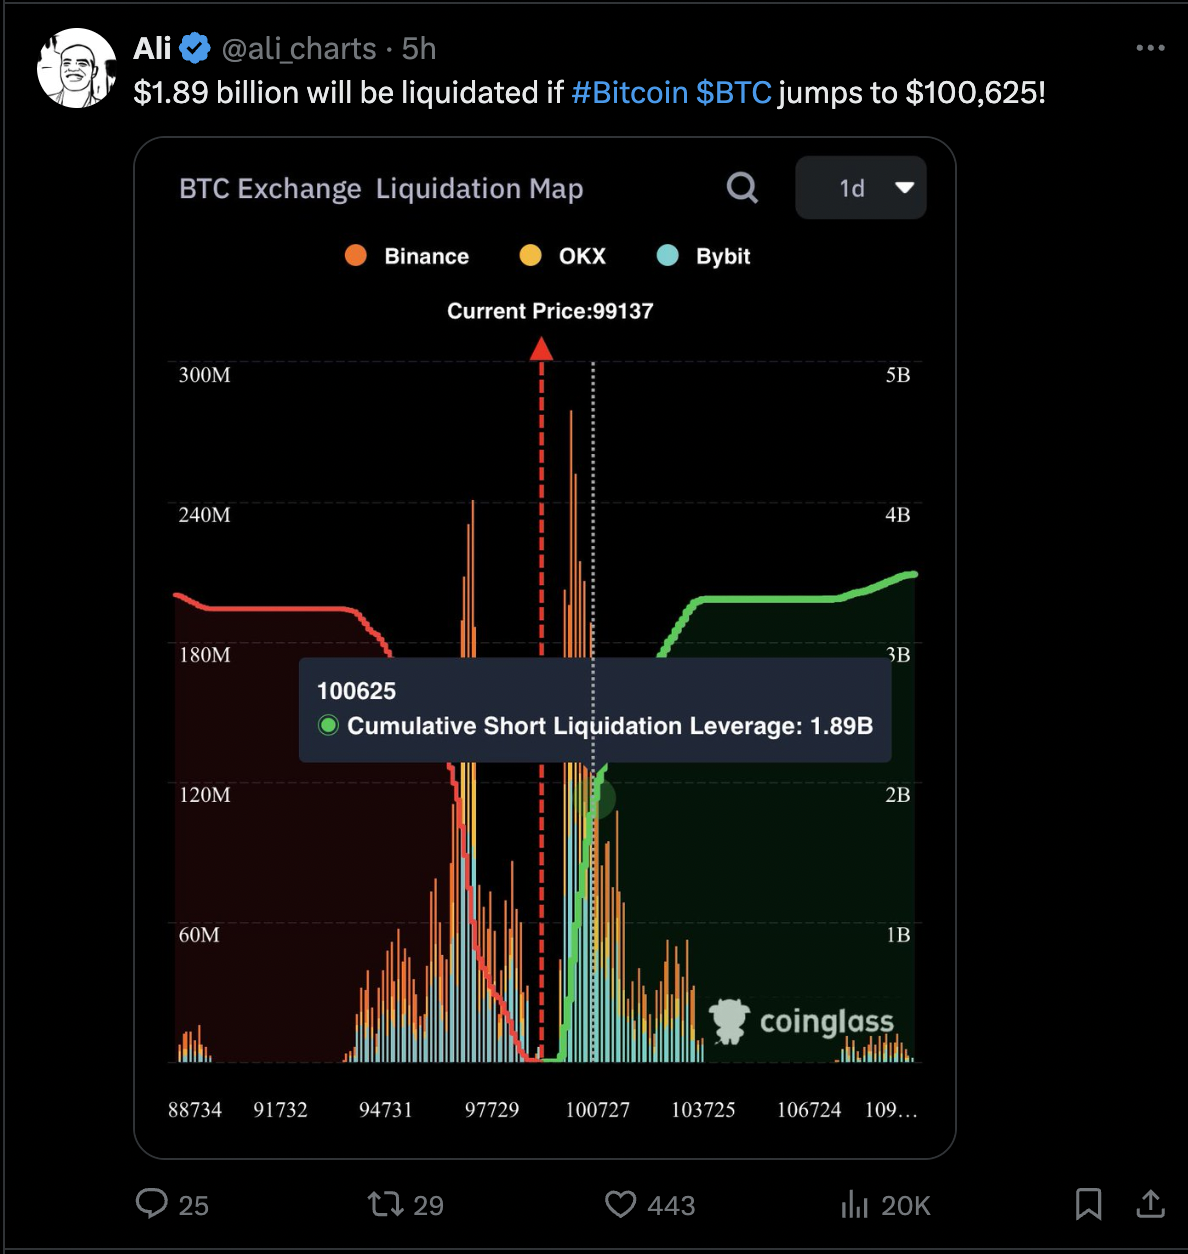
Source: Ali_charts/X
As of this writing, the premier cryptocurrency is valued at $99,424, reflecting a 1.4% price increase in the past day. Data from CoinGecko shows that the Bitcoin price has been on a much more impressive run on the weekly timeframe, surging by nearly 10% in the past seven days.
The price of Bitcoin on the daily timeframe | Source: BTCUSDT chart on TradingView
Featured image from iStock, chart from TradingView

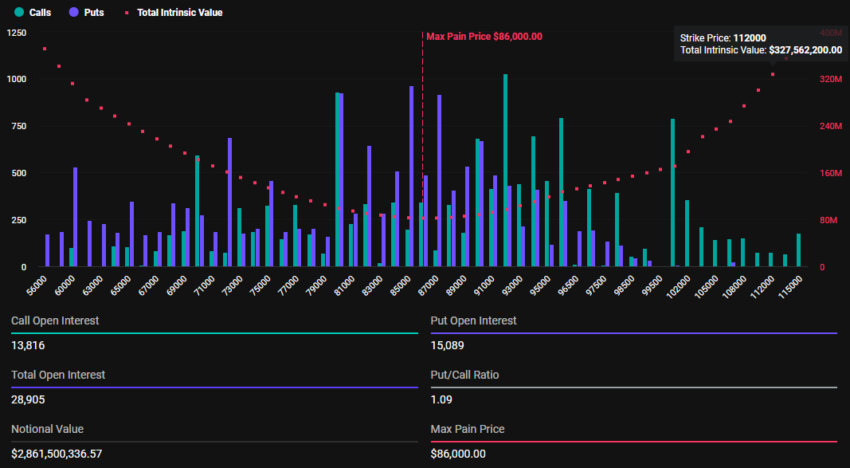
Crypto markets will witness $3.42 billion in Bitcoin and Ethereum options contracts expire today. The massive expiration could cause a short-term price impact, particularly as markets wait expectantly for Bitcoin to tag $100,000.
With Bitcoin options valued at $2.86 billion and Ethereum at $561.66 million, traders are bracing for potential volatility.
Unlike Ethereum, Traders Bet On Bitcoin Price Pullback
There has been a significant increase in Bitcoin (BTC) and Ethereum (ETH) contracts due for expiry today compared to last week. According to Deribit data, 28,905 Bitcoin options contracts will expire on Friday with a put-to-call ratio of 1.09 and a maximum pain point of $86,000.
On the other hand, 164,687 Ethereum contracts are due for expiry today, with a put-to-call ratio of 0.66 and a maximum pain point of $3,050.
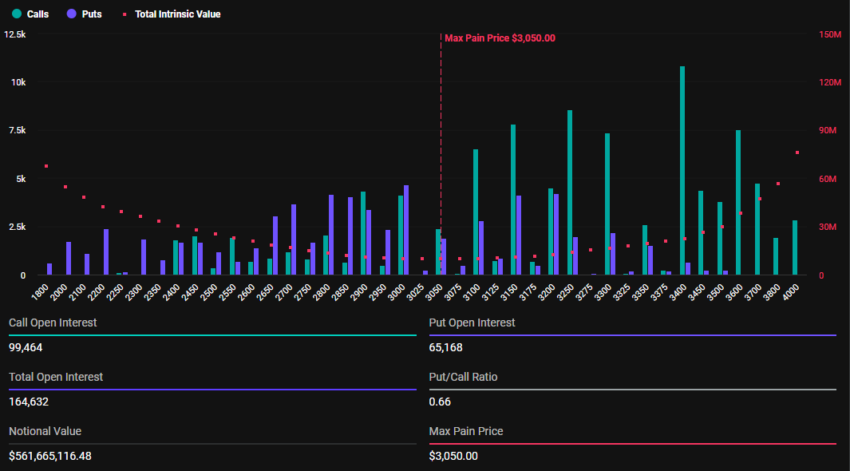
Bitcoin’s Put-to-call ratio stands above 1, indicating a generally bearish sentiment despite BTC’s whales and long-term holders fueling its recent growth. In comparison, Ethereum counterparts have a put-to-call ratio of 0.66, reflecting a generally bullish market outlook.
The put-to-call ratio gauges market sentiment. Put options represent bets on price declines, whereas call options point to bets on price increases.
When this ratio is above 1, it suggests a lack of optimism in the market, with more traders betting on price decreases. On the other hand, a put-to-call ratio below 1 suggests optimism in the market, and more traders are betting on price increases.
Bitcoin’s Put-to-Call Ratio, Implications for BTC
As options near expiration, traders are betting on BTC prices dropping and ETH prices rising. According to the Max Pain Theory in options trading, BTC and ETH could each pull toward their maximum pain points (strike prices) of $86,000 and $3,050, respectively. Here, the largest number of contracts — both calls and puts — would expire worthless.
Notably, price pressure for both assets will ease after Deribit settles contracts at 08:00 UTC today. At the time of writing, however, BTC was trading for $98,876, whereas ETH was exchanging hands for $3,389. Meanwhile, in line with put-to-call ratios, analysts at Greeks.live anticipate an extended move north for ETH and say BTC is at the cusp of a correction.
“With about 8% of positions expiring this week, the big rally in Ethereum has led to a significant increase in ETH major term options IV [implied volatility], while BTC major term options IV has remained relatively stable. The market sentiment remains extremely optimistic at this point,” Greeks.live analysts said.
The analysts also note that while Bitcoin risks a correction, the generalized market rally keeps this potential pullback at bay. They ascribe the positive sentiment in the market to significant capital inflows into ETFs (exchange-traded funds), specifically BlackRock’s IBIT options, which started to trade only recently alongside a strongly driven spot bull market.
Nevertheless, with today’s high-volume expiration, traders should anticipate fluctuations in Bitcoin and Ethereum prices that could shape their short-term trends.
Disclaimer
In adherence to the Trust Project guidelines, BeInCrypto is committed to unbiased, transparent reporting. This news article aims to provide accurate, timely information. However, readers are advised to verify facts independently and consult with a professional before making any decisions based on this content. Please note that our Terms and Conditions, Privacy Policy, and Disclaimers have been updated.

Marathon Digital Holdings, one of the largest Bitcoin miners, has completed a record $1 billion offering of 0% convertible senior notes due 2030. The net proceeds from the sale were approximately $980 million.
According to the firm’s statement, the net proceeds will be primarily used to buy Bitcoin.
Marathon Digital Holds over $2.5 Billion Worth of Bitcoin
After its last purchase in September, Marathon Digital’s Bitcoin holdings stand at 25,945 BTC. This is currently worth approximately $2.52 billion, as Bitcoin reached an all-time high of $98,000 earlier today.
However, the company’s decision to expand its holdings potentially points to a larger bullish cycle for the token in the long term. According to its press release, Marathon Digital plans to use $199 million of the net proceeds to repurchase existing convertible notes due 2026.
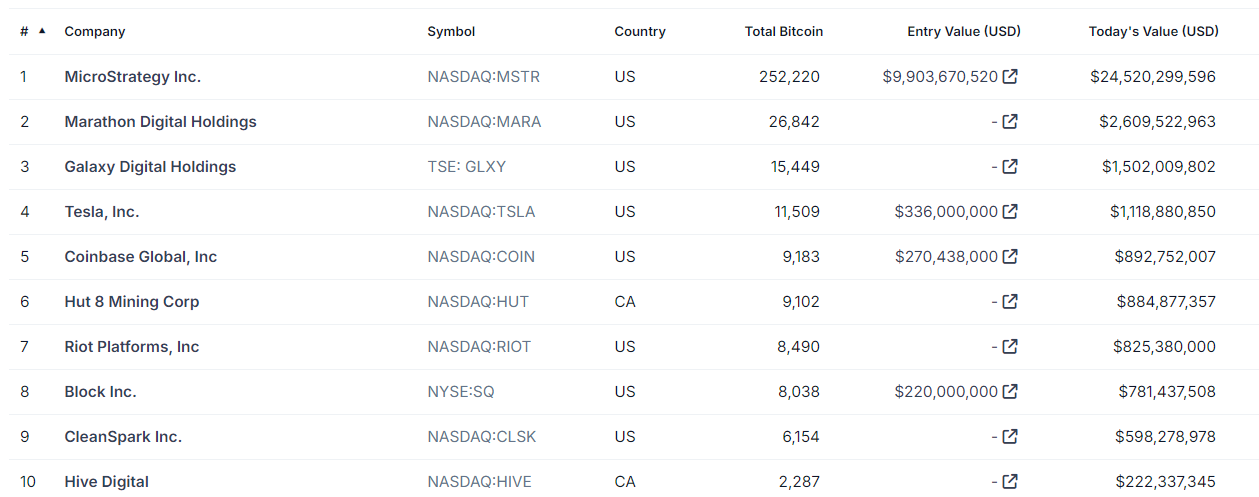
The remainder will be used to acquire additional Bitcoin and for general corporate purposes. Marathon Digital is currently the second largest Bitcoin holder among publicly traded companies.
The notes offer flexibility, with options for conversion into cash, shares of Marathon’s common stock, or a combination of both. Redemption terms include the ability for the company to redeem the notes at full principal value plus accrued interest.
“$1 Billion. 0% interest. MARA has completed the largest convertible notes offering ever amongst BTC miners. The mission, as always: Provide value. Acquire #bitcoin,” the company wrote on X (formerly Twitter).
Increasing Bitcoin Acquisition Among Public Firms
Marathon Digital is following an ongoing trend of public companies increasing their Bitcoin holdings in this bull market. Earlier this week, MicroStrategy announced plans to issue $1.75 billion in convertible notes maturing in 2029. The proceeds will be used to fund additional Bitcoin purchases.
On the same day, the company secured $4.6 billion worth of Bitcoin, building on a $2 billion acquisition from the prior week.
Bitcoin’s all-time high and these aggressive purchases propelled MicroStrategy’s stock price by nearly 120% in a single month. The largest Bitcoin holder also entered the list of top 100 public companies in the US.
Meanwhile, Marathon Digital has faced challenges despite its growing Bitcoin reserves. The company reported a $125 million net loss in Q3. This was driven by a $92 million year-over-year increase in operating costs.
However, its operational capacity has strengthened. Earlier this month, its energized hash rate surged by 93%, signaling increased mining efficiency. Marathon Digital also signed an $80 million agreement with the Keynan government to expand its Bitcoin mining capabilities.
Disclaimer
In adherence to the Trust Project guidelines, BeInCrypto is committed to unbiased, transparent reporting. This news article aims to provide accurate, timely information. However, readers are advised to verify facts independently and consult with a professional before making any decisions based on this content. Please note that our Terms and Conditions, Privacy Policy, and Disclaimers have been updated.

Bitcoin Price To $100,000? Here’s What To Expect If BTC Makes History

Exploring Hottest New Coins: FINE, CHILLGUY, and CHILLFAM

XRP To Hit $40 In 3 Months But On This Condition – Analyst

XRP Price To $28: Wave Analysis Reveals When It Will Reach Double-Digits

Kraken Eyes Token Expansion as Trump Promises Crypto Support

Why BTC Miners Are Selling Their Coins

2.52 Million Altcoins Are Ruining Crypto’s Future

Animoca Brands Valuation Tanks 75% In Two Years, Here’s Why

Crypto exchange BingX hacked for $43 million

Are The Big Players Losing Interest?

Hong Kong’s Securities Association Tips Authorities On Crypto Self-Regulation

Coinbase cbBTC Set to go Live on Solana
2.52 Million Altcoins Are Ruining Crypto’s Future
Animoca Brands Valuation Tanks 75% In Two Years, Here’s Why
Crypto exchange BingX hacked for $43 million
Are The Big Players Losing Interest?
Hong Kong’s Securities Association Tips Authorities On Crypto Self-Regulation
Coinbase cbBTC Set to go Live on Solana
-

 Market23 hours ago
ADA Sights More Growth After Breaking $0.8119
-

 Altcoin23 hours ago
BTC at $98K, HBAR Surges 25% and XLM rises 55%
-

 Market16 hours ago
Trump Taps Pro-Crypto Scott Bessent for Treasury Secretary Role
-
 Altcoin16 hours ago
Terra Luna Classic Community Discord On Proposal Amid LUNC Price Rally
-
 Market15 hours ago
Artificial Intelligence Coins on the Rise: TFUEL, ZIG, and AKT
-
 Altcoin15 hours ago
Alameda Research Dumping Polygon (POL) Amid Price Spike, What’s Next?
-
 Altcoin20 hours ago
Ripple CEO Shares Bullish News With XRP Army As Trump Names Treasury Secretary
-
 Altcoin17 hours ago
Arthur Hayes Shills Another Solana Meme Coin, Price Rallies