
Market
How Notcoin (NOT) Price Can Gain from Rising Market Interest

The price of the native token of the popular Telegram-based tap-to-earn game Notcoin (NOT) increased by 24.93% in the last 24 hours. This surge comes after the token initially reached a two-month low of $0.0082 on August 5.
The market will want to know whether NOT’s price will continue to increase. This analysis provides context in this regard and also reveals what traders are doing.
Market Takes Notcoin’s Comeback as a Good Sign
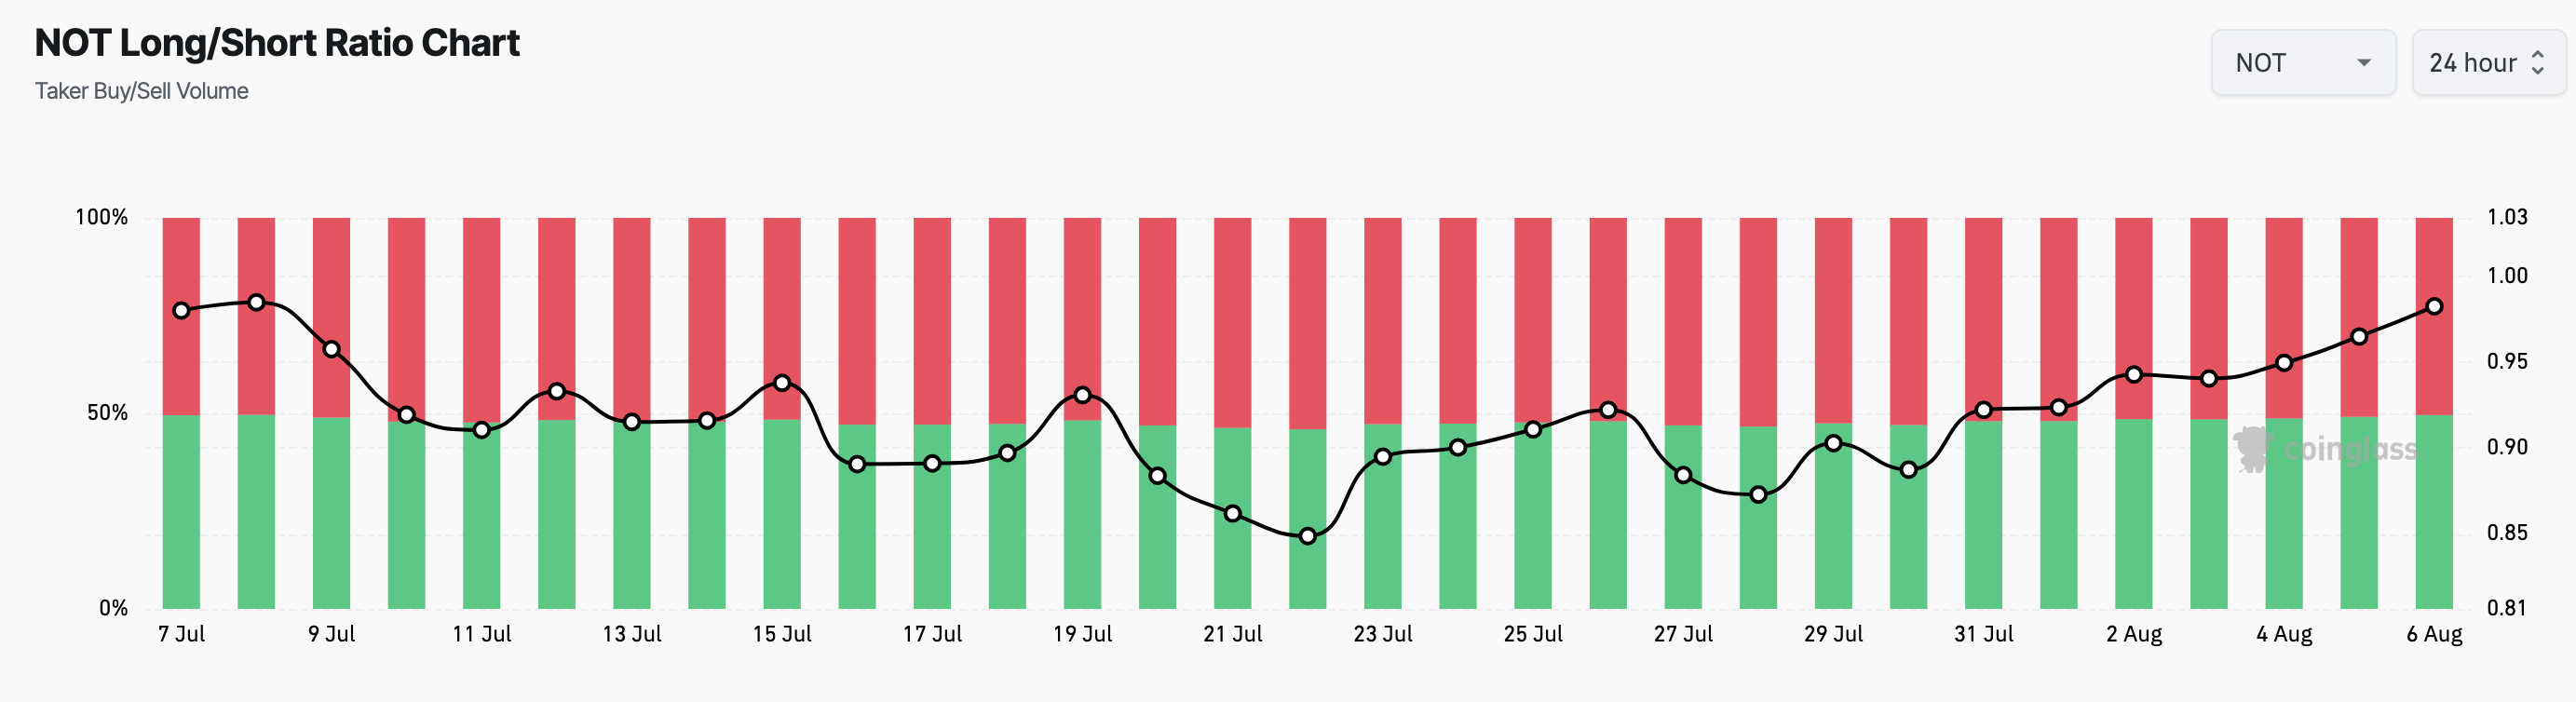
One way of knowing the position of traders is by looking at the Long/Short Ratio. This ratio represents the proportion of longs (buyers) to shorts (sellers) in the market. With the ratio, one can have an idea of investors’ sentiment in the market
When the Long/Short ratio rises, it means there are more long positions than shorts in the market, indicating that most traders expect the price to rise. However, a falling ratio suggests bearish anticipation.
Data from Coinglass shows that the ratio in NOT’s case has been increasing, suggesting that many traders have positioned themselves to profit from Notcoin’s continued hike.
Read more: Top 7 Telegram Tap-to-Earn Games to Play in 2024
Furthermore, on-chain data obtained from Santiment shows an increase in Open Interest (OI) as well. OI refers to the sum of all open contracts in the market, and it increases or decreases based on net positioning.
When the OI decreases, market participants are adding more liquidity to the market and increasing their positioning. However, a decrease implies a rise in position closure.
For NOT, the rise in Open Interest that buyers are more aggressive. If sustained, this rise in speculative activity could help the cryptocurrency sustain the price increase. For instance, historical data traced back to June shows that a rise in Open Interest helps NOT price increase.
During that period, NOT’s price reached an all-time high of $0.028 as the OI jumped above $220 million.
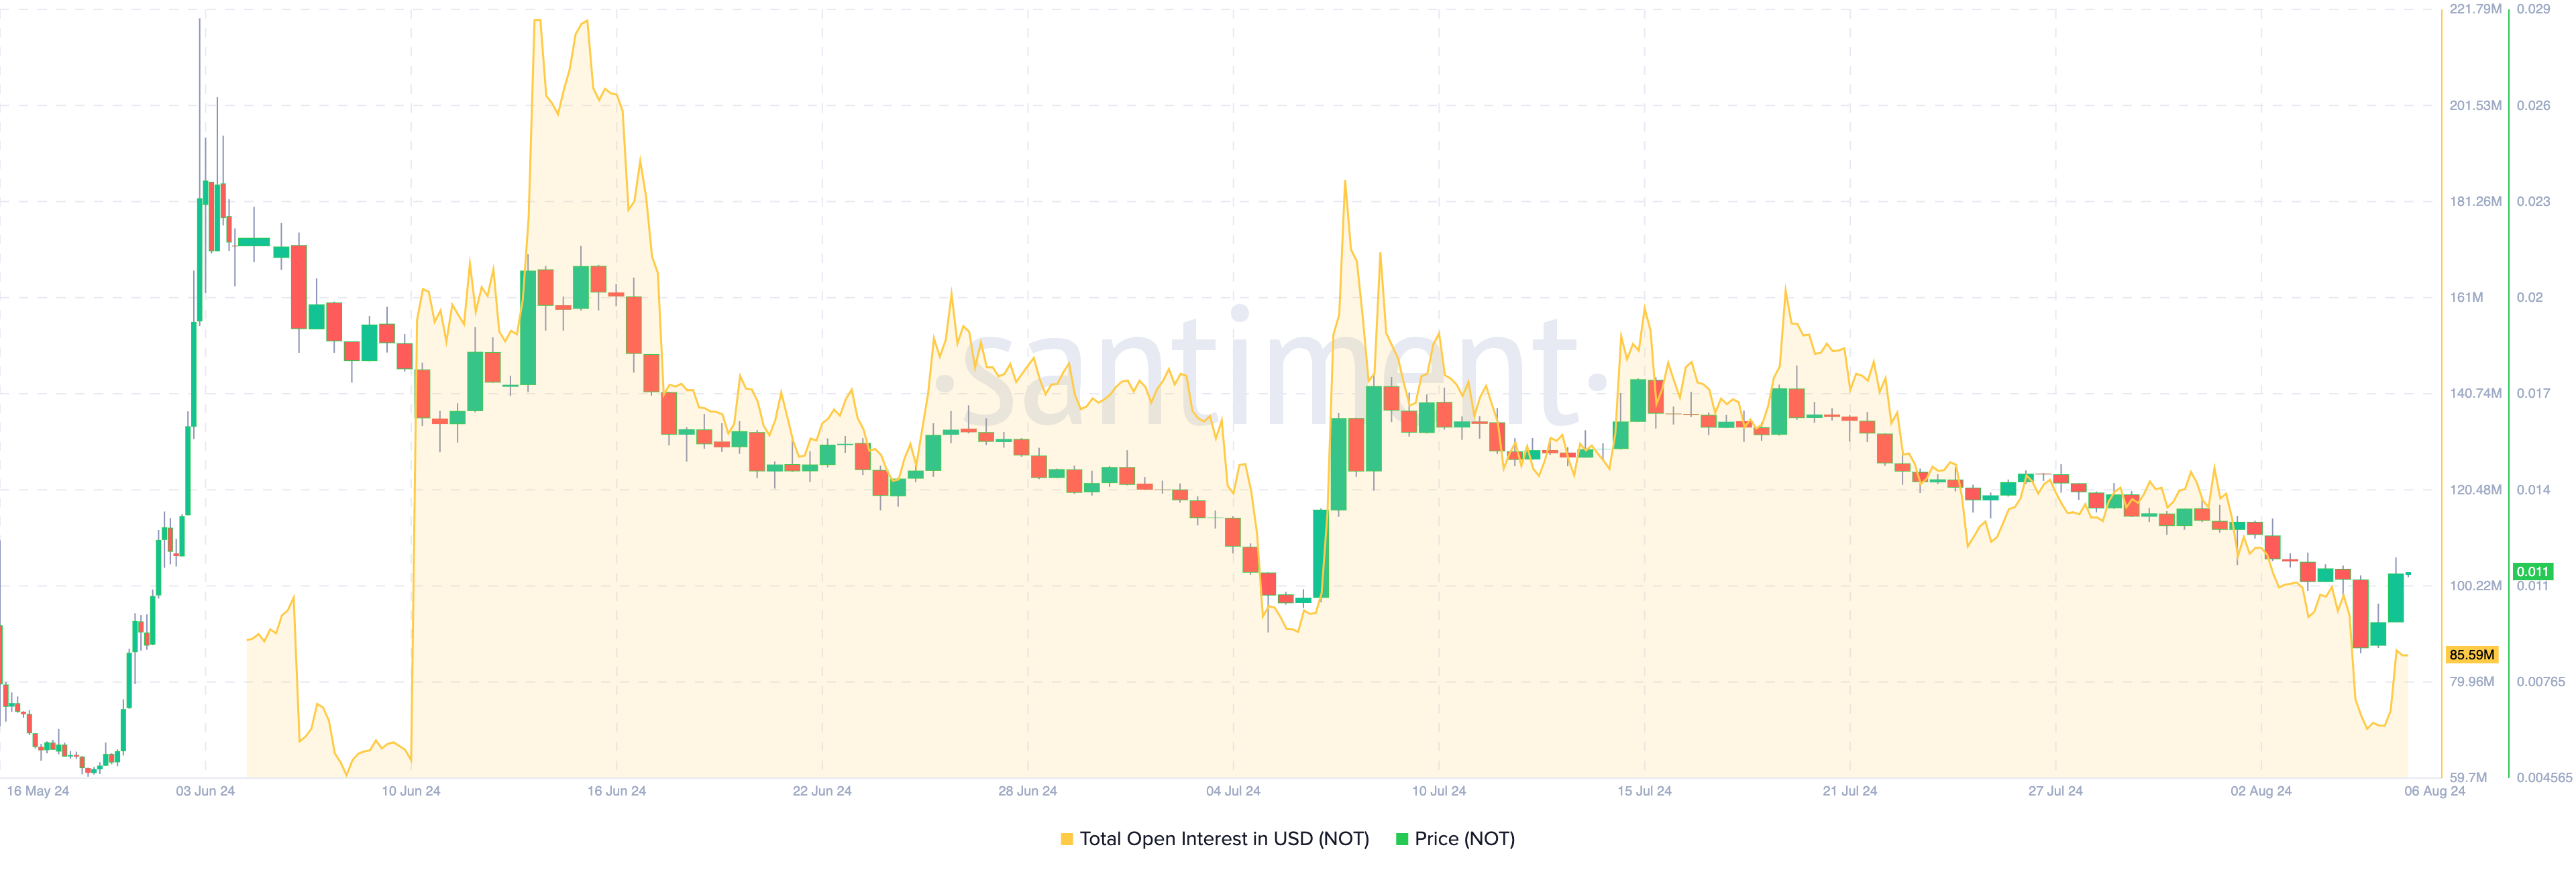
Subsequent short-lived hikes also reveal a surge in Open Interest, further proving the strong correlation between the price and indicator. Therefore, if NOT experience a substantial rise in this indicator, the value of the token may exceed $0.11 by a wide margin.
NOT Price Prediction: Buying Pressure Returns
The technical point of view shows that Notcoin’s market structure is slowly heading out of bearish dominance. One indicator fueling this bias is the Cumulative Volume Delta (CVD).
For context, the cumulative volume delta (CVD) represents the net difference between buying and selling volume in the spot market. When CVD is negative, as it was on August 5, it indicates a high rate of selling. However, as of press time, the spot CVD has returned to positive, signaling that market participants have bought the dip.
Read more: Notcoin (NOT) Price Prediction 2024/2025/2030
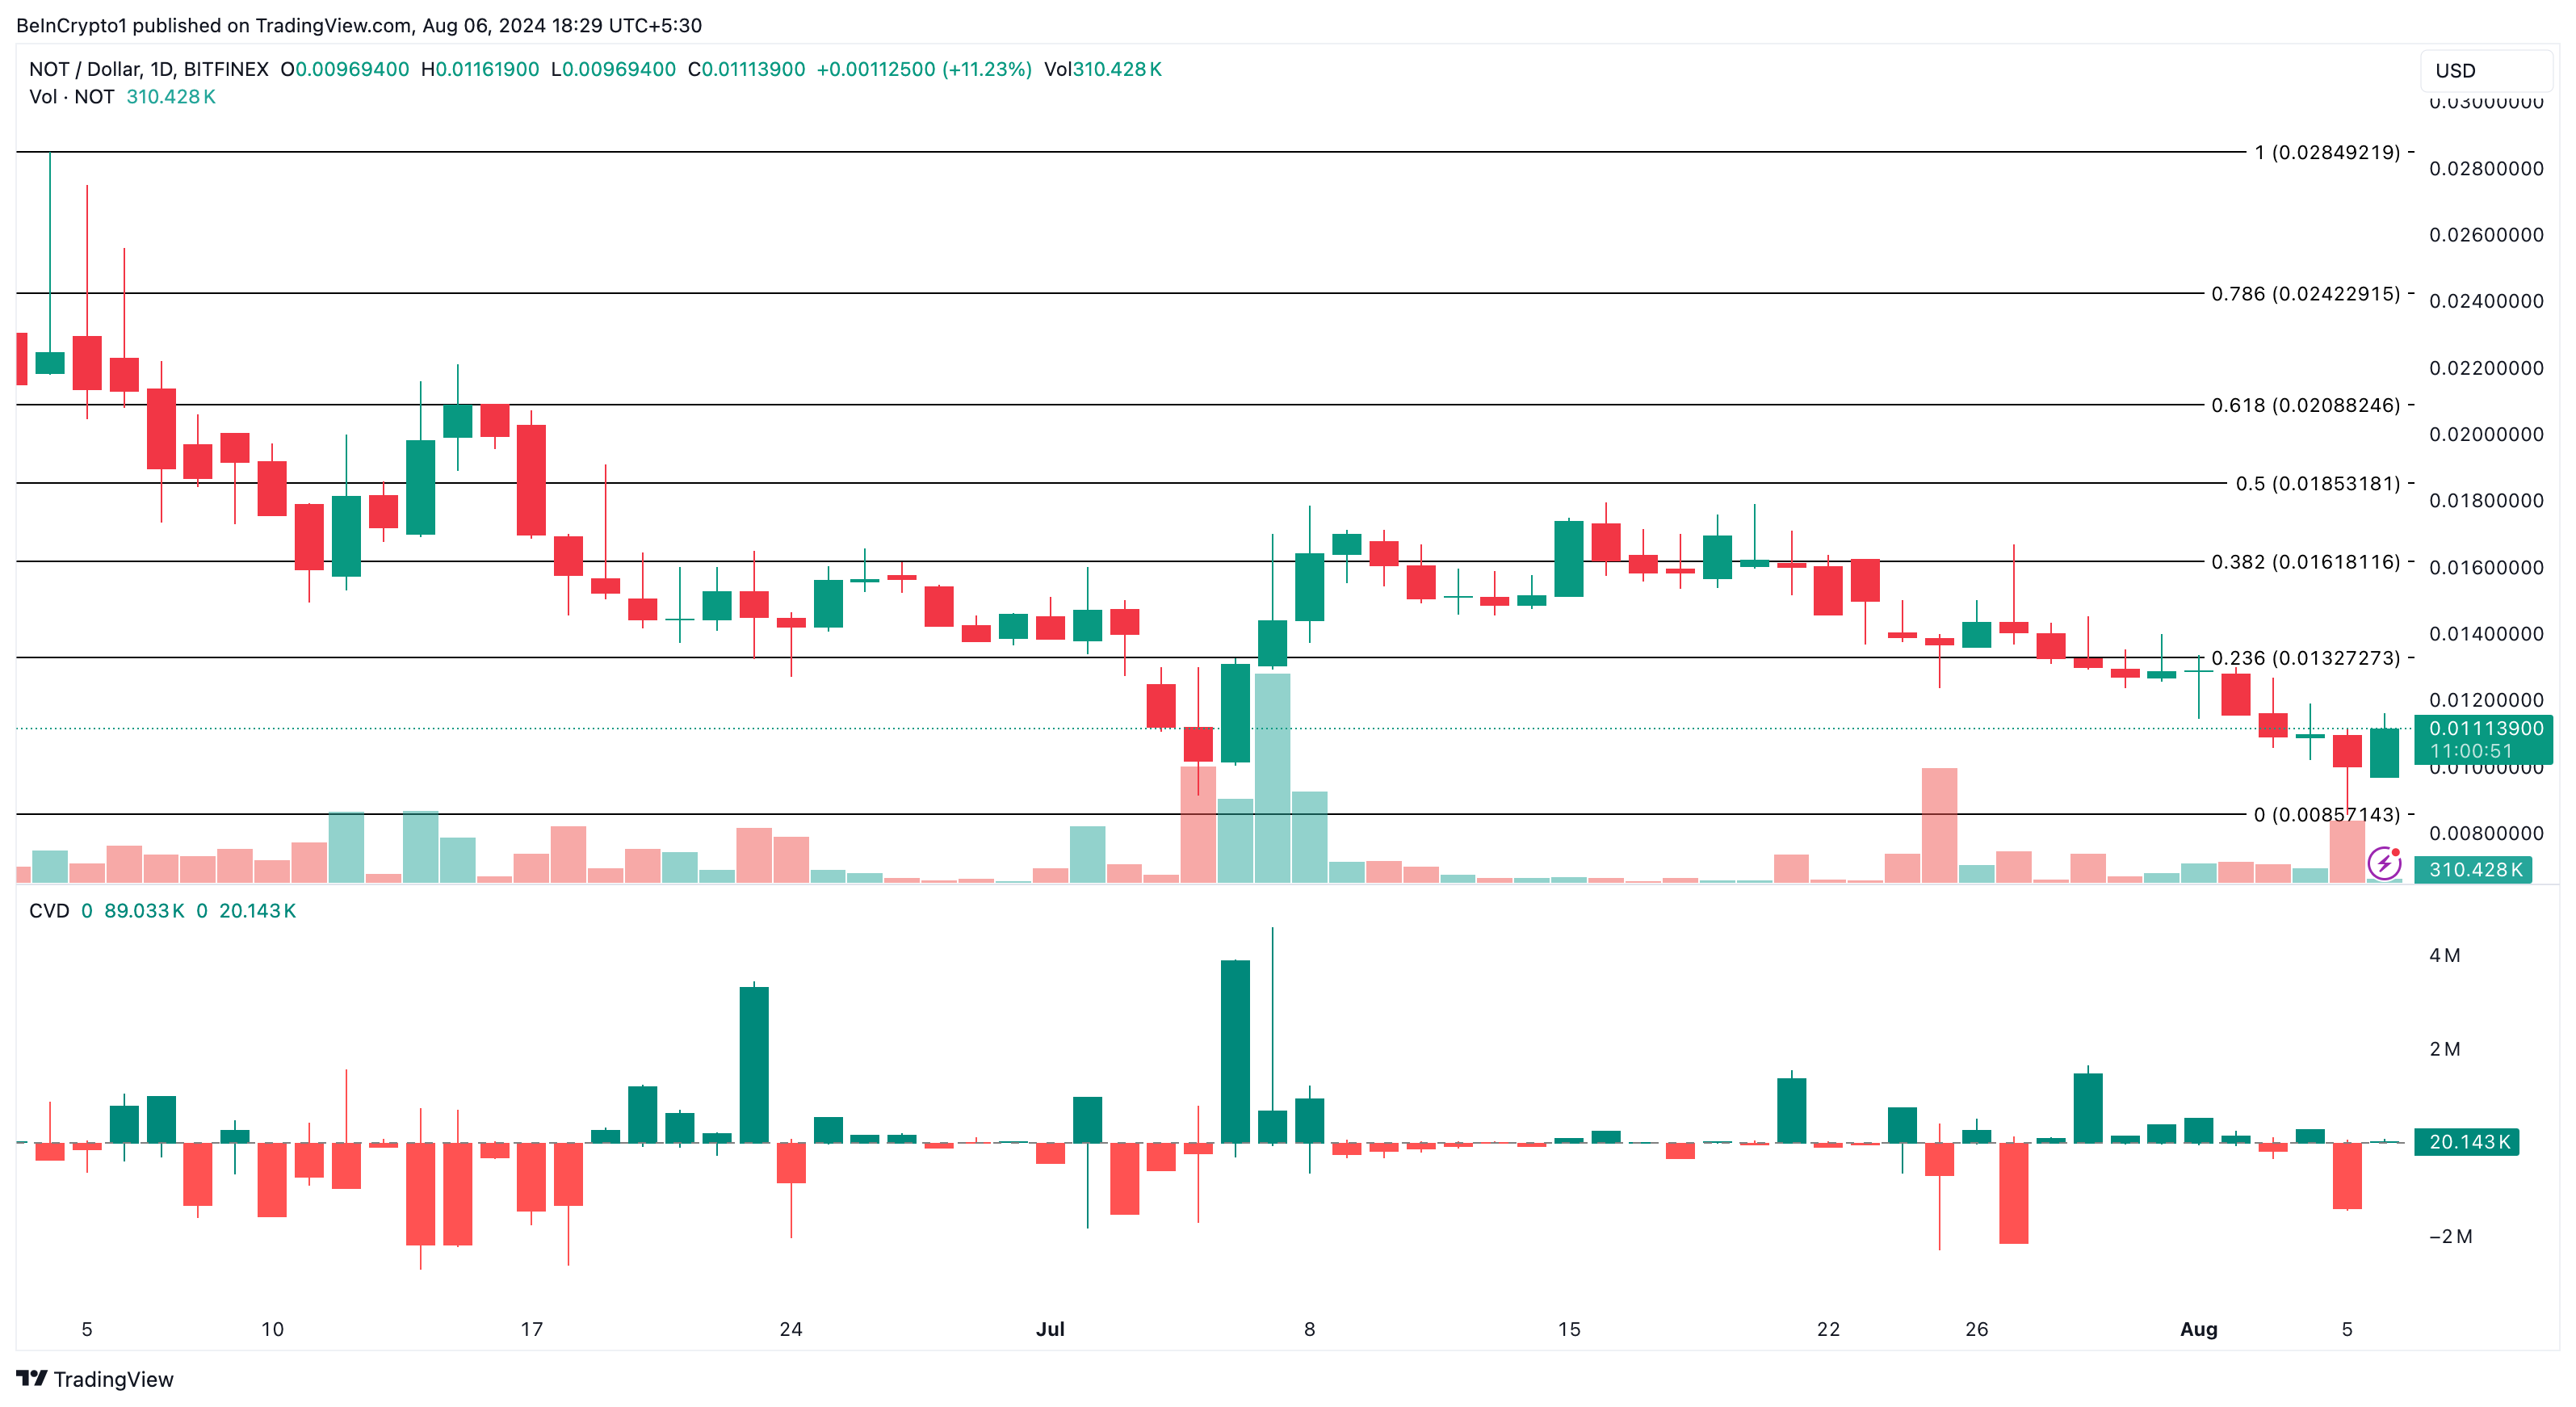
If this buying volume continues to rise, the NOT token may sustain its upswing. Increased buying pressure could drive NOT’s price up to $0.013.
However, if the cryptocurrency experiences another wave of selling pressure, the value could drop as low as $0.0085.
Disclaimer
In line with the Trust Project guidelines, this price analysis article is for informational purposes only and should not be considered financial or investment advice. BeInCrypto is committed to accurate, unbiased reporting, but market conditions are subject to change without notice. Always conduct your own research and consult with a professional before making any financial decisions. Please note that our Terms and Conditions, Privacy Policy, and Disclaimers have been updated.


The US Commodities Futures Trading Commission (CFTC) scrapped a key directive that had previously signaled increased scrutiny for digital asset derivatives.
This decision indicates a friendlier regulatory climate for digital assets in the US, given the Trump administration’s pro-crypto stance.
CFTC Loosens Oversight for Crypto Derivatives
The CFTC withdrew Staff Advisory No. 23-07 and No. 18-14 by its Division of Clearing and Risk (DCR).
The former, issued in May 2023, focused on the risks of clearing digital assets. Meanwhile, the latter targeted virtual currency derivatives listings.
Upon establishment, both directives hinted at the singling out of crypto products for tougher oversight.
However, both have now been deemed unnecessary, effective immediately, amid the commodities’ regulator’s push toward regulatory consistency.
The decision indicates a shift to treating digital asset derivatives like those on Ethereum (ETH) as traditional finance (TradFi) products.
“As stated in today’s withdrawal letter, DCR determined to withdraw the advisory to ensure that it does not suggest that its regulatory treatment of digital asset derivatives will vary from its treatment of other products,” the CFTC explained.
This move will eliminate the perceived distinctions between digital asset derivatives and TradFi instruments.
It also paves the way for enhanced market participation, which will facilitate broader involvement from financial institutions in the digital asset derivatives market. This could lead to increased liquidity and market maturity.
Nevertheless, the advisory warned derivatives clearing organizations (DCOs) to prepare for risk assessments specific to digital products’ unique characteristics.
Therefore, while it reflects the CFTC’s commitment to promoting innovation, it also suggests the intention to maintain strong financial oversight.
Meanwhile, this decision comes only weeks after the Office of the Comptroller of the Currency (OCC) allowed US banks to offer crypto and stablecoin services without prior approval.
However, the OCC had articulated that despite lifting the approval requirement, banks must maintain strong risk management controls akin to those required for traditional banking operations.
“The OCC expects banks to have the same strong risk management controls in place to support novel bank activities as they do for traditional ones,” said Rodney E. Hood, the acting Comptroller of the Currency.
Therefore, the CFTC’s move to eliminate regulatory bias for crypto derivatives marks a major divide in US policy. On the one hand, the CFTC seeks to scrap the distinction between crypto derivatives and TradFi instruments.
On the other hand, the FDIC (Federal Deposit Insurance Corporation) and OCC want banks to maintain risk management controls similar to those required for traditional banking operations despite providing crypto and stablecoin services.
Notwithstanding, these efforts mirror a growing trend among US financial regulators to lower barriers and foster responsible innovation in the crypto industry.
Disclaimer
In adherence to the Trust Project guidelines, BeInCrypto is committed to unbiased, transparent reporting. This news article aims to provide accurate, timely information. However, readers are advised to verify facts independently and consult with a professional before making any decisions based on this content. Please note that our Terms and Conditions, Privacy Policy, and Disclaimers have been updated.

XRP is under heavy selling pressure, down more than 5% in the last 24 hours and over 12% in the past seven days. The recent downturn has been accompanied by increasingly bearish technical indicators, including a sharp spike in trend strength and a collapse in on-chain activity.
With price momentum weakening and user engagement dropping, concerns are mounting over XRP’s ability to hold key support levels. Unless sentiment shifts quickly, the path of least resistance appears to remain to the downside.
DMI Chart Shows The Current Downtrend Is Very Strong
XRP’s Directional Movement Index (DMI) is currently flashing strong bearish signals, with the Average Directional Index (ADX) surging to 47.14 from 25.43 just a day ago.
The ADX measures the strength of a trend, regardless of its direction, and values above 25 generally indicate that a trend is gaining momentum.
A reading above 40—like XRP’s current level—suggests a very strong trend is in play. Given that XRP is currently in a downtrend, this rising ADX points to intensifying bearish momentum and a market leaning heavily toward further declines.
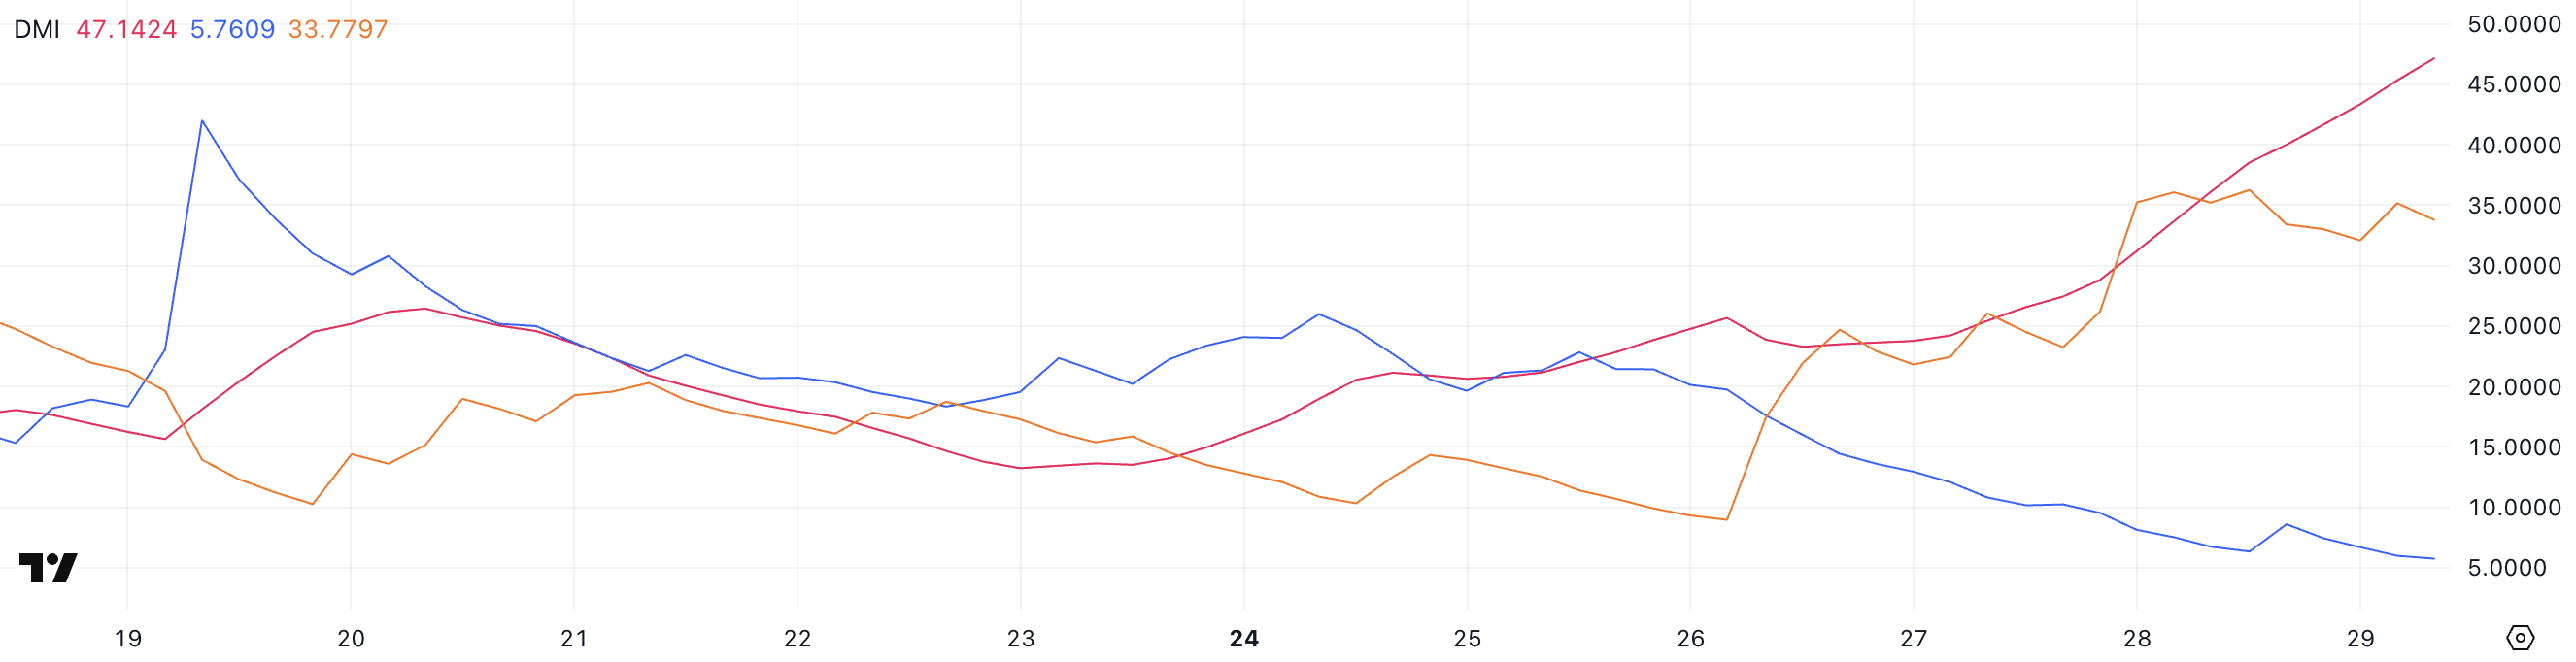
Digging deeper into the DMI components, the +DI, which tracks upward price pressure, has dropped sharply from 20.13 to 5.76. Meanwhile, the -DI, which tracks downward price pressure, has surged from 8.97 to 33.77.
This stark divergence reinforces the bearish trend, indicating that sellers are aggressively taking control while buyer strength fades.
With ADX confirming the strength of this move and directional indicators tilting heavily to the downside, XRP’s price could remain under pressure in the short term unless a significant reversal in sentiment occurs.
XRP Active Addresses Are Heavily Down
XRP’s 7-day active addresses have seen a sharp decline over the past week, following a recent surge to new all-time highs. On March 19, the metric peaked at 1.22 million, signaling strong network activity and user engagement.
However, since then, it has plummeted to just 331,000—a drop of over 70%. This sudden fall suggests that interest in transacting on the XRP has cooled off significantly in a short span of time.
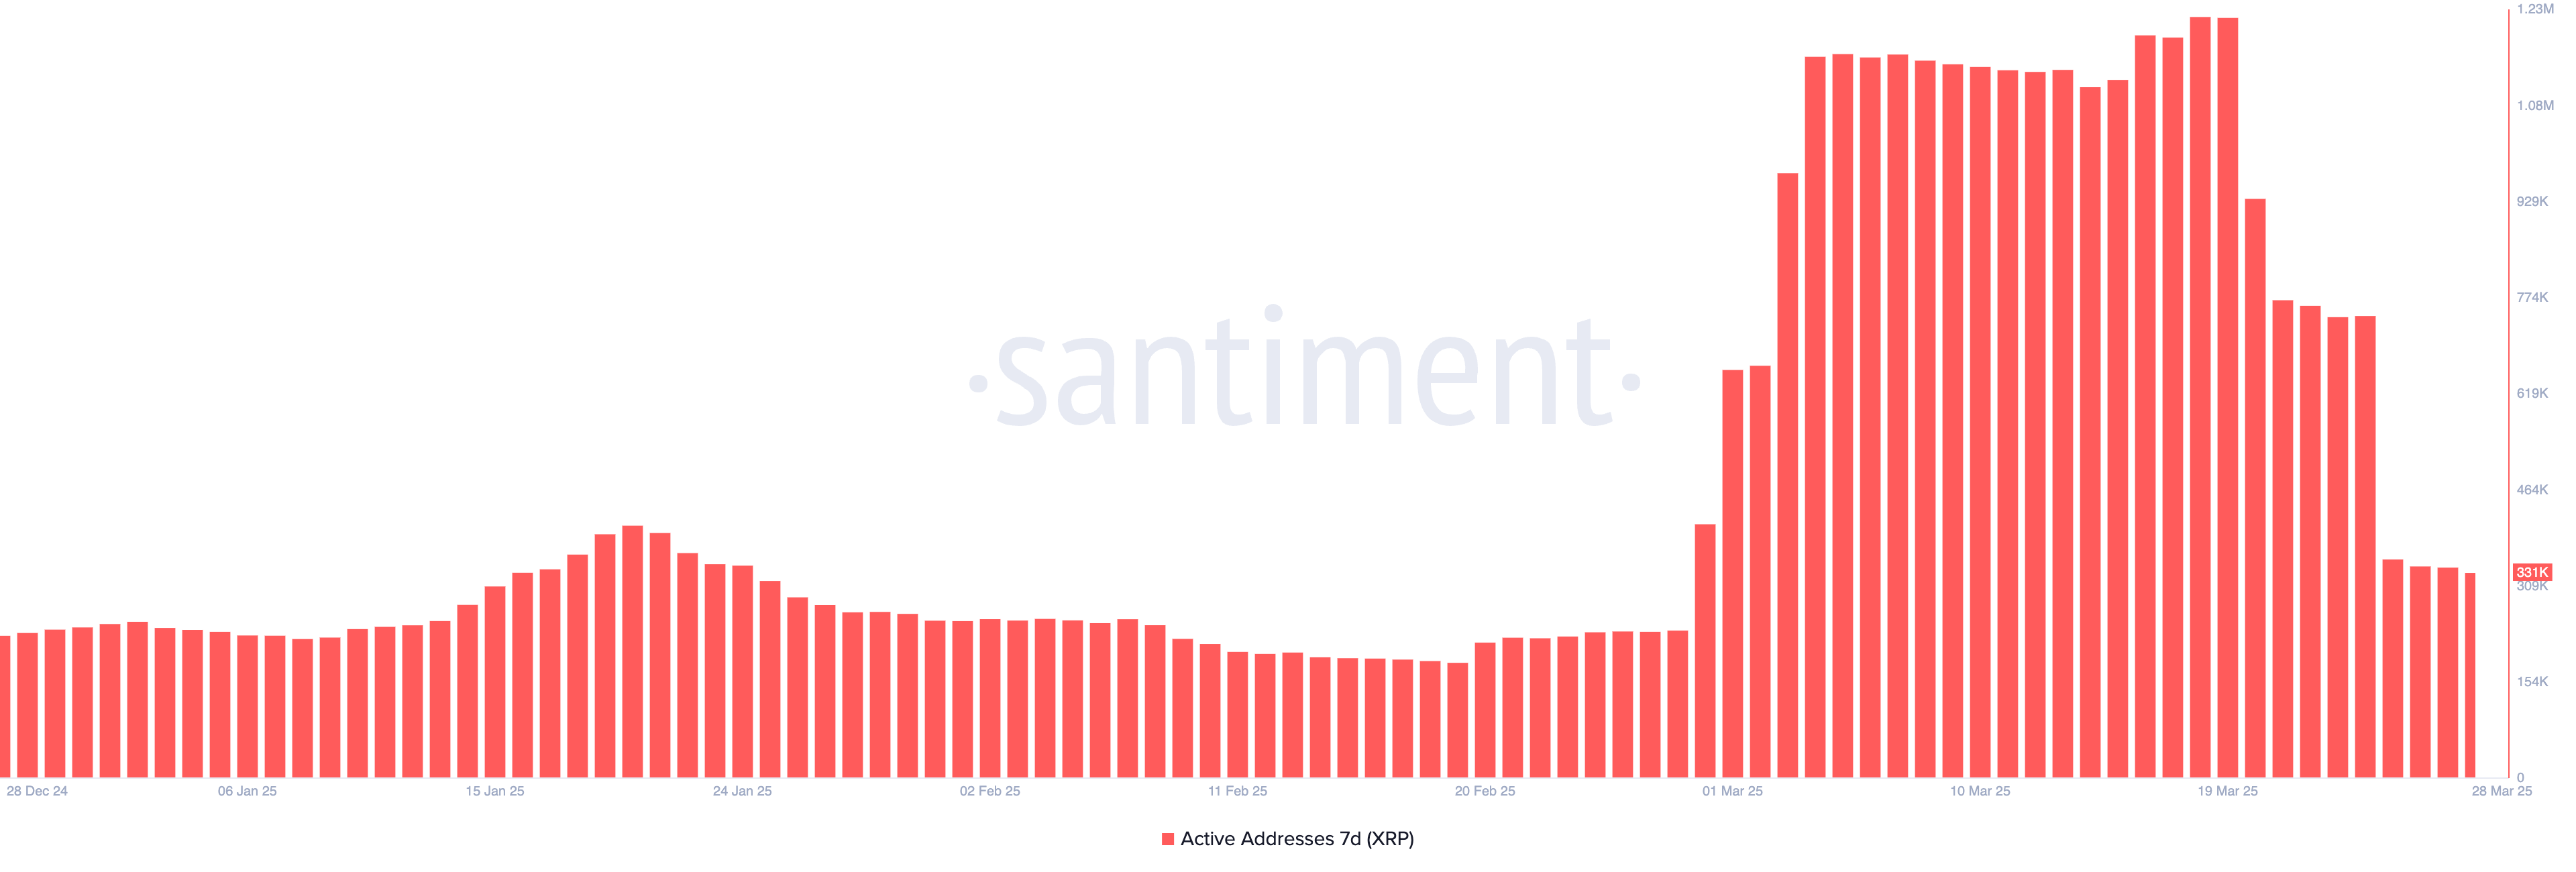
Tracking active addresses is a key way to gauge on-chain activity and overall network health. A rising number of active addresses typically reflects growing user participation, increased demand, and potential investor interest—factors that can support price strength.
Conversely, a sharp decline like the one XRP is currently experiencing can point to weakening momentum and fading interest, which could put additional pressure on price.
Unless user activity begins to rebound, this drop in network engagement may continue to weigh on XRP’s short-term outlook.
XRP Could Drop Below $2 Soon
XRP’s Exponential Moving Average (EMA) lines are currently signaling a strong downtrend, with the short-term EMAs positioned below the longer-term ones—a classic bearish alignment.
This setup indicates that recent price momentum is weaker than the longer-term average, often seen during sustained corrections. If this downtrend continues, XRP could retest the support level at $1.90.
A break below that could open the door to a deeper drop toward $1.77 in April.
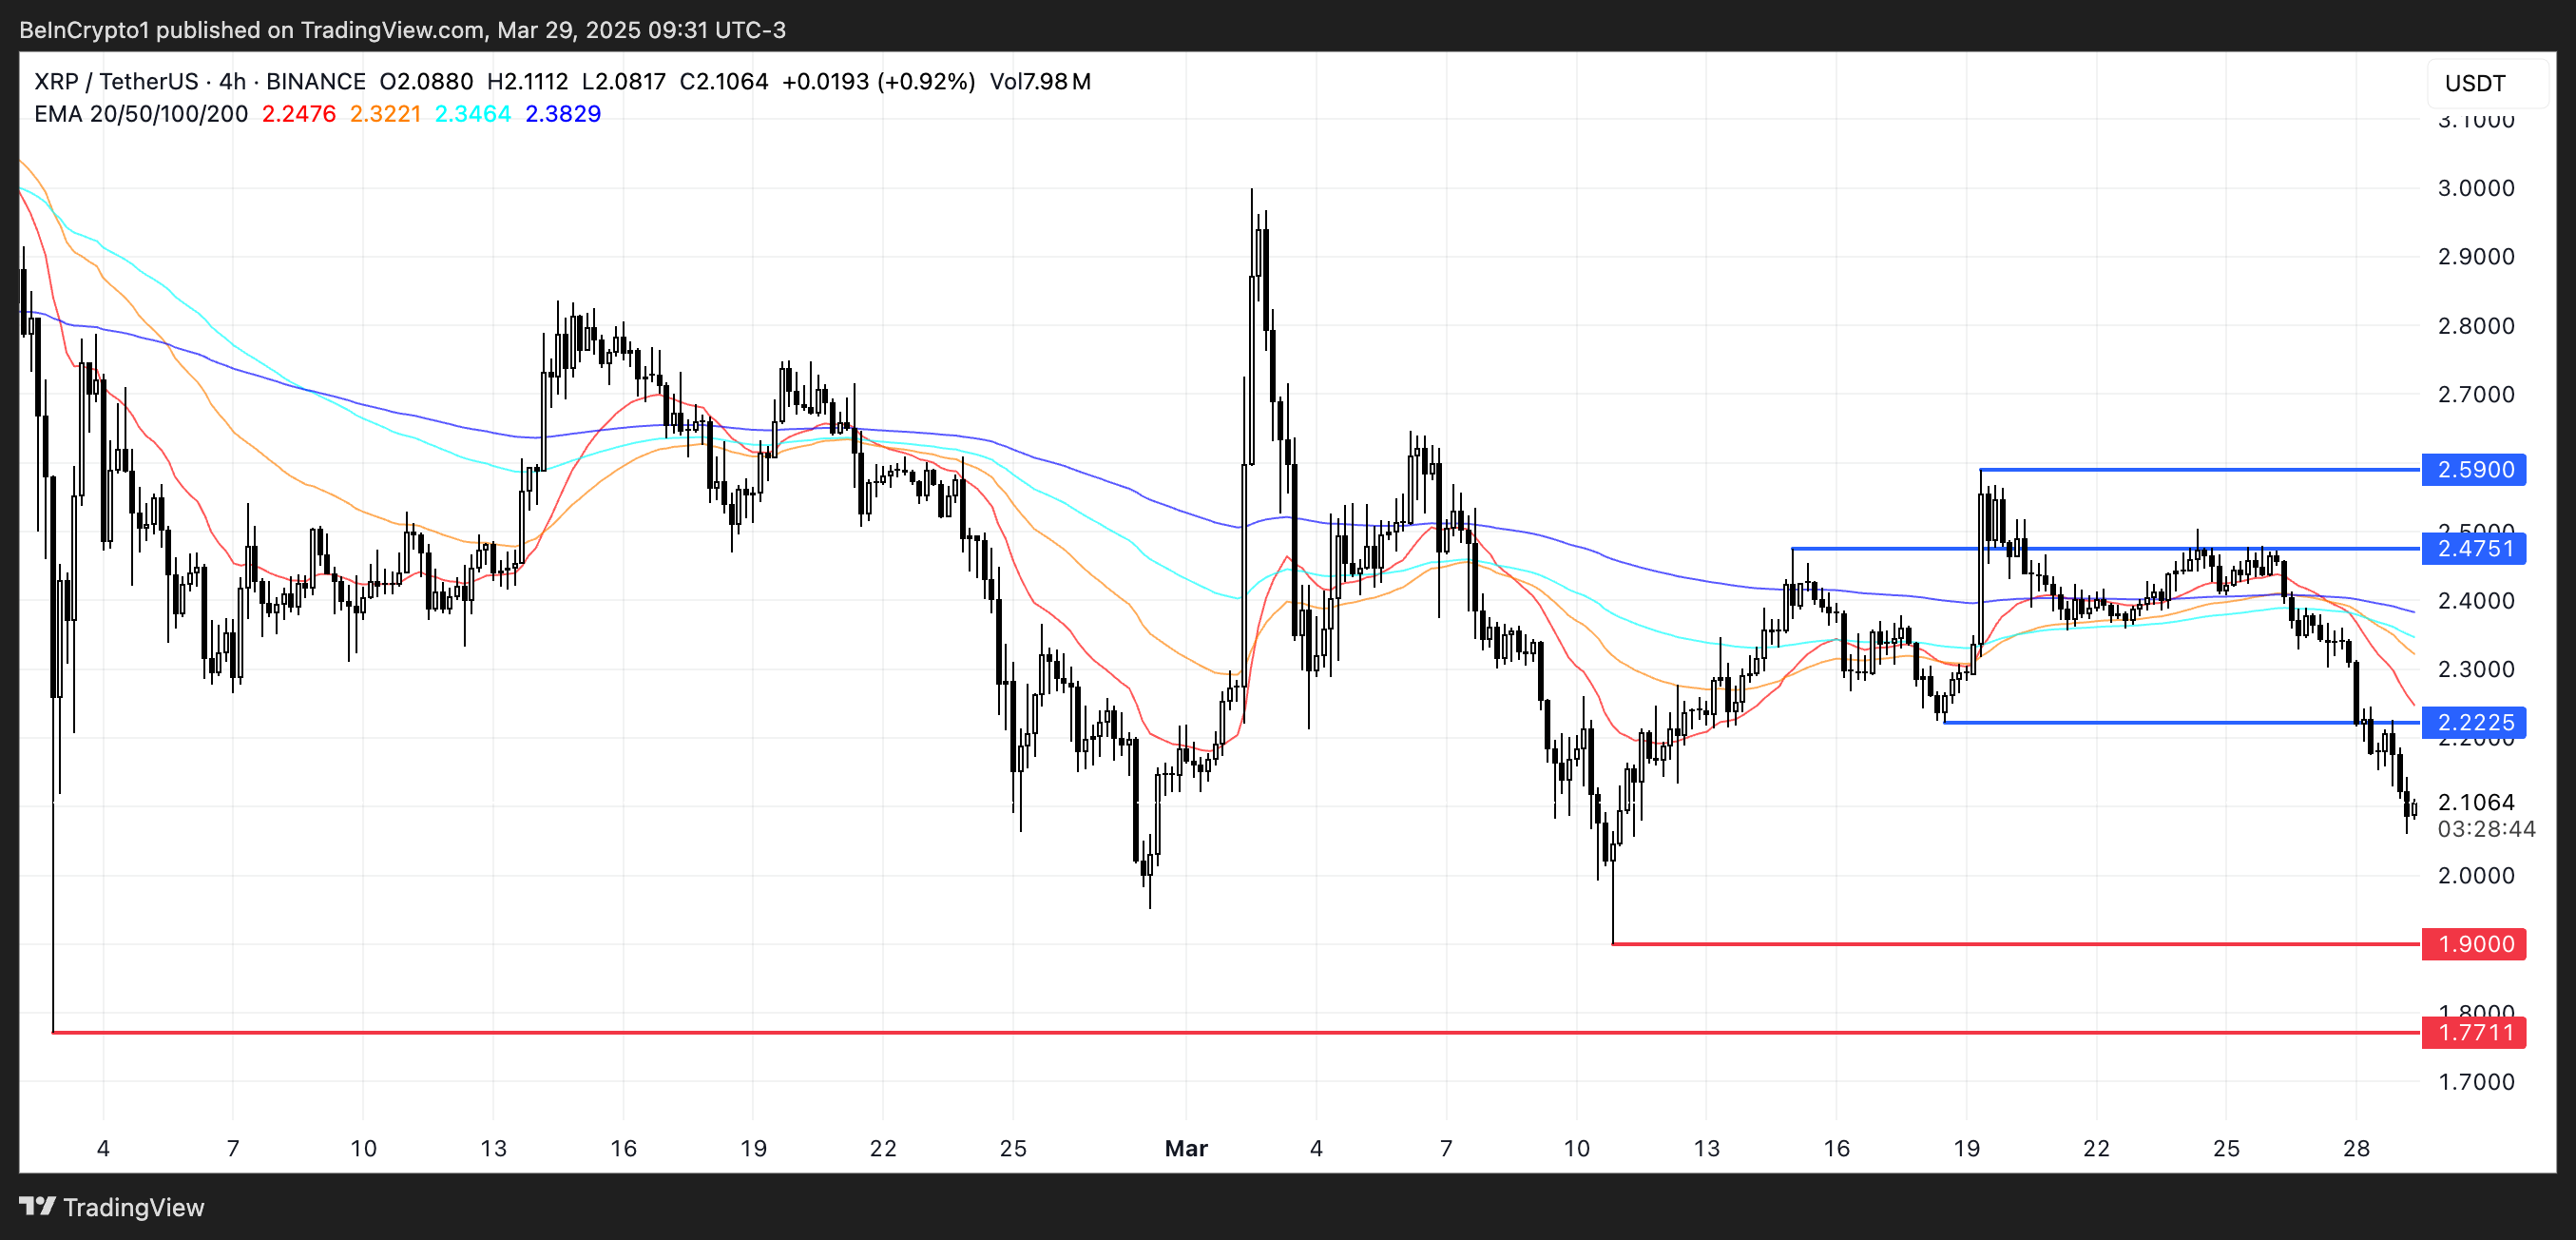
However, if market sentiment shifts and XRP price manages to reverse course, the first key level to watch is the resistance at $2.22.
A successful breakout above this point could trigger renewed bullish momentum, potentially driving the price up to $2.47.
If that level also gets breached, XRP could push further to test the $2.59 mark.
Disclaimer
In line with the Trust Project guidelines, this price analysis article is for informational purposes only and should not be considered financial or investment advice. BeInCrypto is committed to accurate, unbiased reporting, but market conditions are subject to change without notice. Always conduct your own research and consult with a professional before making any financial decisions. Please note that our Terms and Conditions, Privacy Policy, and Disclaimers have been updated.

ONDO is facing notable downside pressure. It has been down over 5% in the last 24 hours and corrected more than 19% over the past 30 days. With its market cap now sitting around $2.5 billion, the coin is way below competitors like Chainlink and Mantra in terms of market cap.
Recent technical indicators and whale behavior suggest that the current weakness may not be over, despite a slight recovery in momentum.
ONDO RSI Is Recovering From Oversold Levels
ONDO’s Relative Strength Index (RSI) is currently sitting at 34 after rebounding slightly from an earlier dip to 27.5. Just two days ago, the RSI was at 54.39, indicating how quickly momentum has shifted.
The RSI is a momentum oscillator that measures the speed and magnitude of recent price changes. It ranges from 0 to 100.
Readings below 30 are typically considered oversold, suggesting the asset may be undervalued and due for a bounce, while readings above 70 are viewed as overbought, indicating potential for a pullback.
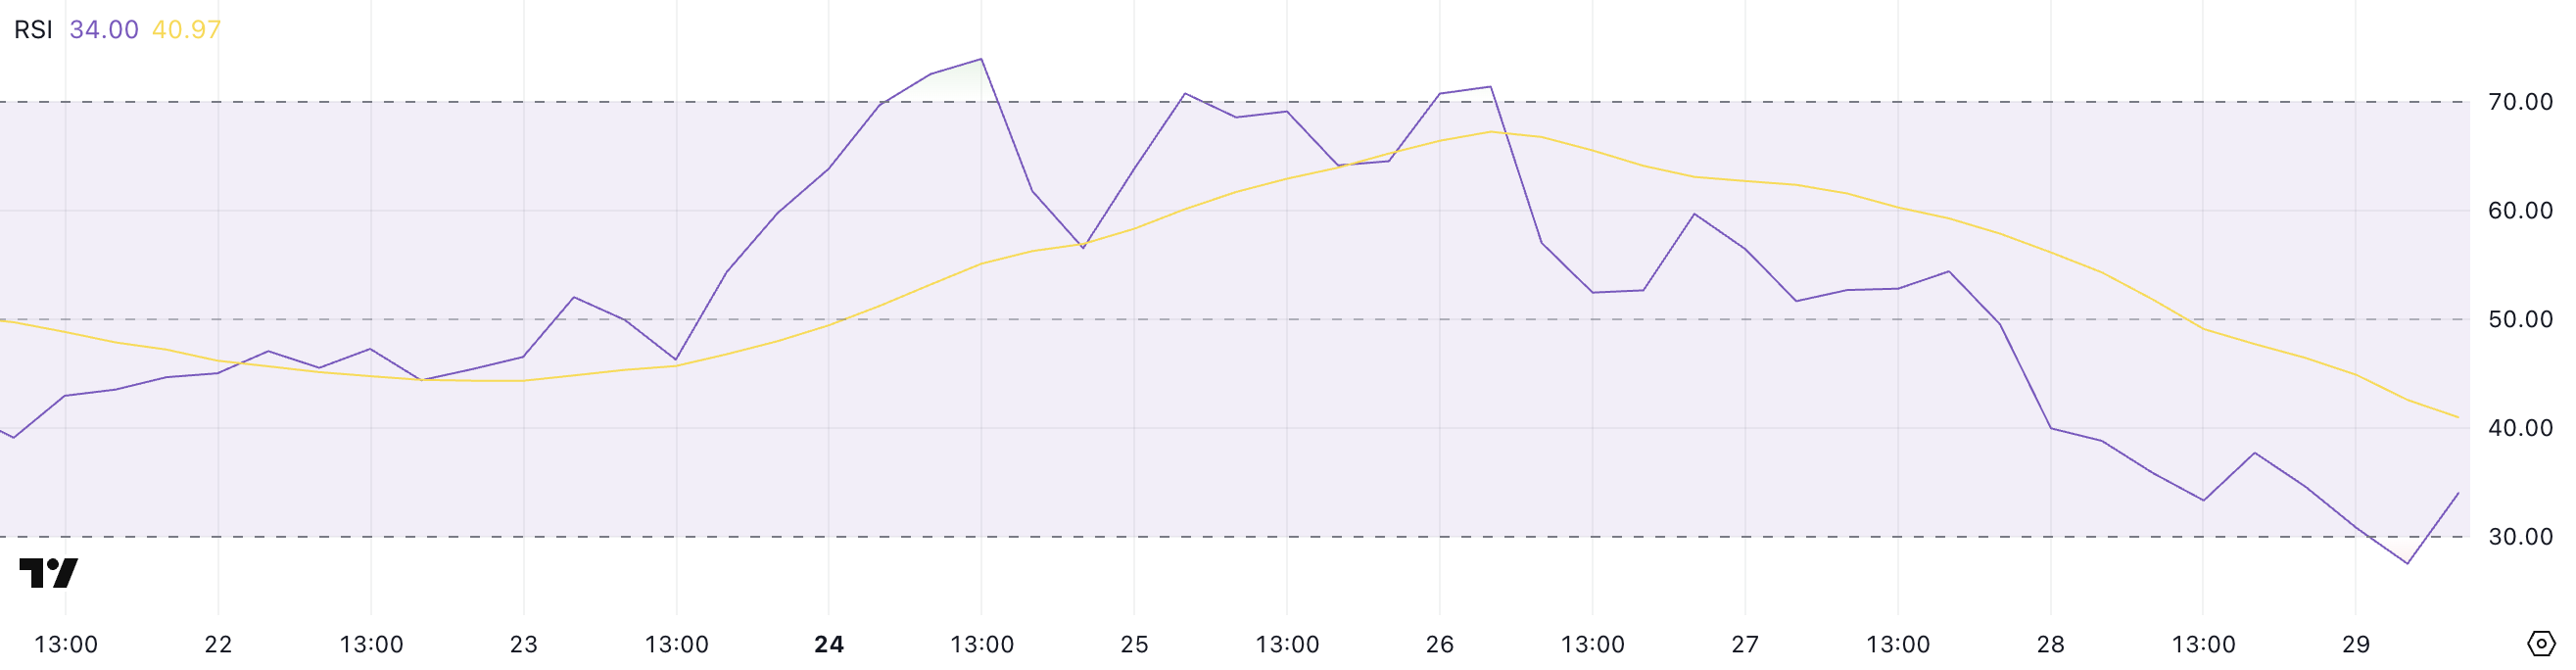
With ONDO’s RSI now at 34, it has technically exited oversold territory but remains near the lower end of the scale. This suggests that while the sharpest selling pressure may have eased, the market is still fragile ,and sentiment remains cautious.
If the RSI continues to recover and climbs above 40 or 50, it could signal a shift toward more bullish momentum.
However, if selling resumes and RSI falls back below 30, it would indicate renewed downside risk and potential for further price declines.
Whales Recently Stopped Their Accumulation
The number of ONDO whales—addresses holding between 1 million and 10 million ONDO—fluctuated in late March, initially increasing from 188 to 195 between March 22 and March 26 before declining to 191 in recent days.
This whale activity pattern is significant as these large holders often influence market sentiment and price movements, with their accumulation or distribution phases potentially foreshadowing broader market trends.
Tracking whale addresses provides valuable insights into how influential investors are positioning themselves, which can help predict potential price action.
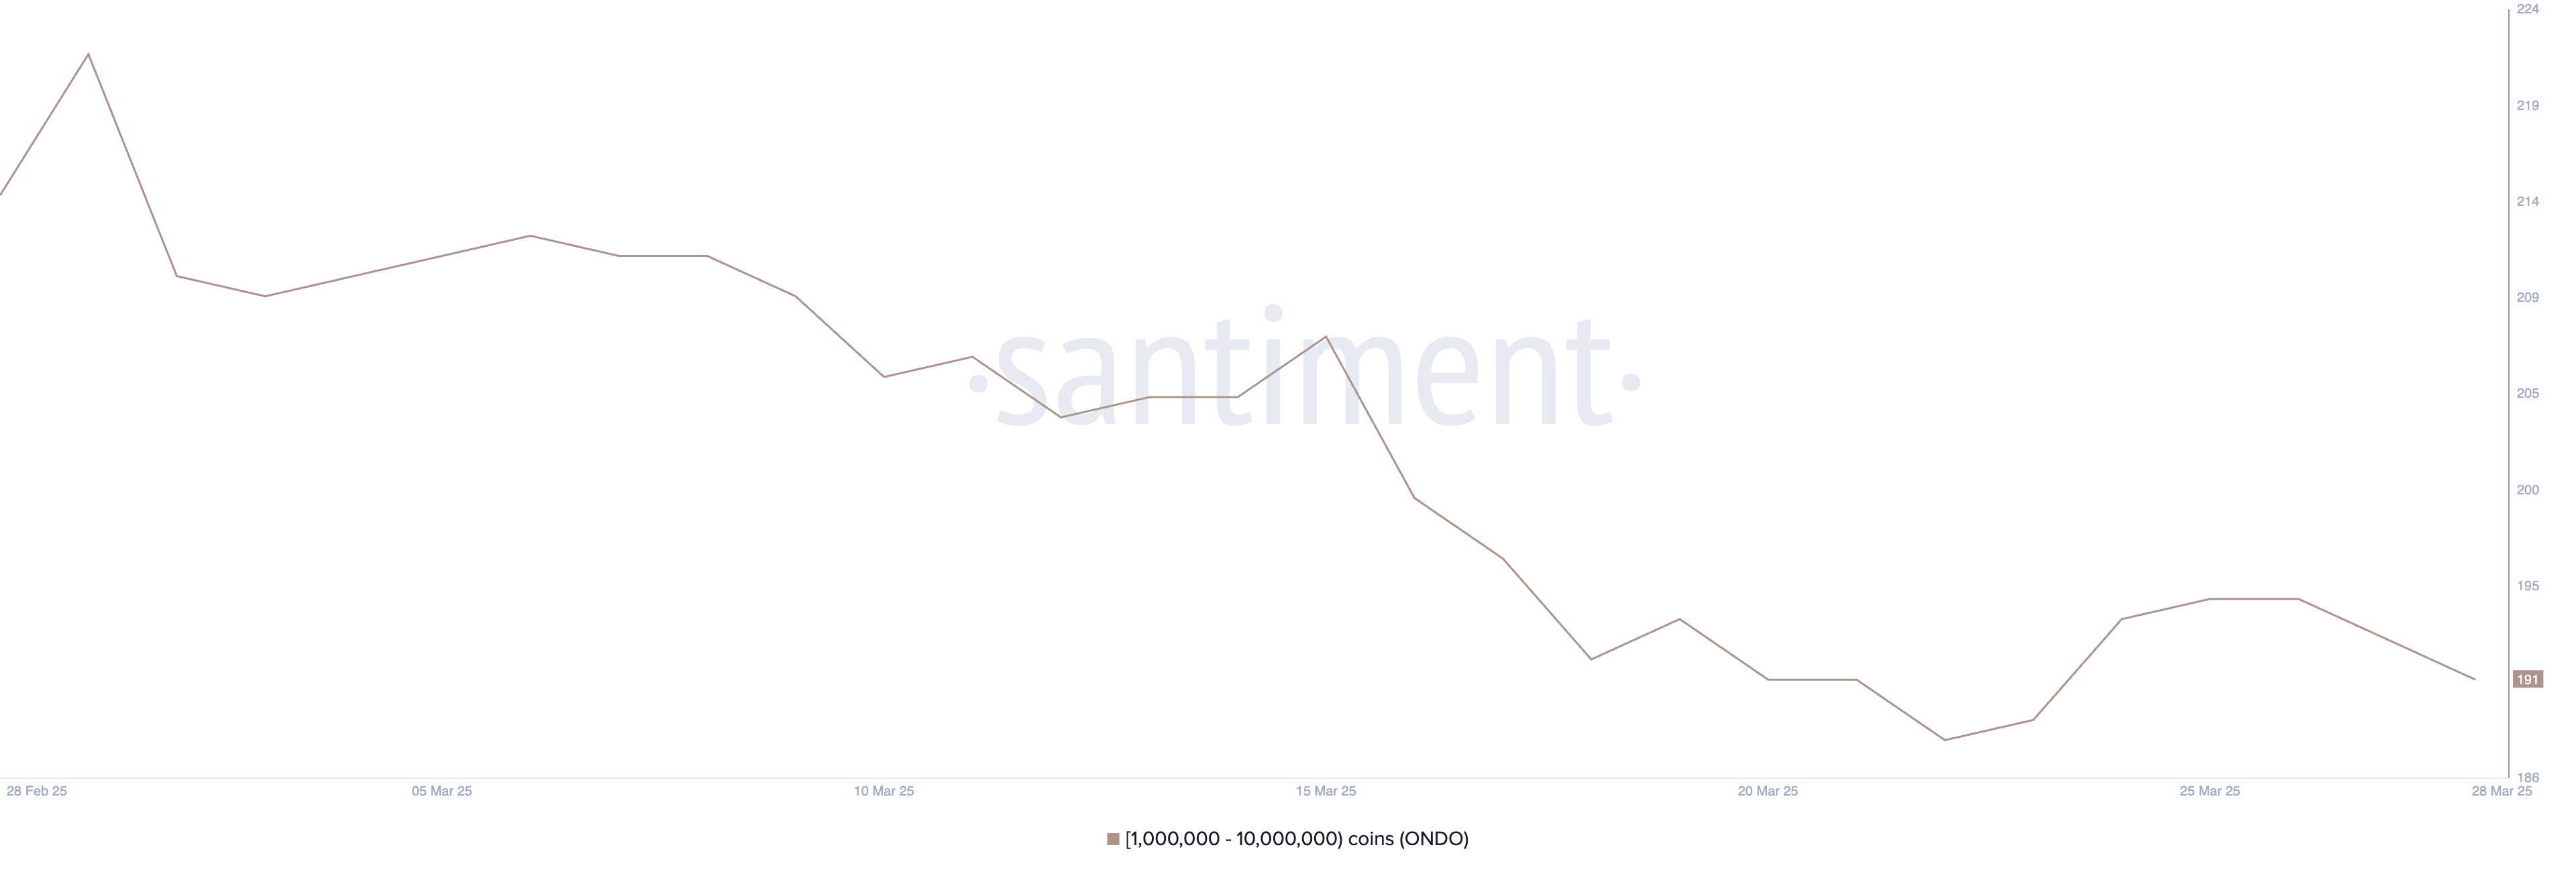
The failure of Whale addresses to maintain the breakout above 195 and the subsequent return to 191 could signal bearish sentiment among larger investors.
This retreat might indicate that whales are taking profits or reducing exposure, which could create downward price pressure on ONDO in the short term.
When large holders begin to reduce their positions after a period of accumulation, it often precedes price corrections, suggesting that ONDO may experience resistance in maintaining upward momentum until whale confidence returns and accumulation resumes.
Will ONDO Fall Below $0.70 For The First Time Since November?
ONDO’s Exponential Moving Average (EMA) lines are currently aligned in a bearish formation, suggesting the ongoing downtrend may persist. If this weakness continues, ONDO could drop to test the key support level at $0.73.
A break below that would be significant, potentially sending the price under $0.70 for the first time since November 2024.
The token has been struggling to keep pace with other Real World Asset (RWA) coins like Mantra, and this underperformance adds further pressure to ONDO’s short-term outlook.
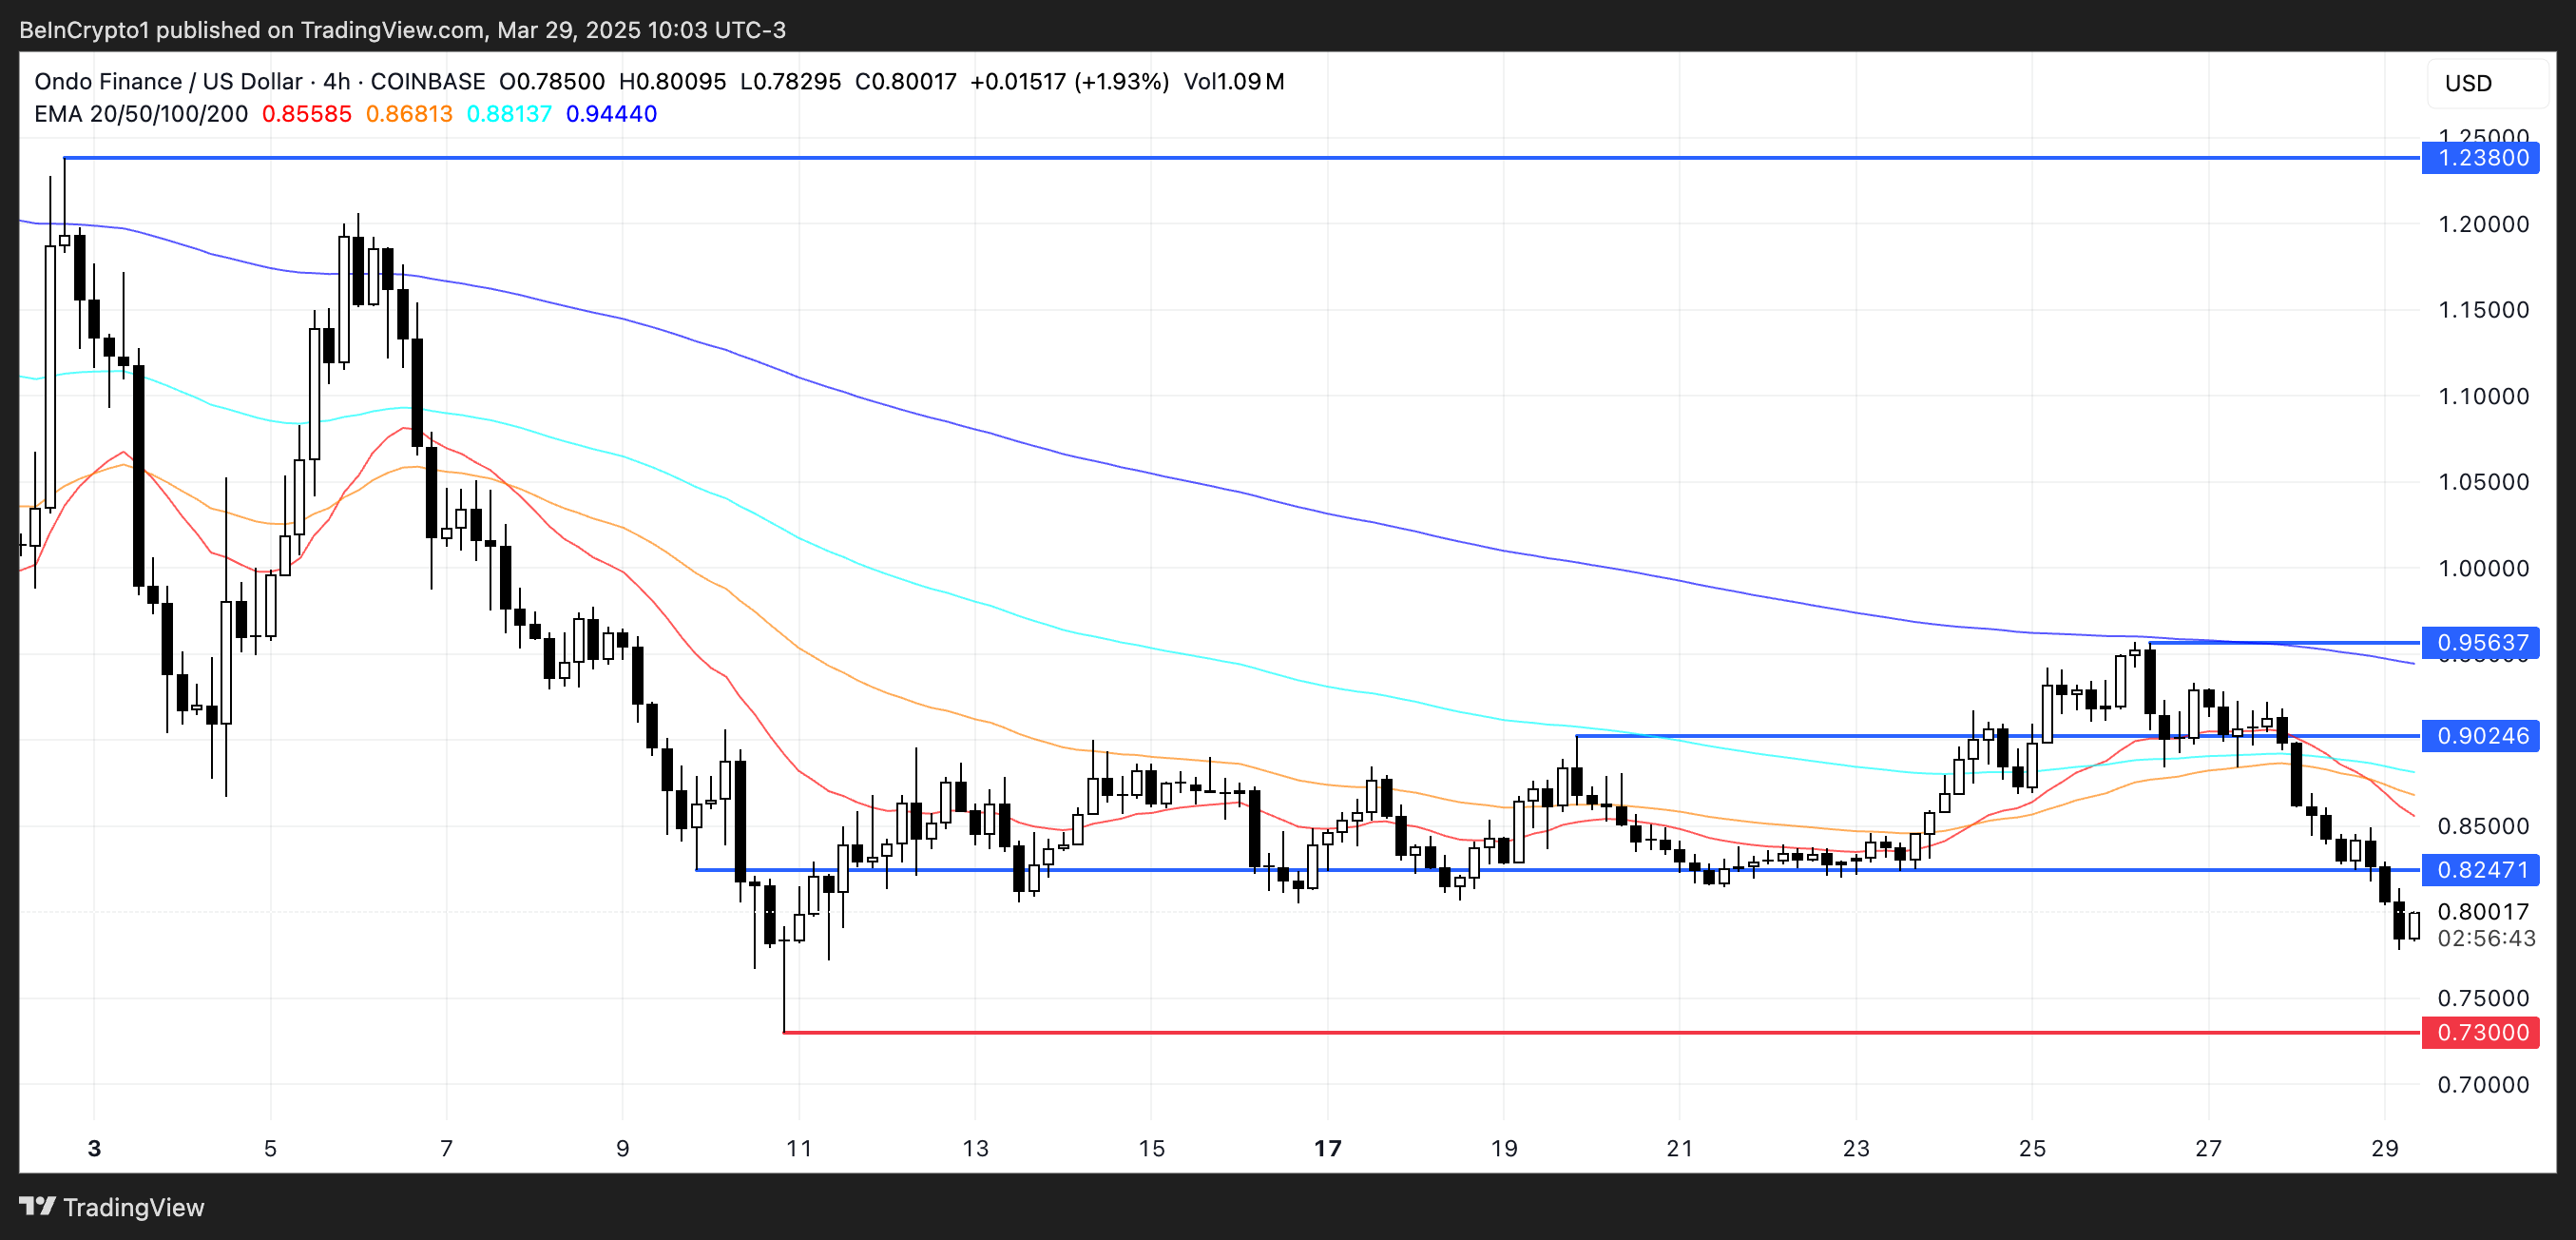
However, if sentiment shifts and ONDO manages to reverse its trend, the first key level to watch is the resistance at $0.82.
A breakout above this level could trigger a broader recovery, with price targets at $0.90 and $0.95.
If the RWA sector as a whole regains momentum, ONDO could even rise above the $1 mark and aim for the next major resistance at $1.23.
Disclaimer
In line with the Trust Project guidelines, this price analysis article is for informational purposes only and should not be considered financial or investment advice. BeInCrypto is committed to accurate, unbiased reporting, but market conditions are subject to change without notice. Always conduct your own research and consult with a professional before making any financial decisions. Please note that our Terms and Conditions, Privacy Policy, and Disclaimers have been updated.

Crypto Derivatives Get a Boost from US CFTC

Why Bitcoin Seasoned Investors Are Accumulating — Analyst Evaluates BTC’s Current Phase

Kentucky Governor Signs Off On ‘Bitcoin Rights’ Bill, Strengthening Crypto Protections

Gemini Crypto Exchange Announces Rewards For XRP Users, Here’s How To Get In
Ethereum Price Falls Below $1900 As Expert Blames Decline On Network Stagnation

Ethereum Monthly RSI At 2018 Market Low — What Happened Last Time?

2.52 Million Altcoins Are Ruining Crypto’s Future

Animoca Brands Valuation Tanks 75% In Two Years, Here’s Why

Crypto exchange BingX hacked for $43 million

Are The Big Players Losing Interest?

Hong Kong’s Securities Association Tips Authorities On Crypto Self-Regulation

Coinbase cbBTC Set to go Live on Solana
2.52 Million Altcoins Are Ruining Crypto’s Future
Animoca Brands Valuation Tanks 75% In Two Years, Here’s Why
Crypto exchange BingX hacked for $43 million
Are The Big Players Losing Interest?
Hong Kong’s Securities Association Tips Authorities On Crypto Self-Regulation
Coinbase cbBTC Set to go Live on Solana
-
 Altcoin16 hours ago
Expert Predicts Listing Date For WLFI’s USD1 Stablecoin, Here’s When
-

 Market15 hours ago
GRASS Jumps 30% in a Week, More Gains Ahead?
-
 Bitcoin21 hours ago
El Salvador’s Nayib Bukele Open to White House Visit
-
 Altcoin20 hours ago
Did XRP Price Just Hit $21K? Live TV Display Error Goes Viral
-
 Altcoin14 hours ago
Pepe Coin Whale Sells 150 Billion Tokens, Price Fall Ahead?
-

 Ethereum20 hours ago
Ethereum Breakdown, Analyst Eyes $1,130–$1,200 Price Target
-

 Market13 hours ago
XRP Falls 12% in a Week as Network Activity Declines
-

 Bitcoin20 hours ago
Bitcoin Price Could Surge To $95,000 — But Analyst Sounds ‘Bull Trap’ Alarm