
Ethereum
Ethereum Bullish Or Bearish? What Futures Market Data Says

Here’s what the data related to the Ethereum futures market suggests regarding whether the sentiment around ETH is looking bearish or bullish.
Ethereum Taker Buy Sell Ratio Has Observed A Strong Surge Recently
In a new CryptoQuant Quicktake post, an analyst has talked about the outlook of Ethereum based on futures market data. The focus indicator here is the “Taker Buy Sell Ratio,” which keeps track of the ETH taker buy and taker sell volumes on the derivatives platforms.
When the value of this metric is greater than 1, it means the taker’s buy or long volume outweighs the taker’s sell or short volume and thus, a majority bullish sentiment is present in the market.
On the other hand, the indicator being under the mark implies the dominance of a bearish mentality among future users as more sellers are willing to sell at a lower price.
Now, here is a chart that shows the trend in the 14-day simple moving average (SMA) Ethereum Taker Buy Sell Ratio over the last few months:

The 14-day SMA value of the metric appears to have been sharply going up in recent days | Source: CryptoQuant
As is visible in the above graph, the 14-day SMA Ethereum Taker Buy Sell Ratio has observed a rapid increase recently, implying that the balance in the market has been shifting.
Alongside this spike in the indicator, the asset’s price has also seen a surge. The chart shows that a similar trend in the metric was also observed in the lead-up to the price rally in the first quarter of the year.
Based on the recent trend, the quant comments:
This surge indicates strong buying interest in the perpetual market, suggesting a notable bullish sentiment. If this upward trend in the Taker Buy/Sell Ratio continues, it confirms a potential mid-term bullish trend in the market, with the price likely rallying toward higher values.
It remains to be seen if the 14-day SMA Taker Buy Sell Ratio will continue its surge in the coming days, thus confirming this possible bullish setup for the cryptocurrency.
Speaking of the futures market, the CME Group has recently seen its dominance grow in the calendar futures market for Ethereum and Bitcoin, as the analytics firm Glassnode pointed out in an X post.
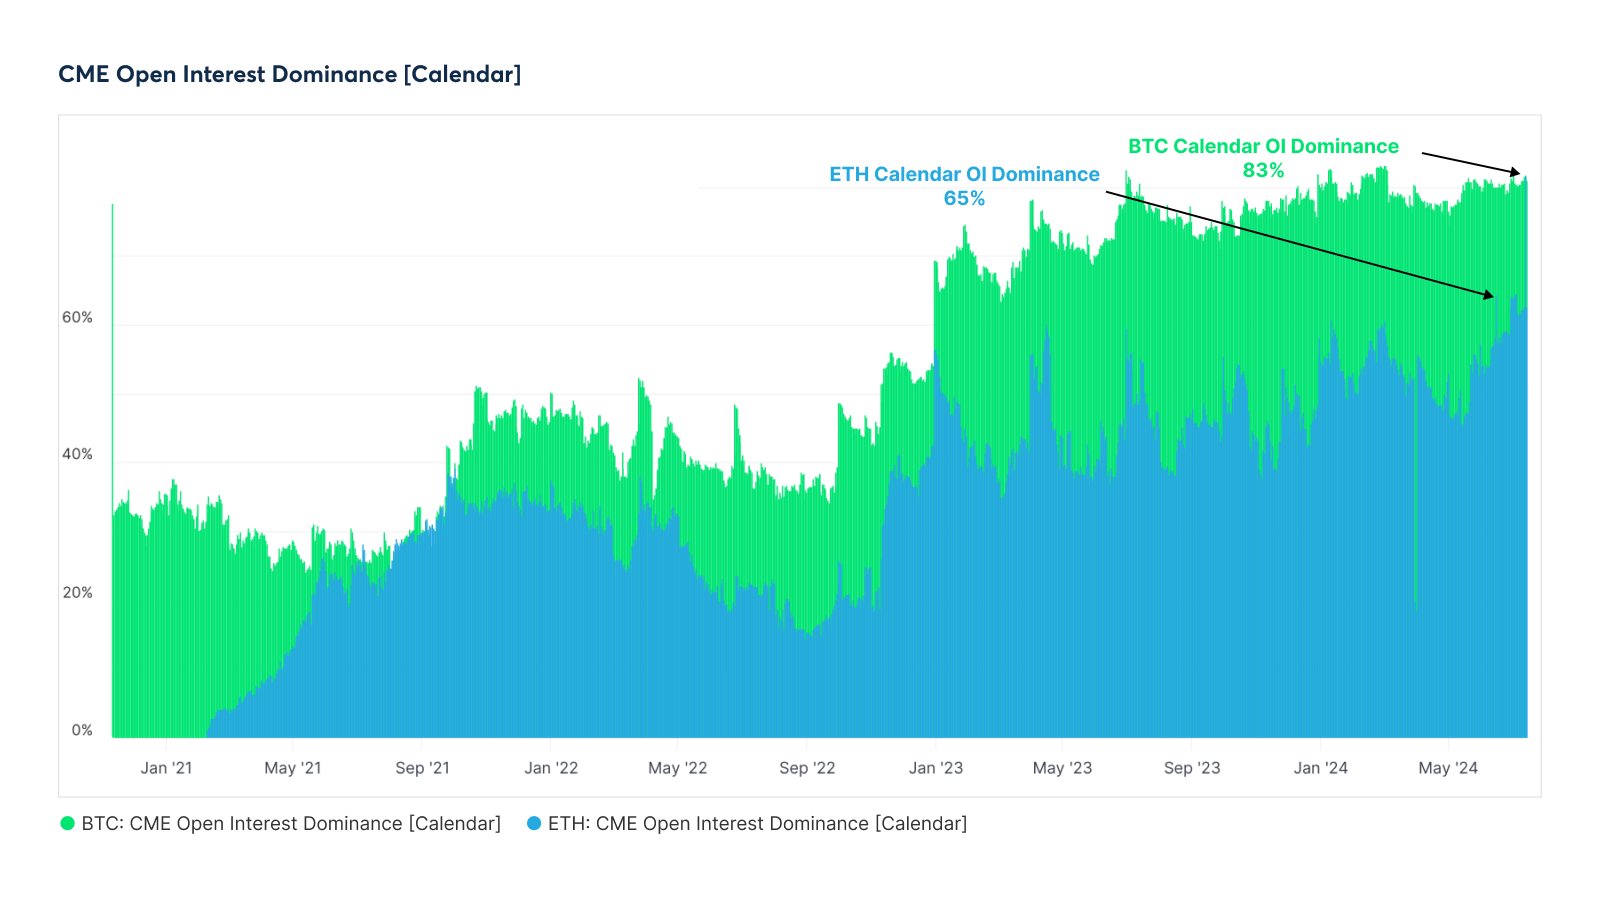
The trend in the Open Interest dominance of the CME group in the BTC and ETH calendar futures market | Source: Glassnode on X
The above chart displays the data for the Open Interest dominance of the CME Group. The Open Interest refers to the number of contracts currently open on the calendar futures market.
It would appear that the CME Group now occupies 83% and 65% of the Bitcoin and Ethereum calendar Open Interests, respectively.
ETH Price
Ethereum’s recovery has stalled during the last few days as the asset’s price still trades around the $3,400 mark.
Looks like the price of the coin has been moving sideways since its surge | Source: ETHUSD on TradingView
Featured image from Dall-E, CryptoQuant.com Glassnode.com, chart from TradingView.com


Reason to trust
![]()
Strict editorial policy that focuses on accuracy, relevance, and impartiality
Created by industry experts and meticulously reviewed
The highest standards in reporting and publishing
Strict editorial policy that focuses on accuracy, relevance, and impartiality
Morbi pretium leo et nisl aliquam mollis. Quisque arcu lorem, ultricies quis pellentesque nec, ullamcorper eu odio.
Bitcoin maximalist Samson Mow has doubled up on his value criticism of Ethereum’s price, asserting ETH is still overvalued despite Bitcoin’s price almost quadrupling since 2022. The JAN3 CEO referred to the glaring disparity in performance between the two top cryptocurrencies over a near three-year span.
Related Reading
Price Gap Grows As Bitcoin Rises
According to data, Ethereum now sits at $1,558, essentially the same as its August 2022 price of $1,600. Meanwhile, Bitcoin has climbed from $21,500 to $82,302 – an eye-popping 270% rise. The widening gap has only served to bolster Mow’s contention that Ethereum’s price does not correlate with its fundamentals.
Mow re-tweeted his August 23, 2022 post this week to emphasize his steadfast stance. His criticism focuses on supply variations between the cryptocurrencies. Bitcoin has less than 21 million overall coins, while Ethereum boasts 122 million circulating tokens.
#Ethereum is overvalued.
1 BTC = $21.5k
1 ETH = $1.6k21M BTC supply (actually less)
122M ETH supply (72M premined)Adjusted for unit bias (ETH price at 21M units) one ETH would be $9.3k.
So some people are paying $9.3k per unit of something that’s 60% printed from thin air.
— Samson Mow (@Excellion) August 23, 2022
‘60% Minted Out Of Thin Air’ Claim Targets Ethereum’s Origins
Based on Mow’s quotations, about 72 million ETH tokens (approximately 60% of the supply) were premined at the time of Ethereum’s launch. Token creation before the start of public mining has been quite an issue for purists in cryptocurrency for some time.
Possibly, the Bitcoin maximalist suggested that if 21 million coins were all there would be in supply for Ethereum like in Bitcoin, then each ETH would be valued today at around $9,300. Mow is again targeting investors in Ethereum, saying they are paying too much for an asset whose supply is exaggerated.
Sensitive To Macroeconomic Forces
Ethereum recently fell to a multi-year low of $1,380 on the back of global tariff trade war tensions. The cryptocurrency bounced back immediately to $1,680 on April 9 after US President Donald Trump declared a three-month tariff tariff hike pause on various countries, with China being the exception.
These movements illustrate how both cryptocurrencies are still sensitive to macroeconomic forces even as they have different value propositions and market performances.
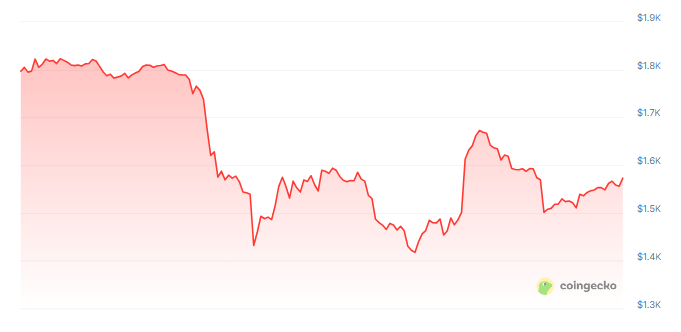
Ether down in the last week. Source: Coingecko
Related Reading
Long-Standing Campaign Against Ethereum Continues
This is not Mow’s first time criticizing Ethereum. He has been vocal against ETH for years. In November 2024, he cautioned investors that the fate of Ethereum could be the same as their favorite tokens.
Mow, who forecasts Bitcoin to hit $1 million this year, has told investors to sell everything, including Ethereum, and invest in Bitcoin instead.
The debate underscores deep-seated differences in cryptocurrency investment philosophies. While Bitcoin maximalists such as Mow focus on scarcity and Bitcoin’s “digital gold” status, Ethereum supporters highlight the platform’s smart contract abilities and wider applications ecosystem.
As the price differential between the two leading cryptocurrencies continues to expand, these debates regarding relative value and suitable pricing models draw greater interest from investors and market analysts in common.
Featured image from Reuters, chart from TradingView


Ethereum saw a powerful recovery this week, rebounding sharply from a $1,380 low and surging over 21% within hours. The rally was fueled by a temporary shift in macro sentiment following US President Donald Trump’s announcement of a 90-day pause on reciprocal tariffs for all countries except China, which remains under a 125% tariff. The news sparked a relief rally across financial markets, with Ethereum leading the bounce in the crypto sector.
Despite the strong move, ETH remains below key technical levels, and price action is showing signs of consolidation as bulls attempt to build momentum. The broader altcoin market continues to struggle, with sector-wide weakness weighing on investor confidence.
According to data from Glassnode, all major altcoin sectors have experienced sharp declines in recent months. The correction has been broad-based and highly correlated, offering little in terms of idiosyncratic performance. Even Bitcoin and Ethereum—typically seen as the most resilient assets in crypto—have posted negative returns over the same period.
As Ethereum enters a consolidation phase, traders are watching closely to see whether this bounce marks the beginning of a sustained recovery or just another short-lived reaction in a broader downtrend.
Ethereum Faces a Crucial Test Amid Macroeconomic Headwinds
Ethereum is once again at a pivotal point in the market, following weeks of intense selling pressure and uncertainty. After plunging to fresh lows, ETH bulls are finally stepping in, attempting to reclaim key levels after a strong bounce from the $1,380 mark. The move comes amid heightened volatility across global markets—not just in crypto, but in equities as well—as fears of a global recession and extended trade disputes between the U.S. and China continue to rattle investor sentiment.
Despite the bounce, Ethereum remains in fragile territory. The market is clearly divided: some investors see this rebound as the beginning of a recovery, while others caution it could be just a temporary pause in a deeper correction. The macroeconomic environment remains hostile, with U.S. tariffs still posing a major risk to both traditional and digital assets.
Glassnode data adds context to Ethereum’s struggle, showing that all altcoin sectors have moved sharply lower in recent months. There has been little differentiation between projects, with the drawdown being broad-based and highly correlated. Even Bitcoin and Ethereum—typically viewed as the strongest assets in crypto—have posted negative returns.

Ethereum has led this decline, losing over 60% of its value since late December. The sharp drop has triggered growing speculation about a potential bear market forming across the broader altcoin space. Whether this recent bounce will evolve into a sustainable rally or falter under macroeconomic pressure remains to be seen. For now, Ethereum faces a defining moment in its current cycle.
Bulls Struggles to Reclaim Key Levels But Defend $1,500
Ethereum is trading at $1,560 after failing to hold above the $1,600 mark and reclaim the critical $1,800 level. Despite the recent bounce from lower lows, ETH remains in a fragile position as market volatility rises and macroeconomic uncertainty continues to pressure risk assets.

Bulls are starting to build momentum, but the recovery is far from confirmed. Holding above $1,500 is now essential to prevent a continuation of the downtrend. This level has acted as a psychological support zone in previous market cycles, and losing it could trigger another wave of panic selling—especially as sentiment in the broader altcoin market remains subdued.
If bulls can defend the $1,500 level and consolidate above it, there’s a chance to reclaim higher levels in the short term, potentially challenging $1,600 again. However, a decisive break below $1,500 would likely lead to further downside, with price targets potentially extending into the $1,300–$1,200 range.
As volatility continues to drive erratic price action, ETH holders remain cautious. A confirmed push above $1,600 would help restore some confidence, but for now, Ethereum remains in a critical battle to hold its ground.
Featured image from Dall-E, chart from TradingView
Editorial Process for bitcoinist is centered on delivering thoroughly researched, accurate, and unbiased content. We uphold strict sourcing standards, and each page undergoes diligent review by our team of top technology experts and seasoned editors. This process ensures the integrity, relevance, and value of our content for our readers.
Reason to trust
![]()
Strict editorial policy that focuses on accuracy, relevance, and impartiality
Created by industry experts and meticulously reviewed
The highest standards in reporting and publishing
Strict editorial policy that focuses on accuracy, relevance, and impartiality
Morbi pretium leo et nisl aliquam mollis. Quisque arcu lorem, ultricies quis pellentesque nec, ullamcorper eu odio.
Even with the Ethereum price struggling amid the market downturn, there are still some who remain bullish on the second-largest cryptocurrency by market cap. One of those is pseudonymous crypto analyst NotWojak, who took to the TradingView website to share a rather bullish prediction for the Ethereum price that goes contrary to the current market sentiment.
Bearish Ethereum Price Downtrend Coming To An End
The Ethereum price is still stuck in an apparent downtrend. However, according to the crypto analyst, this could be ending anytime soon with two supply zones coming up. So far, there have been multiple liquidity sweeps across major levels, sending the Ethereum price towards lower lows. Nevertheless, this could turn bullish soon as they could suggest a reversal is coming for the cryptocurrency.
Related Reading
Currently, the two supply zones called out by the analyst are the $1,425 and $1,600 level. As they explain, the $1,425 level has already been mitigated during the latest retracement. So, this leaves only the $1,600 level unmitigated. As such, this could easily turn this level into resistance in the event of an uptrend.
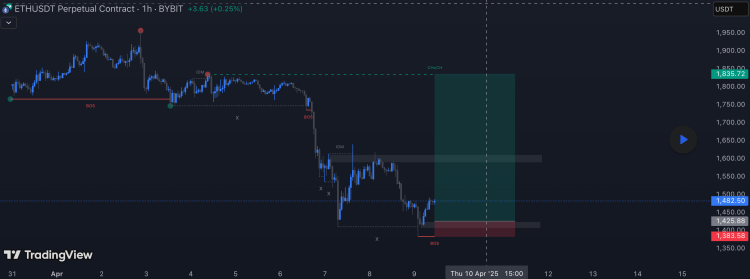
Despite sellers still dominating currently with high volumes pouring into the market, the crypto analyst puts the bottom before $1,350. In this case, this level could be potential support and the breakout could begin from here.
The target for this major breakout has been placed 20% above the current level, with the analyst setting a high $1,835 target. This could lead to further upside, especially if resistances are easily cleared from here.
ETH On-Chain
Ethereum’s profitability has plummeted with the price decline as only 32% of all investors are seeing any profit on their positions. On the other side, 65% of all holders are in losses and only 2% are sitting at breakeven price, according to data from the on-chain data aggregation website, IntoTheBlock.
Related Reading
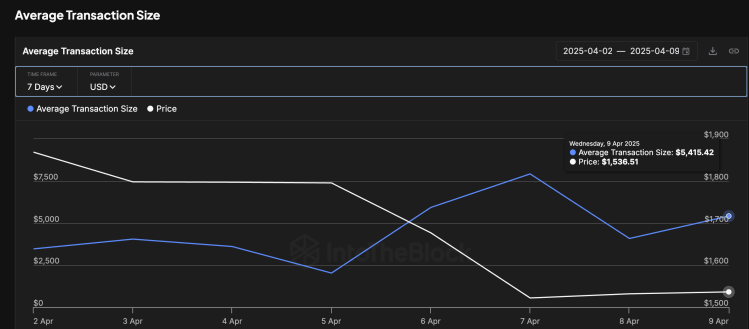
Ethereum whales have also been very active during this time and this could mean that large investors have been behind the selling that has crashed the ETH price. Large transactions rose from $4.8 billion to $6.48 billion by April 9 as the Ethernet price dropped back below $1,500.
Average transaction size also grew during the this time from $4,048 to $5,415. This suggests that investors are moving more coins at the time, which could explain the increased selling that has plagued the cryptocurrency. If this continues, then the ETH price could see further crashes from here.
At the time of writing, the Ethereum price was trending at $1,544, down 4.56% in the last day.
Featured image from Dall.E, chart from TradingView.com

Bankless Cofounder David Hoffman Reveals Strategy To Improve Ethereum Price Performance

Solana Bulls Lead 17% Recovery, Targeting $138

Ripple May Settle SEC’s $50 Million Fine Using XRP

Bitcoin’s Impact Alarming, Says NY Atty. General—Congress Needs To Act

Ethereum ETFs See Seventh Consecutive Week of Net Outflows

SEC Signals Readiness to Rethink Crypto Trading Oversight

2.52 Million Altcoins Are Ruining Crypto’s Future

Animoca Brands Valuation Tanks 75% In Two Years, Here’s Why

Crypto exchange BingX hacked for $43 million

Are The Big Players Losing Interest?

Hong Kong’s Securities Association Tips Authorities On Crypto Self-Regulation

Coinbase cbBTC Set to go Live on Solana
2.52 Million Altcoins Are Ruining Crypto’s Future
Animoca Brands Valuation Tanks 75% In Two Years, Here’s Why
Crypto exchange BingX hacked for $43 million
Are The Big Players Losing Interest?
Hong Kong’s Securities Association Tips Authorities On Crypto Self-Regulation
Coinbase cbBTC Set to go Live on Solana
-

 Market24 hours ago
3 Altcoins to Watch for Binance Listing This April
-

 Market21 hours ago
This is Why The Federal Reserve Might Not Cutting Interest Rates
-

 Market22 hours ago
Lawmakers Propose the PROOF Act to Avoid Another FTX Incident
-

 Market20 hours ago
XRP Price Flashes Symmetrical Triangle From 2017, A Repeat Could Send It as Flying To $30
-

 Market19 hours ago
Crypto Whales Are Buying These Altcoins Post Tariffs Pause
-

 Market18 hours ago
Binance and the SEC File for Pause in Lawsuit
-

 Altcoin7 hours ago
Binance Issues Important Update On 10 Crypto, Here’s All
-

 Market6 hours ago
Binance Reportedly Seeks Reentry Into American Market