
Market
XRP Price Plummets To $0.5724, Can Bulls Maintain Support?
In recent trading activities, XRP has experienced a significant retracement, dipping toward a critical support level of $0.5724. This retracement which is seen as a correctional movement to the crypto asset’s recent rally has caught the attention of traders and investors alike thereby raising speculations as to whether the bulls can maintain the $0.5724 support level.
This article provides an in-depth examination of the significance of the $0.5724 support level with the help of technical indicators and the potential future scenarios that could unfold when the coin reaches the level.
XRP’s price was trading at around $0.5816 and was down by 3.89% with a market capitalization of over $32.5 billion and a trading volume of over $3.8 billion as of the time of writing. There has been a decrease of 3.70% in XRP’s market capitalization and a 17.22% increase in its trading volume, in the last 24 hours.
Market Overview: Understanding The Recent Price Movement Of XRP
On the 4-hour chart, XRP is still trading above the 100-day Simple Moving Average (SMA) but is currently on a bearish trajectory toward the $0.5724 support level. It is important to note that XRP had previously broken above $0.5724, which acted as a resistance level, and is now retracing for a retest.
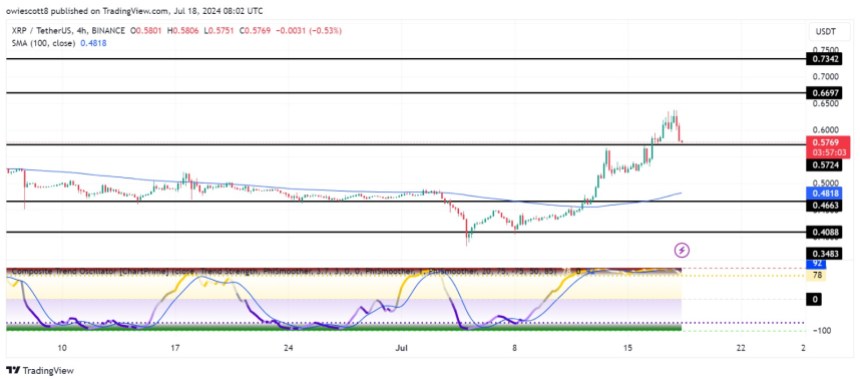
The 4-hour Composite Trend Oscillator confirms XRP’s recent price retracement, as the signal line has crossed below the SMA of the indicator, with both indicators currently attempting to move out of the overbought zone.
On the 1-day chart, XRP is making a bearish move toward the $0.5724 support level and the 100-day SMA. Despite this downward movement, the broader trend remains bullish, suggesting this could be a short-term retracement.
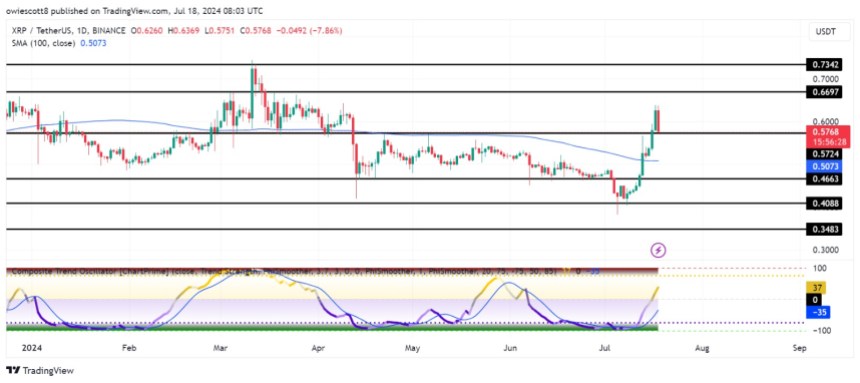
Finally, it can be observed that the signal line has crossed above the SMA of the indicator and moved out of the overbought zone, with both lines attempting to reach the zero line. This formation of the composite trend oscillator suggests that the long-term outlook remains bullish despite the current drop in XRP’s price.
The Significance Of The $0.5724 Support Level
The $0.5725 support level holds significant importance in the future potential price movement of XRP. Thus, should the price of XRP decline to the support level and encounter rejection, it would likely start an upward movement toward the $0.6697 resistance mark. A successful breach above this target could serve as a catalyst, potentially triggering further upward movement to test the $0.7342 resistance and beyond.
Nevertheless, should XRP’s price approach the $0.5725 support level and break below it, it may likely continue to move downward toward the $0.4663 support level. A further break below the $0.4663 support range could lead to a price drop toward the $0.4088 support level and other lower levels.


Gemini co-founder Cameron Winklevoss has called for a renewed investigation into the dropped campaign finance charges against Sam Bankman-Fried, the convicted founder of the now-defunct FTX exchange.
Winklevoss emphasized the need for the incoming US Attorney General to address unresolved concerns about how these charges, tied to election interference involving stolen customer funds, were handled.
Winklevoss Demands Probe Into FTX-Linked Election Interference Accusations
In a November 23 post on X, Winklevoss expressed the belief that the campaign finance allegations remain a critical issue. He pointed to the Department of Justice under Merrick Garland, which declined to pursue these charges due to extradition technicalities with the Bahamian government.
According to Winklevoss, the DOJ chose not to work through the required legal processes to include the campaign finance violations in the indictment, leaving the matter unaddressed.
“Merrick Garland’s DOJ refused to pursue campaign finance charges against SBF because they were not included in his extradition…Since when has paperwork stood in between a prosecutor and adding more charges? Especially when it involves election interference with $100m of stolen customer funds,” Winklevoss stated.
Federal prosecutors initially dropped the campaign finance charge last year, attributing their decision to objections from Bahamian authorities. This charge involved over $100 million allegedly funneled from Alameda Research to fund more than 300 political contributions.
According to the indictment, these contributions, often made through straw donors or corporate funds, aimed to enhance Bankman-Fried’s influence in Washington, D.C.
The indictment also noted that Bankman-Fried became a top political donor in the 2022 midterm elections. He allegedly used the funds to gain favor with candidates across party lines, potentially shaping legislation favorable to FTX and the broader crypto industry.
Winklevoss’ remarks come as other key figures in the FTX collapse face their consequences. While Caroline Ellison and Ryan Salame received sentences of two years and 7.5 years, respectively, Gary Wang and Nishad Singh avoided prison by cooperating with prosecutors. Bankman-Fried is currently serving a 25-year prison sentence for fraud and other crimes.
Meanwhile, FTX has announced plans to implement its approved reorganization strategy starting in January. The exchange’s bankruptcy managers have recovered billions of dollars for creditors and are intensifying efforts to reclaim assets held by other entities.
Disclaimer
In adherence to the Trust Project guidelines, BeInCrypto is committed to unbiased, transparent reporting. This news article aims to provide accurate, timely information. However, readers are advised to verify facts independently and consult with a professional before making any decisions based on this content. Please note that our Terms and Conditions, Privacy Policy, and Disclaimers have been updated.
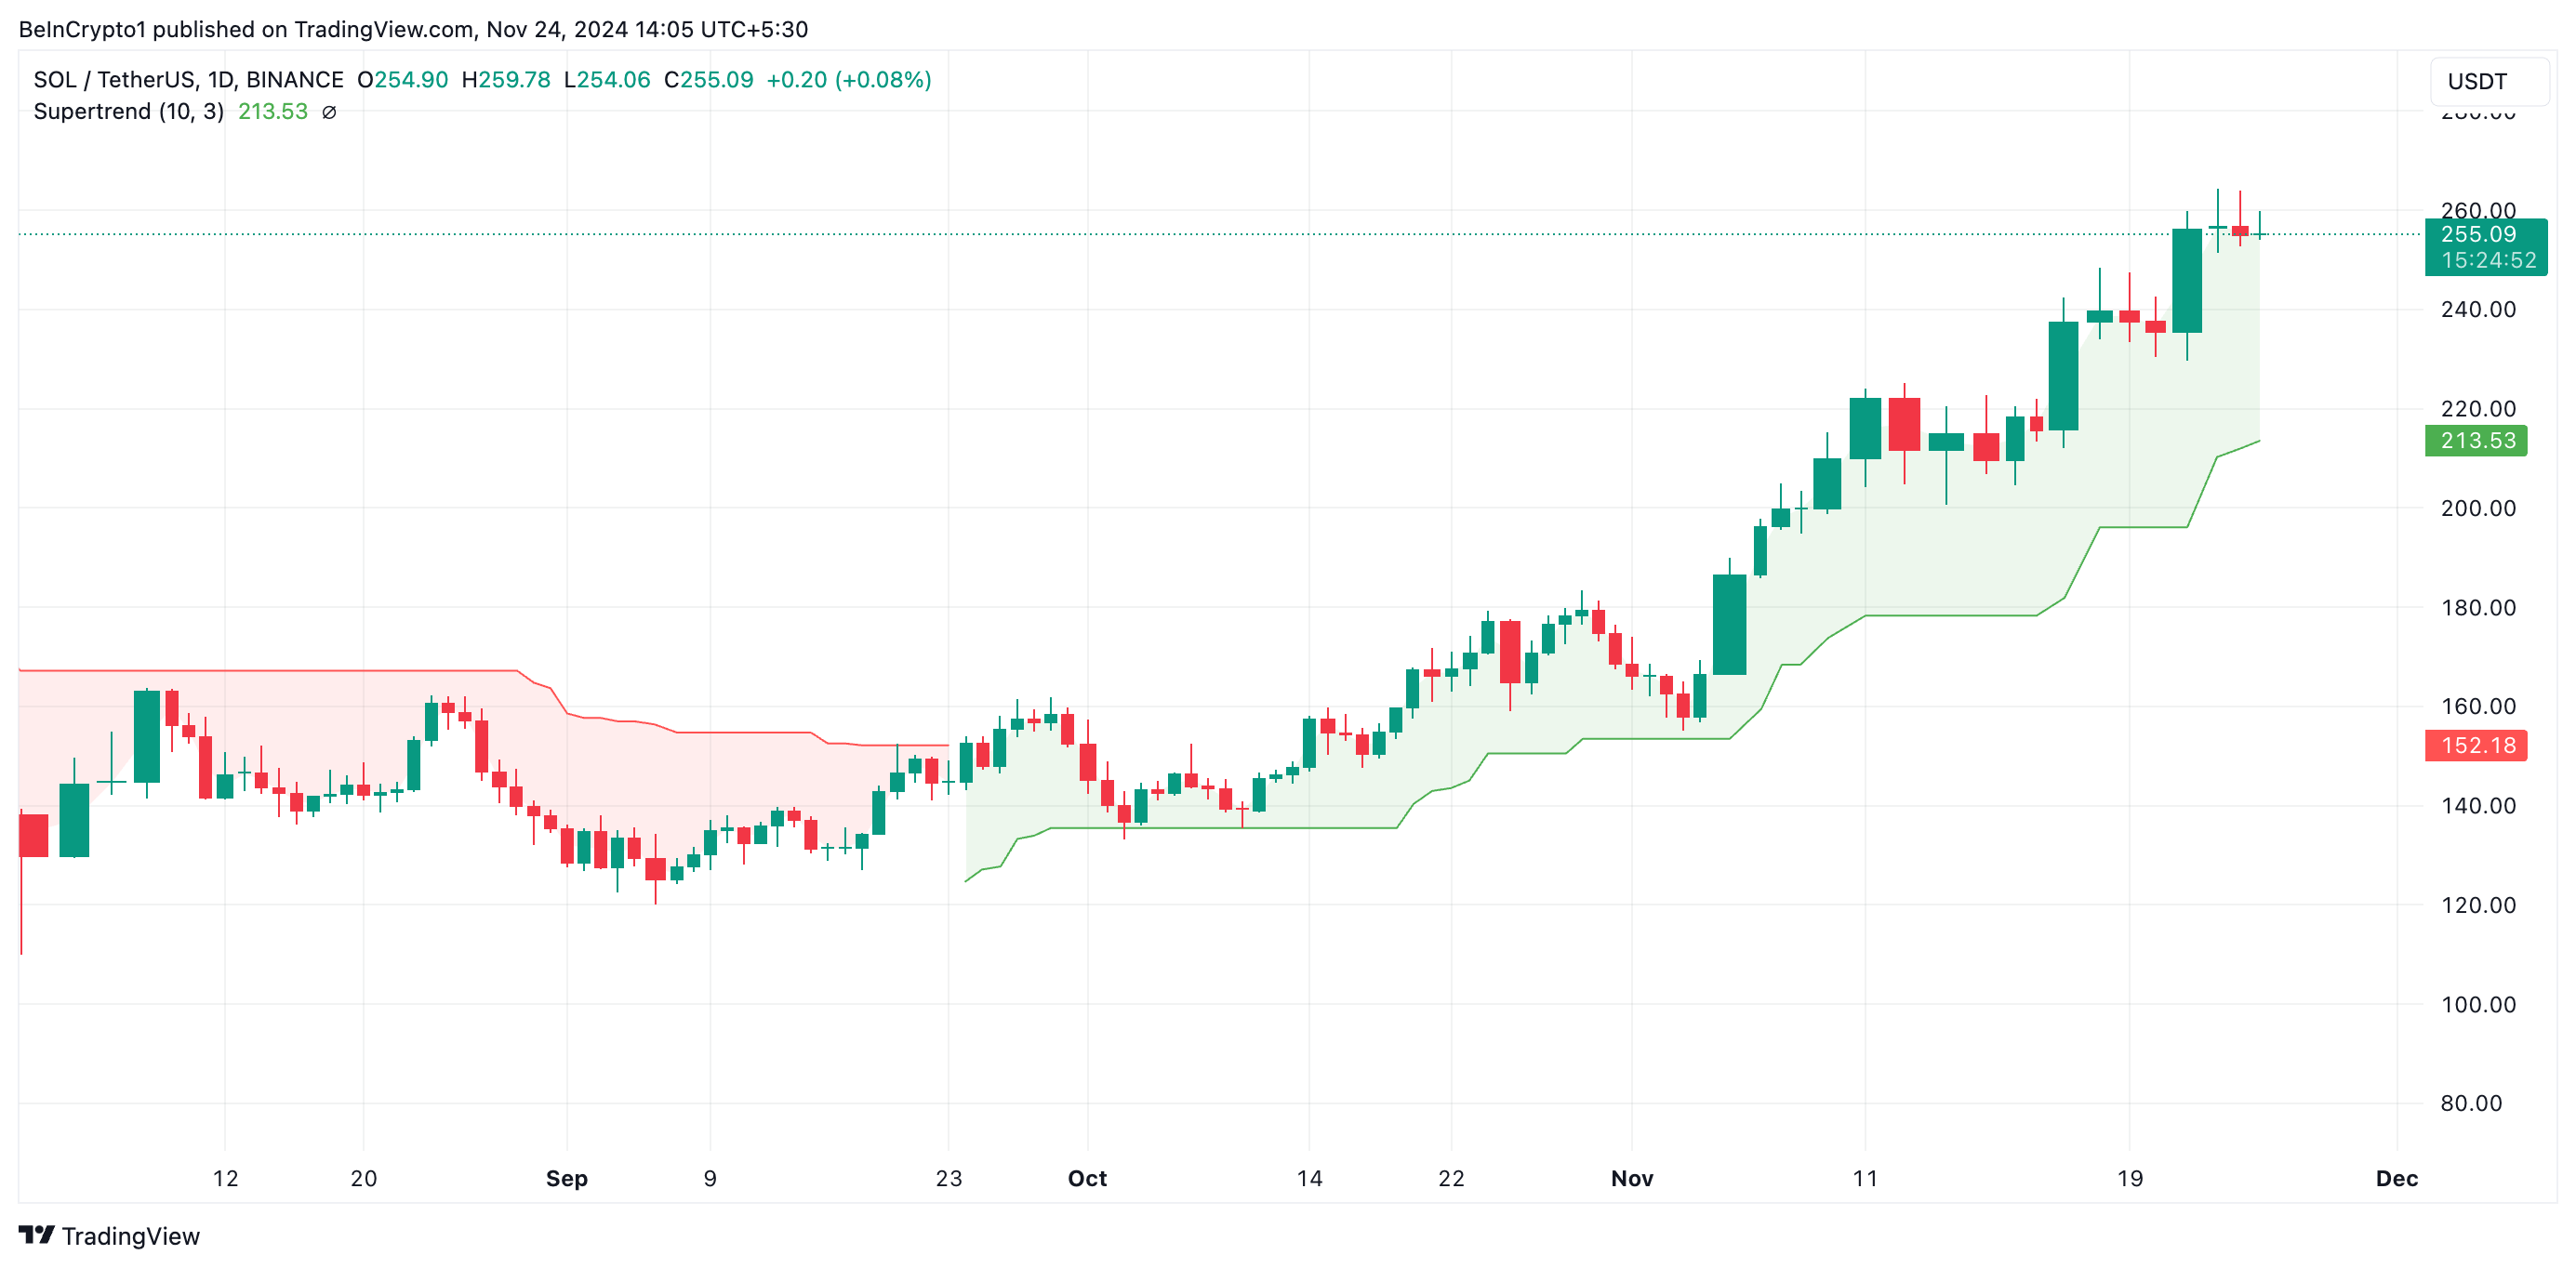
Solana’s (SOL) price clinched a new all-time high of $264.39 during the trading session on November 23. Its price has since witnessed a 3% correction, causing the popular altcoin to exchange hands at $255.12 as of this writing.
Despite this pullback, the bullish bias toward the altcoin strengthens. An assessment of its daily chart highlights two reasons why a new Solana all-time high may be on the horizon.
Solana Bulls Relegates Its Bears
On the SOL/USD one-day chart, its price is positioned above the green line of its Super Trend indicator. This indicator measures the overall direction and strength of a price trend. It appears as a line on the chart, changing color based on the prevailing trend: green signifies an uptrend, while red indicates a downtrend.
When the Super Trend line is above an asset’s price, it signals a downtrend, suggesting continued bearish momentum. In Solana’s case, when the Super Trend line turns green and moves below the price, buyers are in control.
This green line often acts as a support level, where increased buying pressure can drive a rebound following price dips. For Solana, this support is currently set at $213.53.
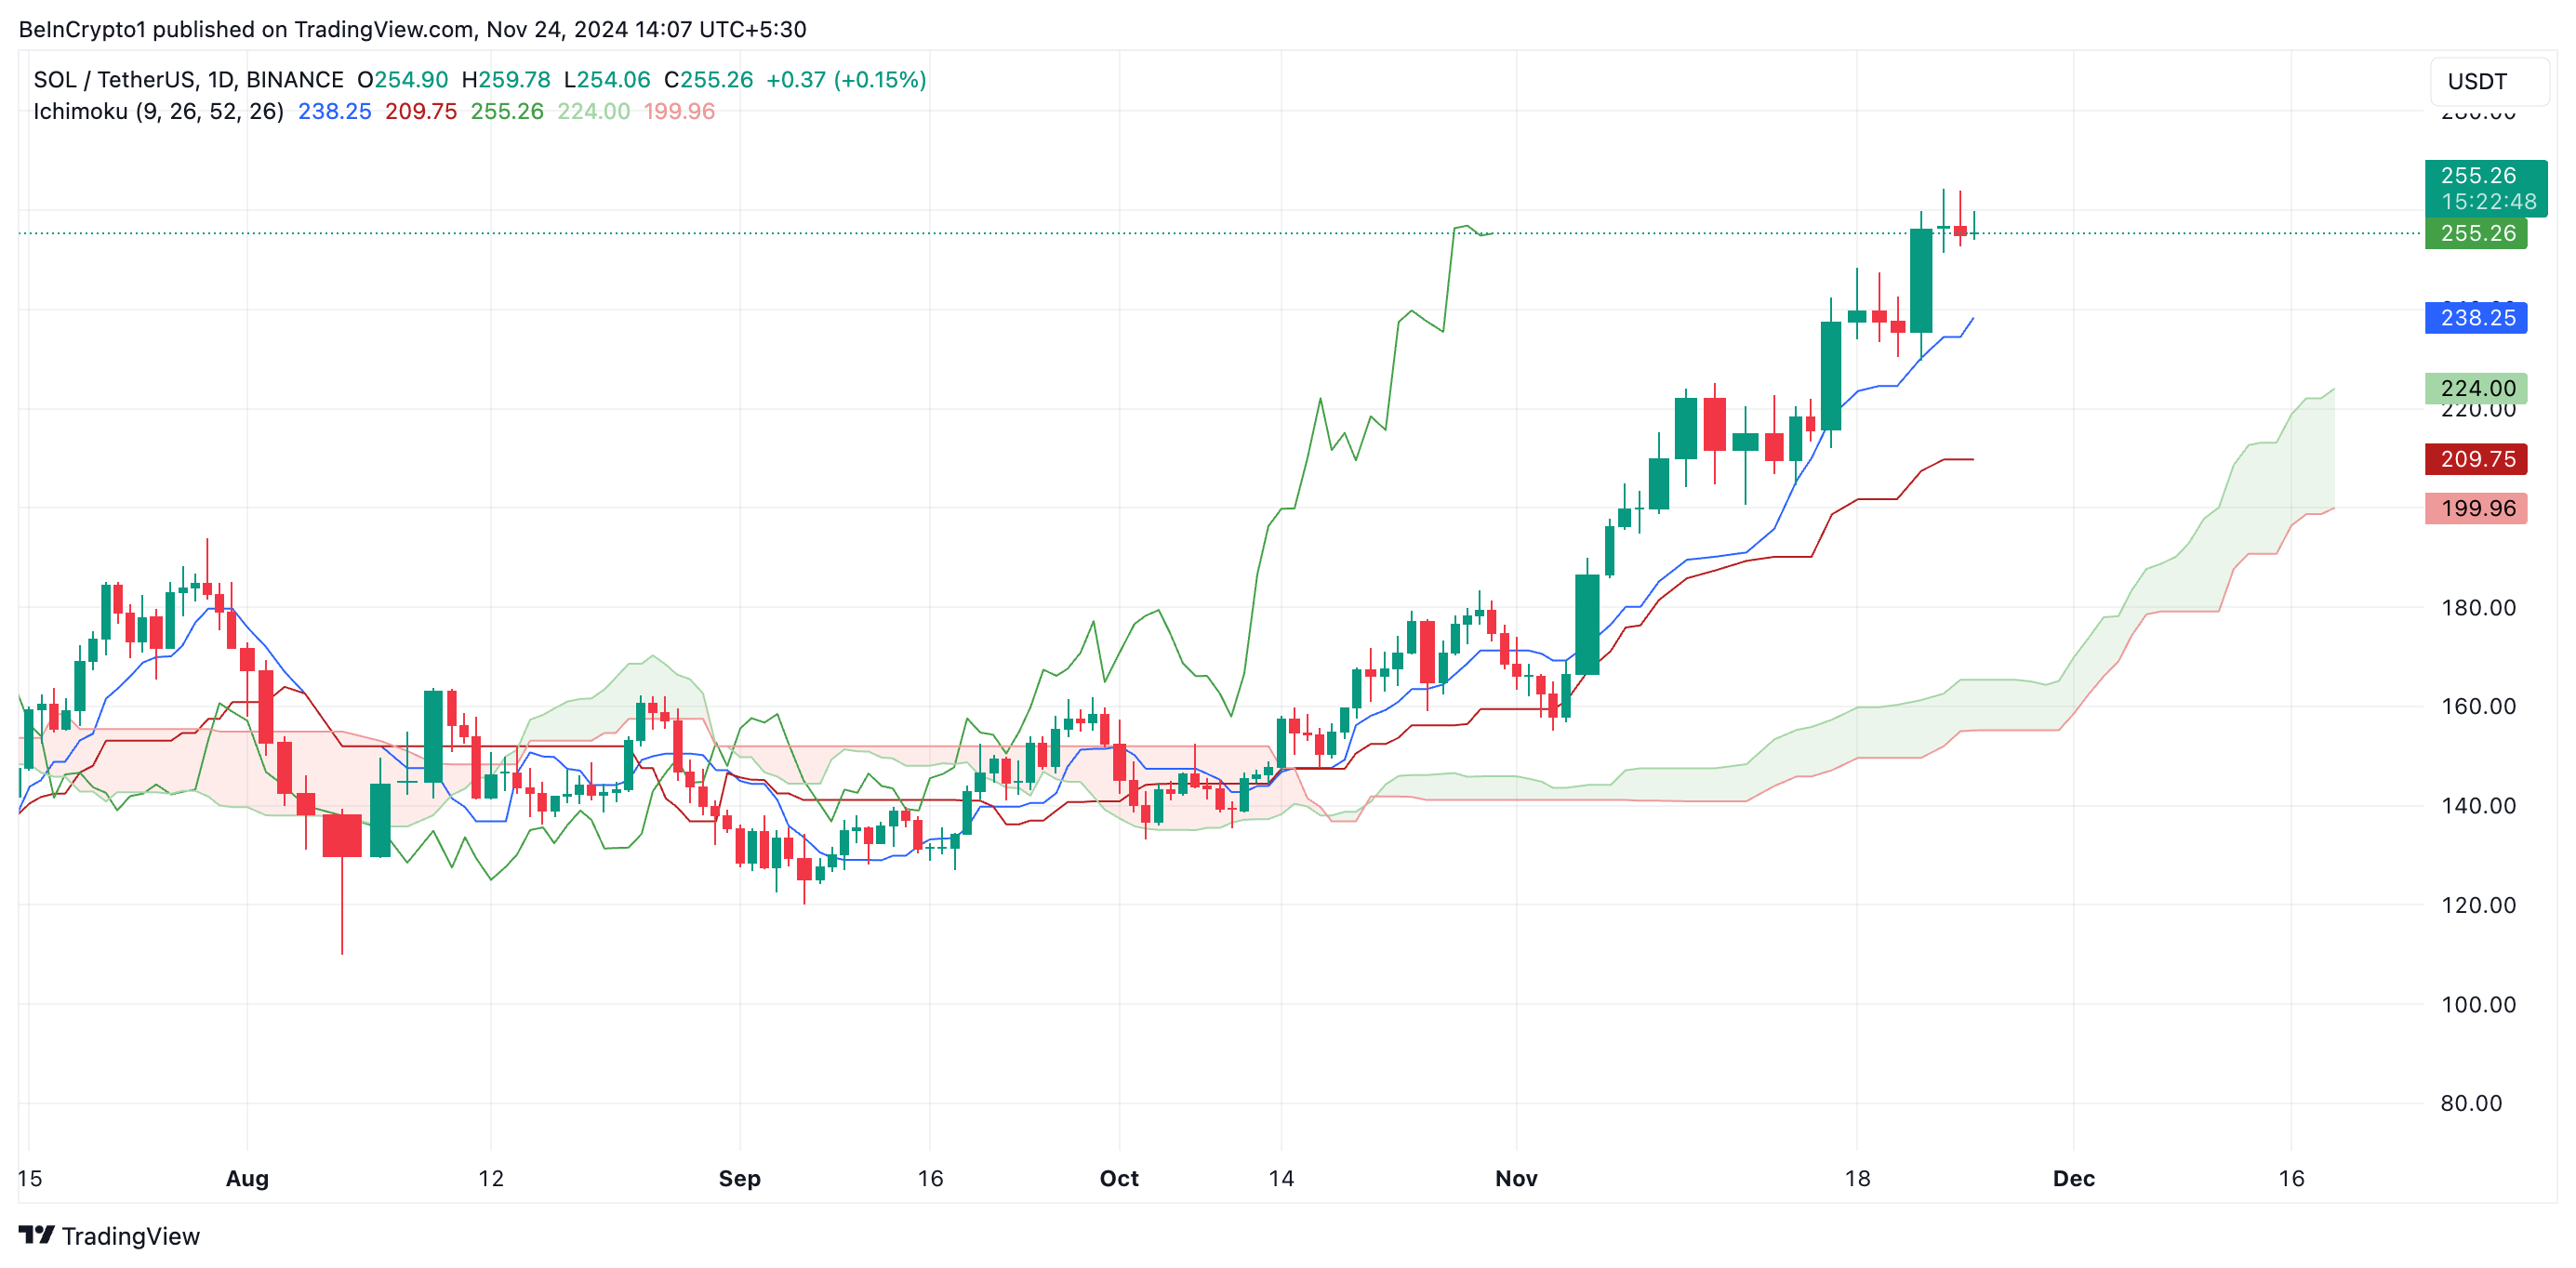
Further, the coin’s price rests significantly above its Ichimoku Cloud, confirming this bullish outlook. This indicator tracks the momentum of an asset’s market trends and identifies potential support/resistance levels.
When an asset’s price rests above the Ichimoku Cloud, it signals a bullish trend. It indicates that the asset is on an upward trend with the potential for further gains. In this case, the Cloud is a dynamic support zone below the price, reinforcing bullish sentiment.
SOL Price Prediction: New High on the Horizon
At press time, SOL trades at $255.12, below the new resistance at its all-time high of $264.39. If buying pressure strengthens further, the coin’s price will flip this level into a support floor and attempt to touch a new peak.

On the other hand, if profit-taking activity resurges, SOL’s price will shed some of its current gains to trade at $231.35. Should this level fail to hand, SOL’s price will fall toward the support formed by its Super Trend indicator at $213.53. This will invalidate the possibility of a new Solana all-time high in the near term.
Disclaimer
In line with the Trust Project guidelines, this price analysis article is for informational purposes only and should not be considered financial or investment advice. BeInCrypto is committed to accurate, unbiased reporting, but market conditions are subject to change without notice. Always conduct your own research and consult with a professional before making any financial decisions. Please note that our Terms and Conditions, Privacy Policy, and Disclaimers have been updated.

My name is Godspower Owie, and I was born and brought up in Edo State, Nigeria. I grew up with my three siblings who have always been my idols and mentors, helping me to grow and understand the way of life.
My parents are literally the backbone of my story. They’ve always supported me in good and bad times and never for once left my side whenever I feel lost in this world. Honestly, having such amazing parents makes you feel safe and secure, and I won’t trade them for anything else in this world.
I was exposed to the cryptocurrency world 3 years ago and got so interested in knowing so much about it. It all started when a friend of mine invested in a crypto asset, which he yielded massive gains from his investments.
When I confronted him about cryptocurrency he explained his journey so far in the field. It was impressive getting to know about his consistency and dedication in the space despite the risks involved, and these are the major reasons why I got so interested in cryptocurrency.
Trust me, I’ve had my share of experience with the ups and downs in the market but I never for once lost the passion to grow in the field. This is because I believe growth leads to excellence and that’s my goal in the field. And today, I am an employee of Bitcoinnist and NewsBTC news outlets.
My Bosses and co-workers are the best kinds of people I have ever worked with, in and outside the crypto landscape. I intend to give my all working alongside my amazing colleagues for the growth of these companies.
Sometimes I like to picture myself as an explorer, this is because I like visiting new places, I like learning new things (useful things to be precise), I like meeting new people – people who make an impact in my life no matter how little it is.
One of the things I love and enjoy doing the most is football. It will remain my favorite outdoor activity, probably because I’m so good at it. I am also very good at singing, dancing, acting, fashion and others.
I cherish my time, work, family, and loved ones. I mean, those are probably the most important things in anyone’s life. I don’t chase illusions, I chase dreams.
I know there is still a lot about myself that I need to figure out as I strive to become successful in life. I’m certain I will get there because I know I am not a quitter, and I will give my all till the very end to see myself at the top.
I aspire to be a boss someday, having people work under me just as I’ve worked under great people. This is one of my biggest dreams professionally, and one I do not take lightly. Everyone knows the road ahead is not as easy as it looks, but with God Almighty, my family, and shared passion friends, there is no stopping me.

AI Company Invests $10 Million In BTC Treasury

Bitcoin Correction Looms As Analyst Predicts Fall To $85,600
Winklevoss Urges Scrutiny of FTX and SBF Political Donations

Bitcoin Price Is Decoupling From Gold Again — What’s Happening?

Why a New Solana All-Time High May Be Near

Dogecoin Fractal Points To A Potential Breakout, Can It Reach A New ATH?

2.52 Million Altcoins Are Ruining Crypto’s Future

Animoca Brands Valuation Tanks 75% In Two Years, Here’s Why

Crypto exchange BingX hacked for $43 million

Are The Big Players Losing Interest?

Hong Kong’s Securities Association Tips Authorities On Crypto Self-Regulation

Coinbase cbBTC Set to go Live on Solana
2.52 Million Altcoins Are Ruining Crypto’s Future
Animoca Brands Valuation Tanks 75% In Two Years, Here’s Why
Crypto exchange BingX hacked for $43 million
Are The Big Players Losing Interest?
Hong Kong’s Securities Association Tips Authorities On Crypto Self-Regulation
Coinbase cbBTC Set to go Live on Solana
-
 Altcoin8 hours ago
BTC Continues To Soar, Ripple’s XRP Bullish
-
 Market23 hours ago
SEC Secures Record $8.2 Billion in 2024 Financial Remedies
-
 Altcoin23 hours ago
Dogecoin Price Forms Extremely Rare And Bullish High Tight Flag Pattern, What To Expect Next
-
 Altcoin22 hours ago
Crypto Trader Records $2.5M Profit With This Token, Here’s All
-
 Market21 hours ago
Why the Altcoin Season May Be Underway
-

 Market19 hours ago
Why BTC Miners Are Selling Their Coins
-

 Market17 hours ago
Kraken Eyes Token Expansion as Trump Promises Crypto Support
-
 Altcoin17 hours ago
XRP Price To $28: Wave Analysis Reveals When It Will Reach Double-Digits