
Market
Altcoin Season Hopes Revived by These 3 Leading Altcoins

Just a few days ago, only six out of the top 50 altcoins outperformed Bitcoin (BTC). But today, that has changed, fueling fresh speculation of an altcoin season.
The interesting part of this development is not only the addition of three new cryptocurrencies but also the fact that the new entrants are all in the top ten by market cap. They include Solana (SOL), Ethereum (ETH), and Ripple (XRP).
Is the Rotation to Altcoins High Risk, High Reward?
It is important to note that altcoin season starts when at least 75% of the non-Bitcoin cryptos perform better than BTC. Still, only nine are doing that, meaning that the altcoins’ dominance period has yet to be confirmed.
As mentioned above, the performance of SOL, ETH, and XRP is boosting the market’s confidence. Glassnode founders Jan Happel, Rafael Schultze-Kraft, and Yann Allemann also echo this assertion.
Using their joint X account Negentropic, the founders of the on-chain analytic platform, noted that the rotation of capital into riskier assets may soon begin in the crypto market.
Firstly, they compared the changes in the traditional market and used that as an inference for potential switches in the crypto market.
“Will we also see this is BTC and Alts? Well – in November 2020, we had a day just like yesterday. IWM soared and continued up for the coming months. This was the starting signal to the strongest part of the Alt-rally for the coming 4 months as Total3 rallied by ~400% in just 4 months. Will we see the same again? Will rotation create a massive rally in Alts? We think that may well happen!” Negentropic posted on July 12.
Furthermore, Solana, Ripple, and Ethereum’s entrance into the fold can be linked to their price action.
Over the last seven days, SOL’s price increased by 9.31%, ETH jumped by 9.56%, and XRP was the surprising gainer with an incredible 21.97% hike.
Here is how the cryptos may perform as the much-anticipated altcoin season nears.
Solana (SOL) Eyes Higher Prices After 9% Increase
The current SOL/USD daily chart shows that the altcoin has formed a symmetrical triangle. This chart pattern is characterized by converging trendlines which connect a series of lower highs and higher lows.
The lower highs act as resistance, while the higher lows act as support. In addition, the price of SOL is looking to break through the triangle. If this happens, Solana will exit the consolidation phase and head toward a huge breakout.
Furthermore, the Fibonacci Retracement indicator spots potential resistance and support points for the token. As seen in the chart below, SOL may elevate toward $162.79 in the coming days.
Read More: What Is Altcoin Season? A Comprehensive Guide
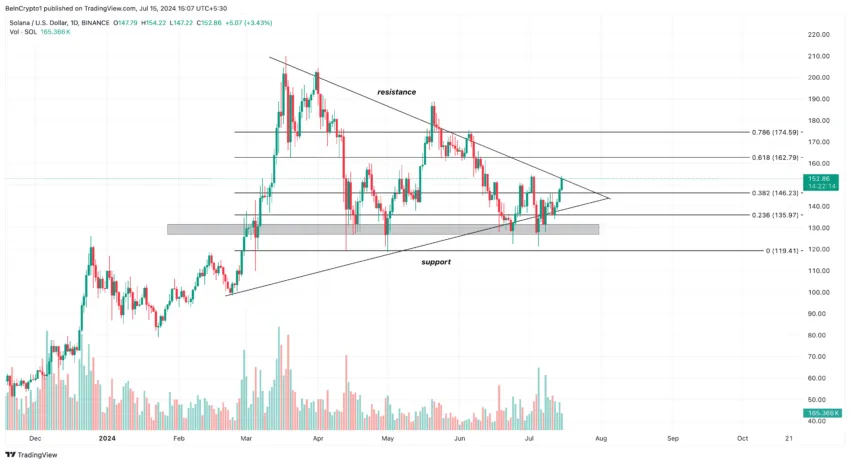
This is where the 0.618 Fibonacci positions. If successful, this can drive the altcoin price to retest $174.59. However, in the case of a pullback, SOL’s price can retrace to $135.97.
Ethereum (ETH) Breaches Key Resistance, Set for $3,622
At press time, ETH trades at $3,360. The price is also trading above the 20-day EMA (blue). EMA is an acronym for Exponential Moving Average, and it measures changes in price direction over a period of time.
If the EMA is above the price, it means the trend is bearish. But since ETH changes hands above the 20 EMA, it implies that the trend is bullish. Further, the Relative Strength Index (RSI) supports this bias.
The RSI measures momentum, and since it is above the neutral line, it means bulls are in control of ETH’s movement. Evidence of this is the break past the resistance at $3,255 and the defense at $2,946.
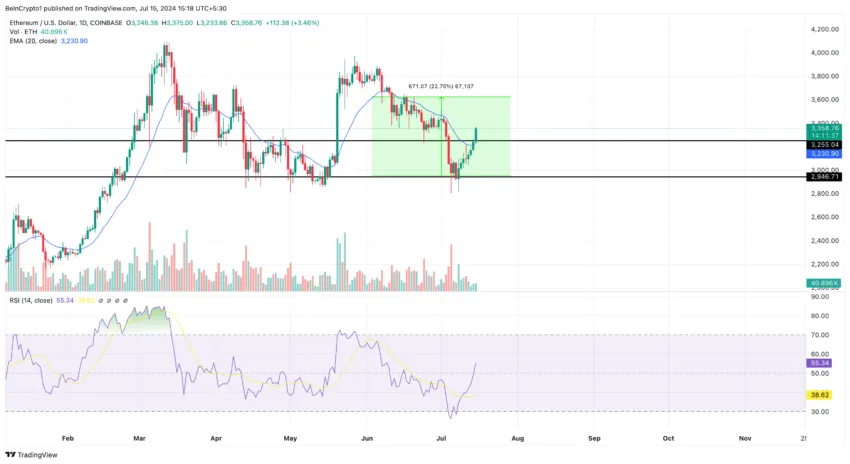
Should the momentum remain bullish and the hype around the spot Ethereum ETF launch persist, the price may reach $3,622. However, if selling pressure comes into play, ETH’s price may decrease to $3,132.
Ripple (XRP) Breaks Out of Descending Channel
Initially, XRP encountered a multi-month descending channel, with downward trendlines connecting lower highs and lower lows. However, analysis shows that the altcoin exploded after buying interest intensified at $0.42. This later led to the token’s hike to $0.53.
At press time, the Money Flow Index (MFI) reveals that high demand for XRP remains present. As such, it is not out of place to expect a price increase to $0.55. If successful, the price of XRP might reach $0.57.
Read More: 11 Cryptos To Add To Your Portfolio Before Altcoin Season
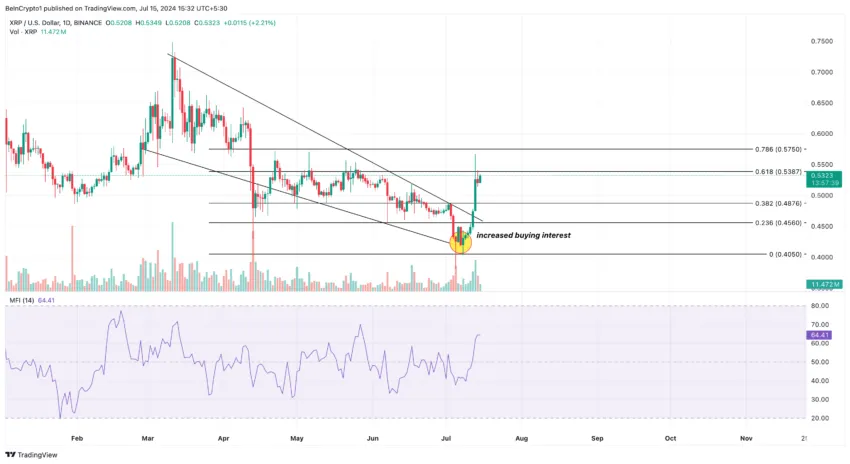
However, $0.57 is crucial for the token, especially as it has been rejected at this point a number of times. If bulls breach the resistance, Ripple can look toward $0.60. However, another rejection at this point may force the price back to $0.52.
All in all, it seems that the altcoin season for this cycle is getting closer by the day. However, traders in the market need to watch Bitcoin, considering that it has been able to reclaim $62,000.
If the price of BTC continues to increase and Bitcoin dominance jumps, this will invalidate a rise in the prices of altcoins.
Disclaimer
In line with the Trust Project guidelines, this price analysis article is for informational purposes only and should not be considered financial or investment advice. BeInCrypto is committed to accurate, unbiased reporting, but market conditions are subject to change without notice. Always conduct your own research and consult with a professional before making any financial decisions. Please note that our Terms and Conditions, Privacy Policy, and Disclaimers have been updated.


Aayush Jindal, a luminary in the world of financial markets, whose expertise spans over 15 illustrious years in the realms of Forex and cryptocurrency trading. Renowned for his unparalleled proficiency in providing technical analysis, Aayush is a trusted advisor and senior market expert to investors worldwide, guiding them through the intricate landscapes of modern finance with his keen insights and astute chart analysis.
From a young age, Aayush exhibited a natural aptitude for deciphering complex systems and unraveling patterns. Fueled by an insatiable curiosity for understanding market dynamics, he embarked on a journey that would lead him to become one of the foremost authorities in the fields of Forex and crypto trading. With a meticulous eye for detail and an unwavering commitment to excellence, Aayush honed his craft over the years, mastering the art of technical analysis and chart interpretation.
As a software engineer, Aayush harnesses the power of technology to optimize trading strategies and develop innovative solutions for navigating the volatile waters of financial markets. His background in software engineering has equipped him with a unique skill set, enabling him to leverage cutting-edge tools and algorithms to gain a competitive edge in an ever-evolving landscape.
In addition to his roles in finance and technology, Aayush serves as the director of a prestigious IT company, where he spearheads initiatives aimed at driving digital innovation and transformation. Under his visionary leadership, the company has flourished, cementing its position as a leader in the tech industry and paving the way for groundbreaking advancements in software development and IT solutions.
Despite his demanding professional commitments, Aayush is a firm believer in the importance of work-life balance. An avid traveler and adventurer, he finds solace in exploring new destinations, immersing himself in different cultures, and forging lasting memories along the way. Whether he’s trekking through the Himalayas, diving in the azure waters of the Maldives, or experiencing the vibrant energy of bustling metropolises, Aayush embraces every opportunity to broaden his horizons and create unforgettable experiences.
Aayush’s journey to success is marked by a relentless pursuit of excellence and a steadfast commitment to continuous learning and growth. His academic achievements are a testament to his dedication and passion for excellence, having completed his software engineering with honors and excelling in every department.
At his core, Aayush is driven by a profound passion for analyzing markets and uncovering profitable opportunities amidst volatility. Whether he’s poring over price charts, identifying key support and resistance levels, or providing insightful analysis to his clients and followers, Aayush’s unwavering dedication to his craft sets him apart as a true industry leader and a beacon of inspiration to aspiring traders around the globe.
In a world where uncertainty reigns supreme, Aayush Jindal stands as a guiding light, illuminating the path to financial success with his unparalleled expertise, unwavering integrity, and boundless enthusiasm for the markets.

Global investment management firm VanEck has officially registered a statutory trust in Delaware for Binance’s BNB (BNB) exchange-traded fund (ETF).
This move marks the first attempt to launch a spot BNB ETF in the United States. It could potentially open new avenues for institutional and retail investors to gain exposure to the asset through a regulated investment vehicle.
VanEck Moves Forward with BNB ETF
The trust was registered on March 31 under the name “VanEck BNB ETF” with filing number 10148820. It was recorded on Delaware’s official state website.

The proposed BNB ETF would track the price of BNB. It is the native cryptocurrency of the BNB Chain ecosystem, developed by the cryptocurrency exchange Binance.
As per the latest data, BNB ranks as the fifth-largest cryptocurrency by market capitalization at $87.1 billion. Despite its significant market position, both BNB’s price and the broader cryptocurrency market have faced some challenges recently.
Over the past month, the altcoin’s value has declined 2.2%. At the time of writing, BNB was trading at $598. This represented a 1.7% dip in the last 24 hours, according to data from BeInCrypto.

While the trust filing hasn’t yet led to a price uptick, the community remains optimistic about the prospects of BNB, especially with this new development.
“Send BNB to the moon now,” an analyst posted on X (formerly Twitter).
The filing comes just weeks after VanEck made a similar move for Avalanche (AVAX). On March 10, VanEck registered a trust for an AVAX-focused ETF.
This was quickly followed by the filing of an S-1 registration statement with the US Securities and Exchange Commission (SEC). Given this precedent, a similar S-1 filing for a BNB ETF could follow soon.
“A big step toward bringing BNB to US institutional investors!” another analyst wrote.
Meanwhile, the industry has seen an influx of crypto fund applications at the SEC following the election of a pro-crypto administration. In fact, a recent survey revealed that 71% of ETF investors are bullish on crypto and plan to increase their allocations to cryptocurrency ETFs in the next 12 months.
“Three-quarters of allocators expect to increase their investment in cryptocurrency-focused ETFs over the next 12 months, with demand highest in Asia (80%), and the US (76%), in contrast to Europe (59%),” the survey revealed.
This growing interest in crypto ETFs could drive further demand for assets like BNB, making the VanEck BNB ETF a potentially significant product in the market.
Disclaimer
In adherence to the Trust Project guidelines, BeInCrypto is committed to unbiased, transparent reporting. This news article aims to provide accurate, timely information. However, readers are advised to verify facts independently and consult with a professional before making any decisions based on this content. Please note that our Terms and Conditions, Privacy Policy, and Disclaimers have been updated.
XRP price started a fresh decline from the $2.20 zone. The price is now consolidating and might face hurdles near the $2.120 level.
- XRP price started a fresh decline after it failed to clear the $2.20 resistance zone.
- The price is now trading below $2.150 and the 100-hourly Simple Moving Average.
- There is a connecting bearish trend line forming with resistance at $2.120 on the hourly chart of the XRP/USD pair (data source from Kraken).
- The pair might extend losses if it fails to clear the $2.20 resistance zone.
XRP Price Faces Rejection
XRP price failed to continue higher above the $2.20 resistance zone and reacted to the downside, like Bitcoin and Ethereum. The price declined below the $2.150 and $2.120 levels.
The bears were able to push the price below the 50% Fib retracement level of the recovery wave from the $2.023 swing low to the $2.199 high. There is also a connecting bearish trend line forming with resistance at $2.120 on the hourly chart of the XRP/USD pair.
The price is now trading below $2.150 and the 100-hourly Simple Moving Average. However, the bulls are now active near the $2.10 support level. They are protecting the 61.8% Fib retracement level of the recovery wave from the $2.023 swing low to the $2.199 high.

On the upside, the price might face resistance near the $2.120 level and the trend line zone. The first major resistance is near the $2.150 level. The next resistance is $2.20. A clear move above the $2.20 resistance might send the price toward the $2.240 resistance. Any more gains might send the price toward the $2.2650 resistance or even $2.2880 in the near term. The next major hurdle for the bulls might be $2.320.
Another Decline?
If XRP fails to clear the $2.150 resistance zone, it could start another decline. Initial support on the downside is near the $2.10 level. The next major support is near the $2.0650 level.
If there is a downside break and a close below the $2.0650 level, the price might continue to decline toward the $2.020 support. The next major support sits near the $2.00 zone.
Technical Indicators
Hourly MACD – The MACD for XRP/USD is now gaining pace in the bearish zone.
Hourly RSI (Relative Strength Index) – The RSI for XRP/USD is now below the 50 level.
Major Support Levels – $2.10 and $2.050.
Major Resistance Levels – $2.120 and $2.20.

Kraken Obtains Restricted Dealer Registration in Canada

Lummis Confirms Treasury Probes Direct Buys

Franklin Templeton Eyes Crypto ETP Launch In Europe After BlackRock & 21Shares

What’s Fueling The Shibarium Boost?

BNB Price Faces More Downside—Can Bulls Step In?

Tokenized Gold Market Cap Tops $1.2 Billion as Gold Prices Surge

2.52 Million Altcoins Are Ruining Crypto’s Future

Animoca Brands Valuation Tanks 75% In Two Years, Here’s Why

Crypto exchange BingX hacked for $43 million

Are The Big Players Losing Interest?

Hong Kong’s Securities Association Tips Authorities On Crypto Self-Regulation

Coinbase cbBTC Set to go Live on Solana
2.52 Million Altcoins Are Ruining Crypto’s Future
Animoca Brands Valuation Tanks 75% In Two Years, Here’s Why
Crypto exchange BingX hacked for $43 million
Are The Big Players Losing Interest?
Hong Kong’s Securities Association Tips Authorities On Crypto Self-Regulation
Coinbase cbBTC Set to go Live on Solana
-
 Altcoin23 hours ago
XRP Price to $27? Expert Predicts Exact Timeline for the Next Massive Surge
-

 Market23 hours ago
Binance Megadrop Launches KernelDAO
-

 Market22 hours ago
Ethereum Struggles to Break Out as Bear Trend Fades
-

 Market21 hours ago
How Did UPCX Lose $70 Million in a UPC Hack?
-

 Market20 hours ago
Hill Rejects Interest-Bearing Stablecoins Despite Armstrong’s Wish
-

 Bitcoin17 hours ago
Bitcoin Could Serve as Inflation Hedge or Tech Stock, Say Experts
-
 Market17 hours ago
SUI Price Stalls After Major $147 Million Token Unlock
-

 Market16 hours ago
BeInCrypto US Morning Briefing: Standard Chartered and Bitcoin