
Bitcoin
Bitcoin Forms Bullish On-Chain Signal That Led To 200% Price Rally Last Time

According to the latest on-chain observation, the Bitcoin traders’ realized losses have reached a level that has proven critical to the coin’s movement multiple times in recent years. This begs the question — is the Bitcoin price bottoming out?
Traders’ Realized Losses Below -12 Again — What Happened Last Time?
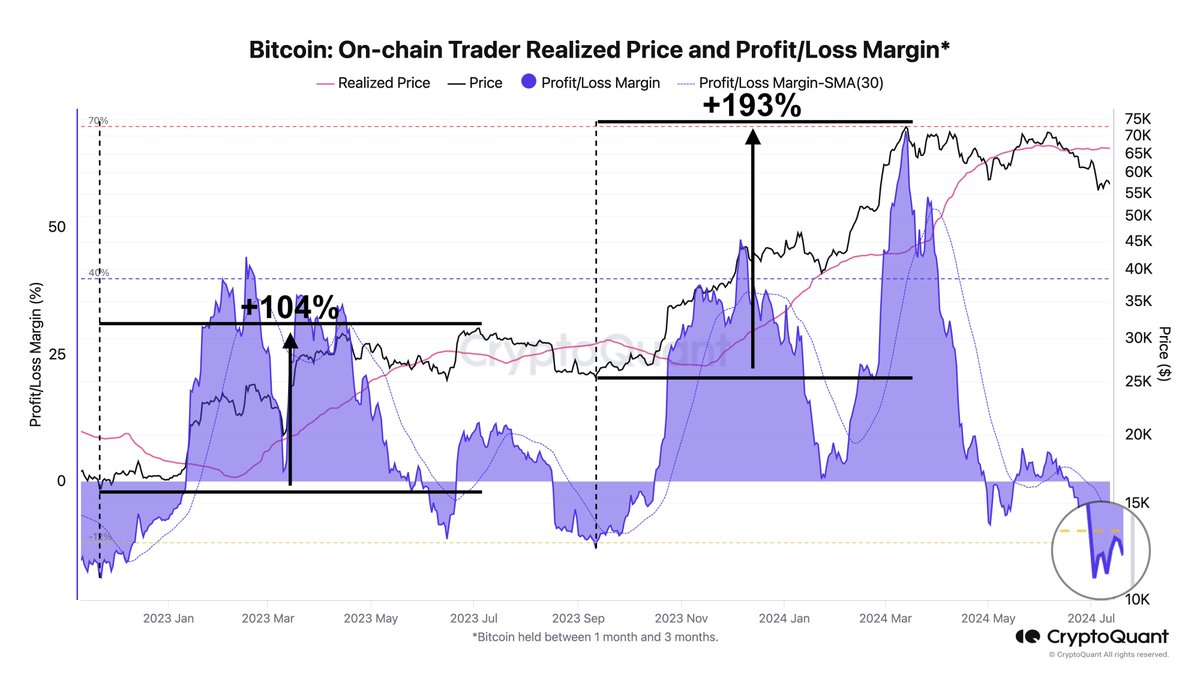
In a recent post on the X platform, prominent crypto analyst Ali Martinez pointed out that the amount of losses being realized by Bitcoin traders has been increasing in recent weeks. This on-chain revelation is based on the CryptoQuant Profit/Loss Margin metric, which aggregates profits and losses from all Bitcoin transactions.
The Profit/Loss Margin basically assesses the overall profitability of investors of a particular cryptocurrency (Bitcoin, in this scenario). When the metric’s value is positive, it implies that more BTC is being sold at a profit. A negative Profit/Loss Margin, on the other hand, indicates that more Bitcoin is being sold at a loss.
According to data from CryptoQuant, the Profit/Loss Margin is currently beneath the -12 mark, meaning that traders are realizing more losses than gains in the market at the moment. Historically, this level is more significant, considering that the metric has been below the -12 mark in the past cycles.
Interestingly, the recent times in which the Profit/Loss Margin has fallen below -12 has been followed by periods of significant bullish price action. As shown in the chart and highlighted by Martinez, the last two times the metric fell beneath this level were marked by 104% and 193% price rallies, respectively.
Source: Ali_charts/X
If this historical pattern is anything to go by, then there is a likelihood that the price of Bitcoin might experience notable bullish activity in the near future. Moreover, observation of significant losses in the market can suggest the bottom of a bearish cycle and the start of a more positive phase.
Bitcoin Price To Surge? Here Are Important Levels To Watch
If the historical pattern does hold true and the Bitcoin price goes on a rally, there are a couple of price zones to watch out for. According to Martinez, the premier cryptocurrency has major resistance levels around the $61,340 and $64,620 zones.
This revelation is based on the cost basis of Bitcoin investors and the distribution of the BTC supply across various price ranges. The size of the dots in the chart below reflects the strength of the resistance and support and the amount of BTC purchased at each price zone.
Key resistance levels for #Bitcoin to monitor are $61,340 and $64,620. The crucial support level to watch is $57,670! pic.twitter.com/YrBPkJmWzn
— Ali (@ali_charts) July 13, 2024
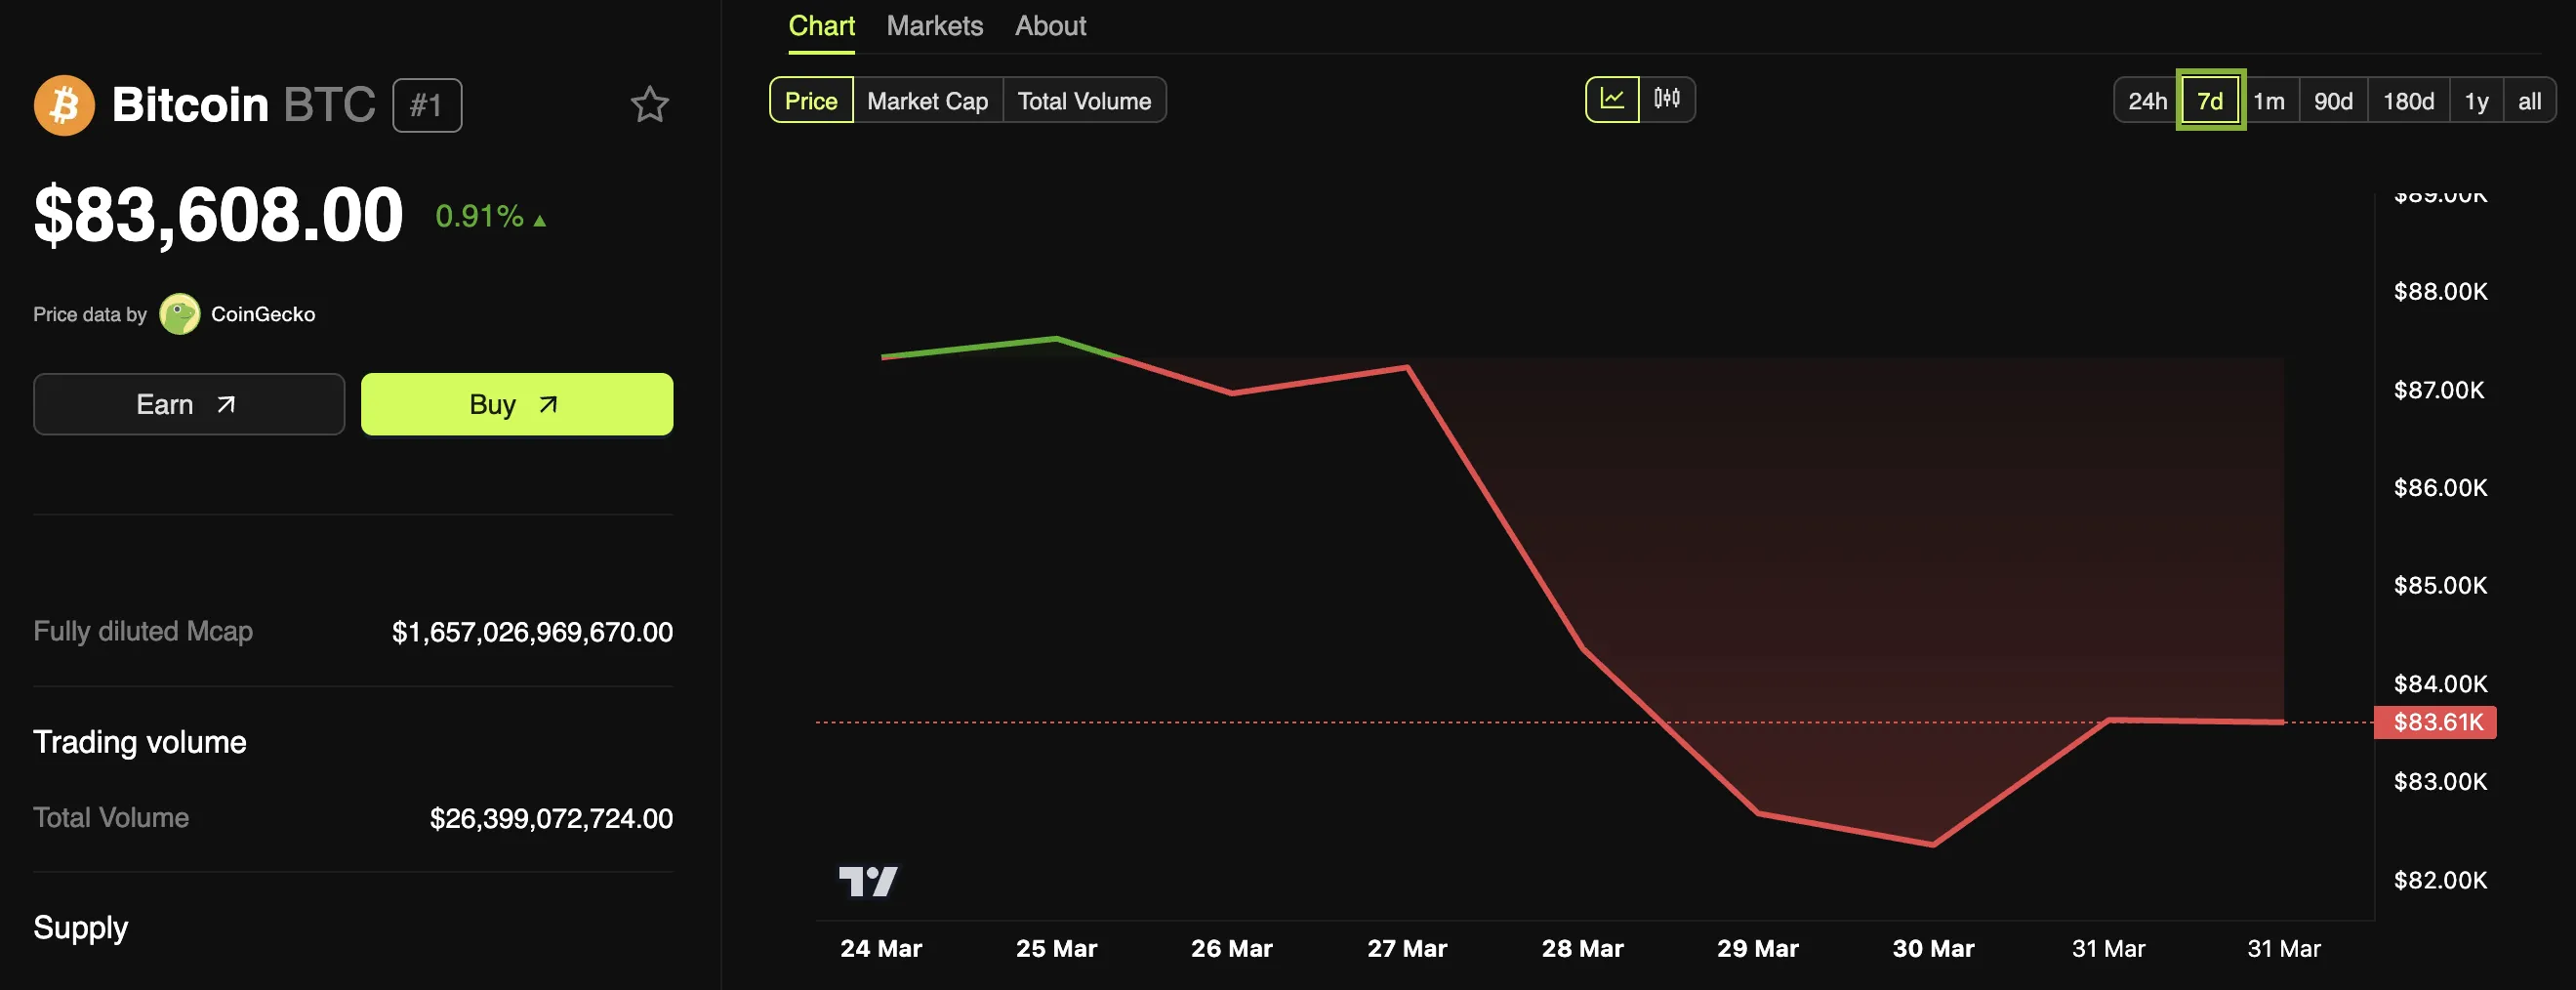
As of this writing, the price of Bitcoin stands around $59,467, reflecting a 2.7% increase in the last 24 hours. According to CoinGecko data, the flagship cryptocurrency is up by 2% in the past week.
The price of BTC on the daily timeframe | Source: BTCUSDT chart on TradingView
Featured image from Pexels, chart from TradingView


Michael Saylor announced that Strategy purchased nearly $2 billion worth of Bitcoin. This is a massive leap over last week’s purchase, which was already quite substantial.
Nonetheless, the firm was only able to make this acquisition thanks to major stock offerings. Bitcoin’s price has been sinking over the last few weeks, and this could mature into a potential liquidation crisis.
Strategy Maintains Bitcoin Purchases
Since Strategy (formerly MicroStrategy) began acquiring Bitcoin, it’s become one of the world’s largest BTC holders. This plan has totally reoriented the company around its massive acquisitions, inspiring other firms to take up the same plan.
Today, the firm’s Chair, Michael Saylor, announced another purchase, much larger than the last few.
“Strategy has acquired 22,048 BTC for ~$1.92 billion at ~$86,969 per bitcoin and has achieved BTC Yield of 11.0% YTD 2025. As of 3/30/2025, Strategy holds 528,185 BTC acquired for ~$35.63 billion at ~$67,458 per bitcoin,” Saylor claimed via social media.
Strategy’s latest Bitcoin acquisition, worth just shy of $2 billion, is a major commitment. In February, the firm made a similar $2 billion purchase, and it was followed by a tiny $10 million buy and a $500 million one. The $500 million purchase, which took place on March 24, only happened thanks to a huge new stock offering. This move further cements Strategy’s faith in BTC.
By making these billion-dollar buys, Strategy is able to buttress the entire market’s confidence in Bitcoin. However, investors should be aware of a few potential cracks.
First of all, Bitcoin’s performance is a little subpar at the moment. Despite hitting an all-time high recently, Bitcoin is having its worst quarter since 2019, and there is not much forward momentum.
This could cause a unique problem for the company. Since Strategy is a cornerstone of market confidence, it is unable to offload its assets without jeopardizing Bitcoin’s price.
The firm’s debts are growing at a fast rate, and this could have dangerous implications if Bitcoin keeps falling. Strategy could be forced to liquidate, even if that seems unlikely now.
Still, it’s important to remember that these are only possible scenarios. Strategy has maintained its consistent Bitcoin investments for nearly five years, and it’s paid off tremendously well. However, if it keeps taking on billions in fresh debt obligations, this faith will turn into a gamble with very high stakes.
Disclaimer
In adherence to the Trust Project guidelines, BeInCrypto is committed to unbiased, transparent reporting. This news article aims to provide accurate, timely information. However, readers are advised to verify facts independently and consult with a professional before making any decisions based on this content. Please note that our Terms and Conditions, Privacy Policy, and Disclaimers have been updated.

Bitcoin (BTC) is on track to end Q1 with its worst performance since 2019. Without an unexpected recovery, BTC could close the quarter with a 25% decline from its all-time high (ATH).
Some analysts have noted that experienced Bitcoin holders are shifting into an accumulation phase, signaling potential price growth in the medium term.
Signs That Veteran Investors Are Accumulating Again
According to AxelAdlerJr, March 2025 marks a transition period where veteran investors move from selling to holding and accumulating. This shift is reflected in the Value Days Destroyed (VDD) metric, which remains low.
VDD is an on-chain indicator that tracks investor behavior by measuring the number of days Bitcoin remains unmoved before being transacted.
A high VDD suggests that older Bitcoin is being moved, which may indicate selling pressure from whales or long-term holders. A low VDD suggests that most transactions involve short-term holders, who have a smaller impact on the market.
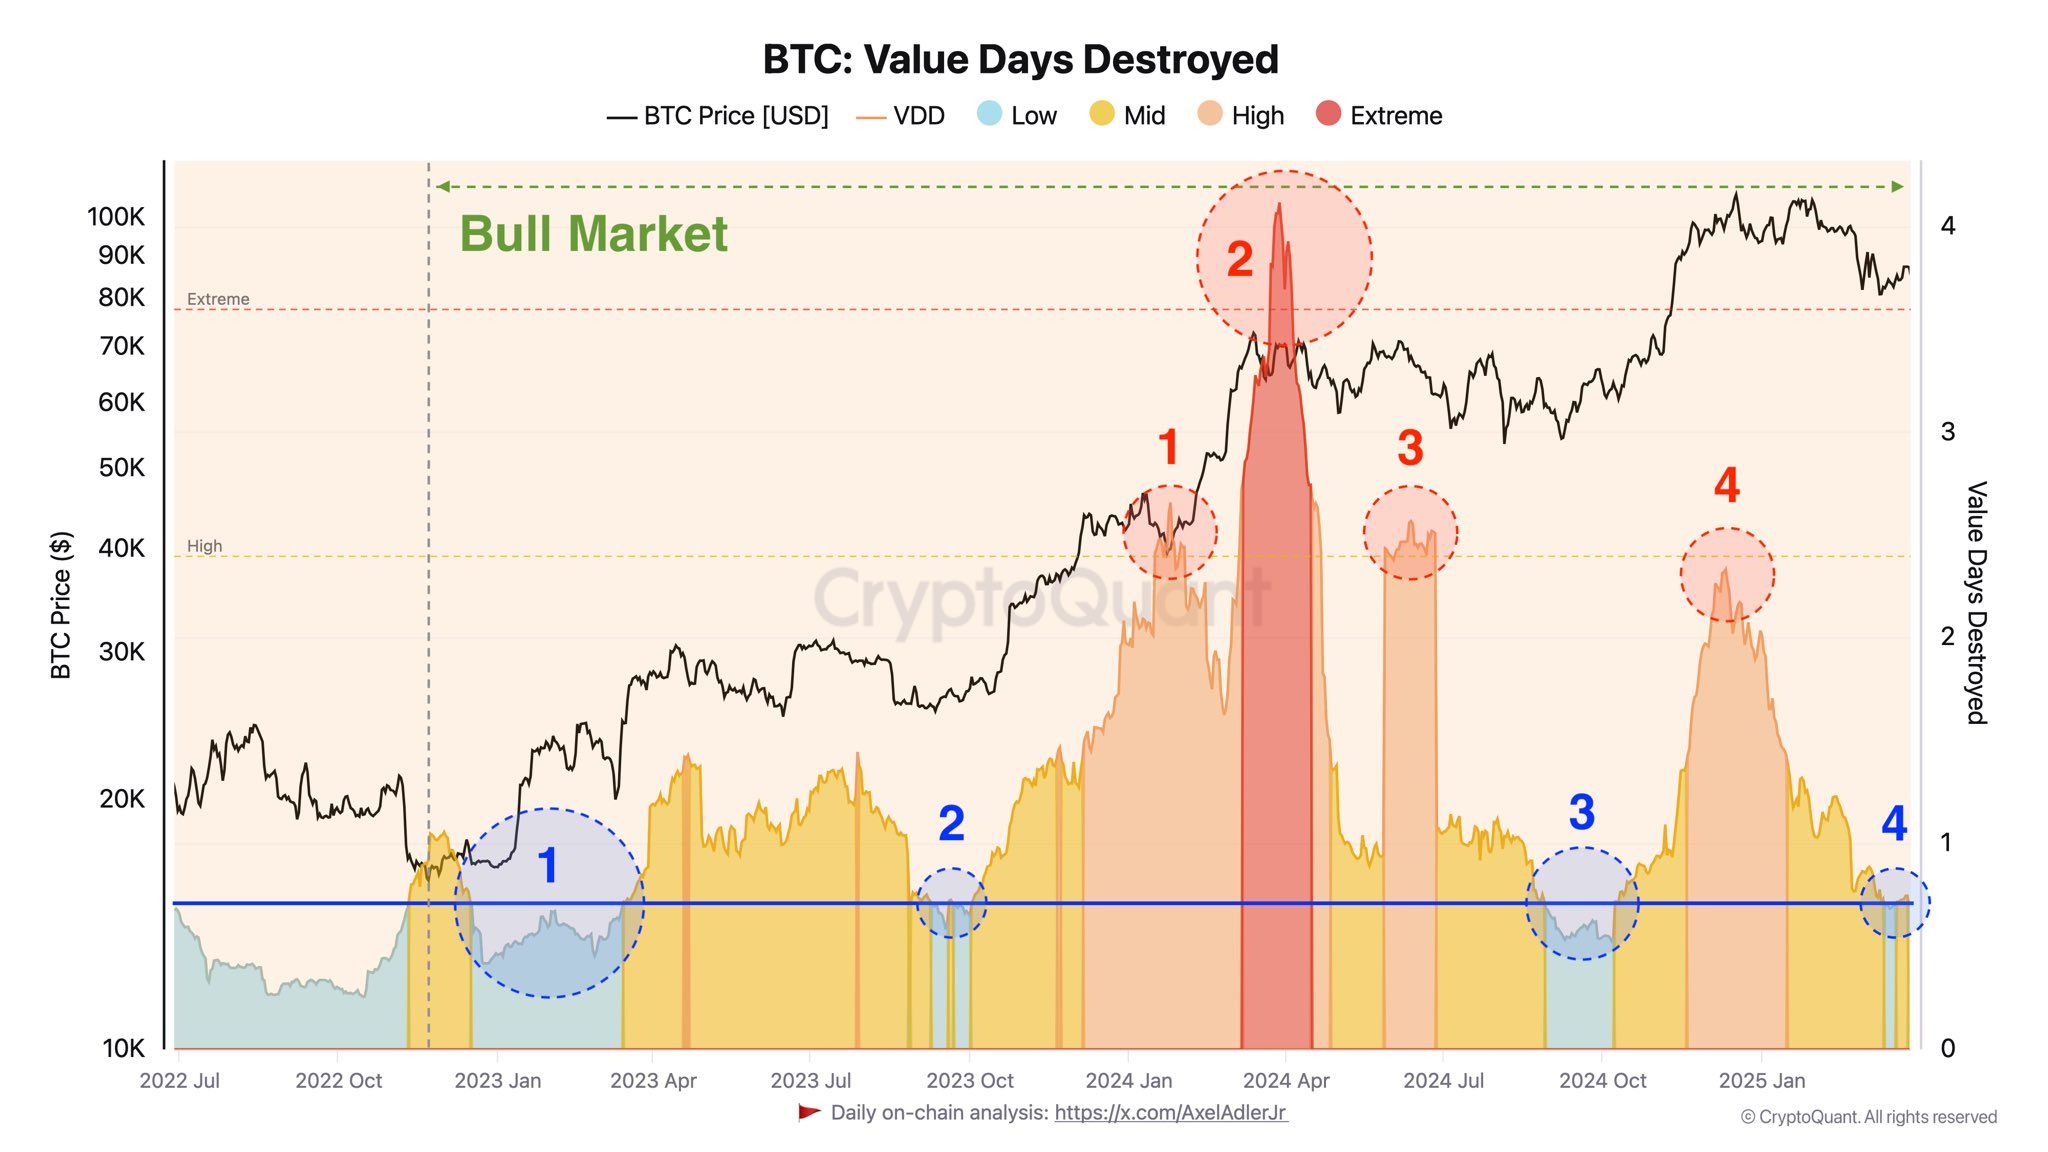
Historically, low VDD periods often precede strong price rallies. These phases suggest that investors are accumulating Bitcoin with expectations of future price increases. AxelAdlerJr concludes that this shift signals Bitcoin’s potential for medium-term growth.
“The transition of experienced players into a holding (accumulation) phase signals the potential for further BTC growth in the medium term,” AxelAdlerJr predicted.
Bitcoin’s Sell-Side Risk Ratio Hits Low
At the same time, analyst Ali highlighted another bullish indicator: Bitcoin’s sell-side risk ratio had dropped to 0.086%.
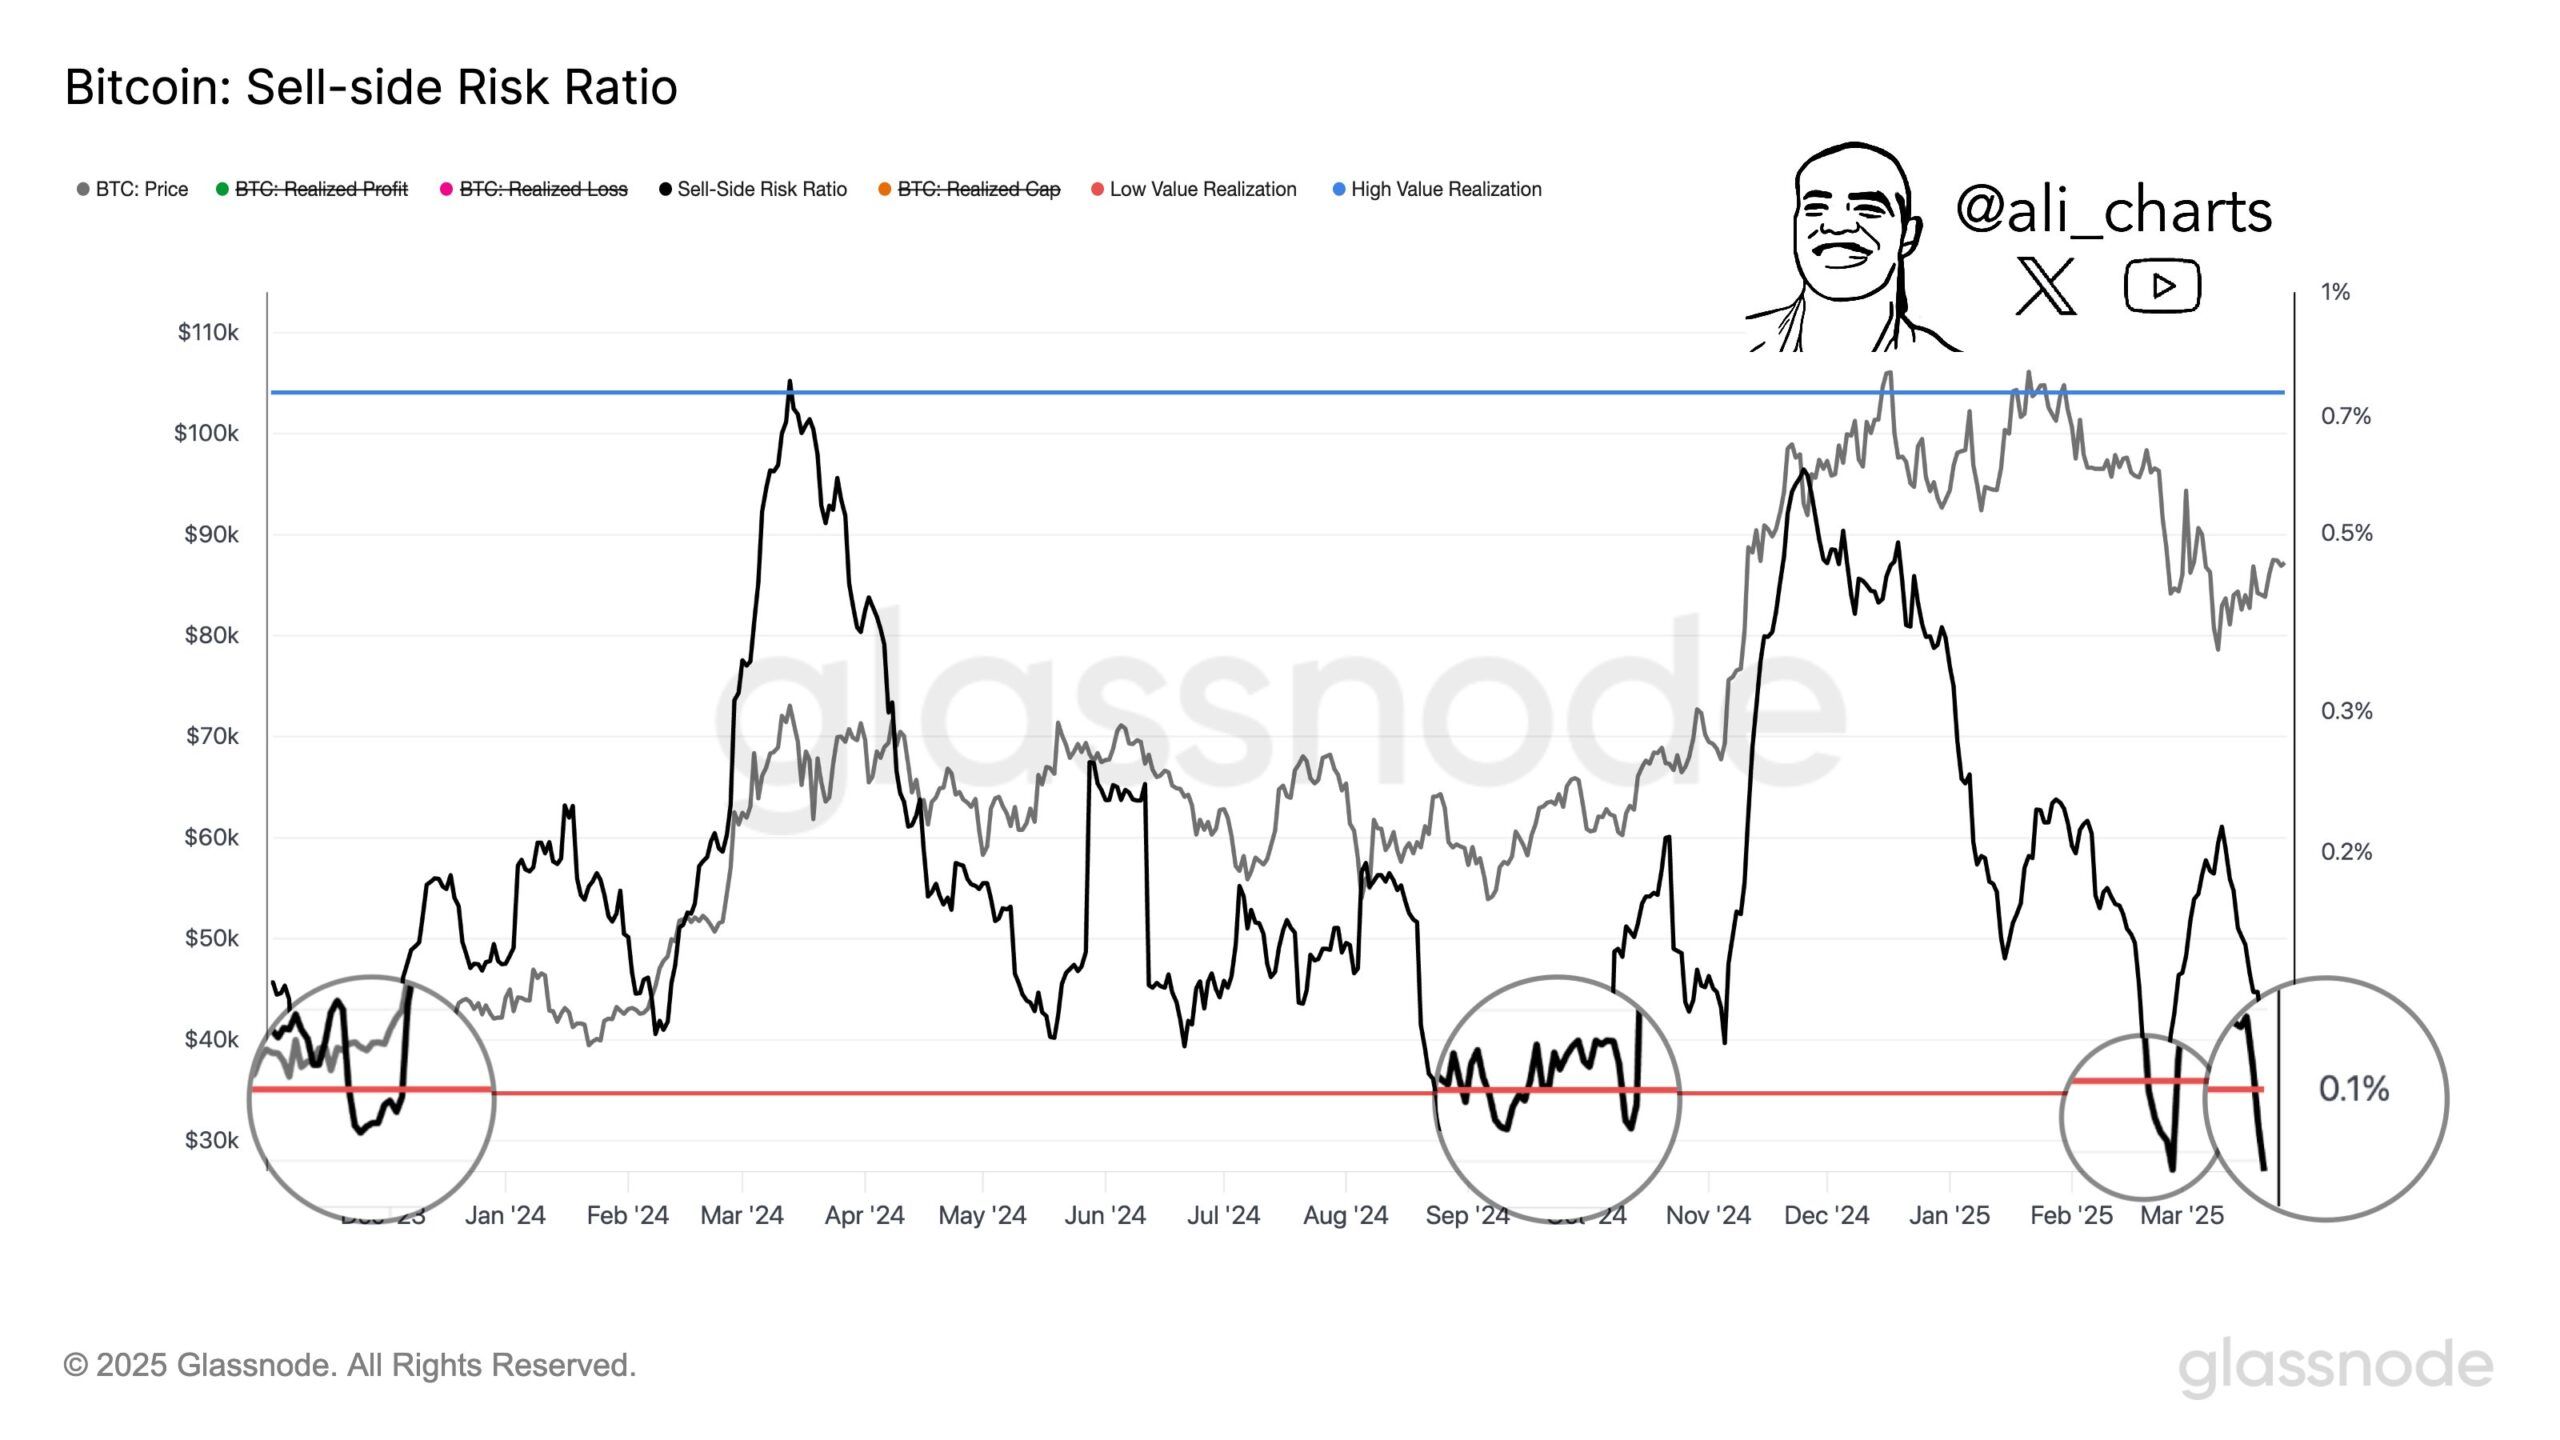
According to Ali, over the past two years, every time this ratio fell below 0.1%, Bitcoin experienced a strong price rebound. For example, in January 2024, Bitcoin surged to a then-all-time high of $73,800 after the sell-side risk ratio dipped below 0.1%.
Similarly, in September 2024, Bitcoin hit a new peak after this metric reached a low level.
The combination of veteran investors accumulating Bitcoin and a sharp decline in the sell-side risk ratio are positive signals for the market. However, a recent analysis from BeInCrypto warns of concerning technical patterns, with a death cross beginning to form.
Additionally, investors remain cautious about potential market volatility in early April. The uncertainty stems from President Trump’s upcoming announcement regarding a major retaliatory tariff.
Disclaimer
In adherence to the Trust Project guidelines, BeInCrypto is committed to unbiased, transparent reporting. This news article aims to provide accurate, timely information. However, readers are advised to verify facts independently and consult with a professional before making any decisions based on this content. Please note that our Terms and Conditions, Privacy Policy, and Disclaimers have been updated.


Marathon Digital Holdings, one of the largest Bitcoin mining companies in the US, made headlines with its announcement of a $2 billion stock offering to increase its Bitcoin holdings.
This strategic move, detailed in recent SEC filings, shows Marathon’s aggressive approach to capitalize on the growing crypto market.
Marathon’s $2 Billion Stock Offering: Key Details
On March 30, 2025, Marathon Digital Holdings announced a $2 billion at-the-market (ATM) stock offering to fund its strategy of acquiring more Bitcoin. The company filed a Form 8-K with the SEC, outlining its plan to raise capital through the sale of shares, with the proceeds primarily aimed at increasing its Bitcoin holdings.
According to the SEC filing (Form 424B5), Marathon intends to use the funds for “general corporate purposes,” which include purchasing additional Bitcoin and supporting operational needs.
Marathon holds 46,376 BTC, making it the second-largest publicly traded company in Bitcoin ownership, behind MicroStrategy. The company’s Bitcoin holdings have grown significantly in recent years, from 13,726 BTC in early 2024 to the current figure.
“We believe we are the second largest holder of bitcoin among publicly traded companies. From time to time, we enter into forward or option contracts and/or lend bitcoin to increase yield on our Bitcoin holdings.” Marathon confirmed
This $2 billion stock offering continues Marathon’s strategy to bolster its balance sheet with Bitcoin, a move that aligns with its long-term vision of leveraging cryptocurrency as a store of value.
Marathon’s strategy mirrors that of MicroStrategy. MicroStrategy’s stock price has soared with Bitcoin’s value, providing a blueprint for companies like Marathon to follow. By increasing its Bitcoin holdings, Marathon aims to position itself as a leader in the crypto mining sector while diversifying its revenue streams beyond traditional mining operations.
Marathon Digital CEO Fred Thiel advises investing small amounts in Bitcoin monthly, citing its consistent long-term growth potential.
The issuance of new shares to raise $2 billion could dilute the ownership of existing shareholders, potentially impacting the company’s stock price (MARA). As of March 31, 2025, MARA stock has experienced volatility, trading at around $12.47 per share, down from a 52-week high of $24, according to data from Yahoo Finance.
Moreover, Marathon’s heavy reliance on Bitcoin exposes it to the cryptocurrency’s price fluctuations. If Bitcoin’s price were to decline significantly, the value of Marathon’s holdings would decrease, potentially straining its financial position.
Disclaimer
In adherence to the Trust Project guidelines, BeInCrypto is committed to unbiased, transparent reporting. This news article aims to provide accurate, timely information. However, readers are advised to verify facts independently and consult with a professional before making any decisions based on this content. Please note that our Terms and Conditions, Privacy Policy, and Disclaimers have been updated.

Hedera (HBAR) Bears Dominate, HBAR Eyes Key $0.15 Level

Charles Hoskinson Reveals How Cardano Will Boost Bitcoin’s Adoption

Coinbase Tries to Resume Lawsuit Against the FDIC

Ethereum Bitcoin Ratio Drops to Record Low, What Next for ETH?

BlackRock’s Larry Fink Thinks Crypto Could Harm The Dollar

Ethereum May Have To Undo This Death Cross For Bull’s Return

2.52 Million Altcoins Are Ruining Crypto’s Future

Animoca Brands Valuation Tanks 75% In Two Years, Here’s Why

Crypto exchange BingX hacked for $43 million

Are The Big Players Losing Interest?

Hong Kong’s Securities Association Tips Authorities On Crypto Self-Regulation

Coinbase cbBTC Set to go Live on Solana
2.52 Million Altcoins Are Ruining Crypto’s Future
Animoca Brands Valuation Tanks 75% In Two Years, Here’s Why
Crypto exchange BingX hacked for $43 million
Are The Big Players Losing Interest?
Hong Kong’s Securities Association Tips Authorities On Crypto Self-Regulation
Coinbase cbBTC Set to go Live on Solana
-
 Altcoin24 hours ago
Cardano Price Eyes Massive Pump In May Following Cyclical Patern From 2024
-

 Market20 hours ago
Bitcoin Bears Tighten Grip—Where’s the Next Support?
-

 Market19 hours ago
Ethereum Price Weakens—Can Bulls Prevent a Major Breakdown?
-

 Market17 hours ago
Dogecoin (DOGE) Bulls In Trouble—Can They Prevent a Drop Below $0.15?
-

 Bitcoin10 hours ago
BTC Price Rebound Likely as Long-Term Holders Reenter Market
-
 Market16 hours ago
Bitcoin Price Nears $80,000; Fuels Death Cross Potential
-

 Market10 hours ago
3 Altcoins to Watch in the First Week of April 2025
-

 Ethereum15 hours ago
Ethereum Is ‘Completely Dead’ As An Investment: Hedge Fund