
Market
3 Altcoin Biggest Gainers in July 2024 Second Week

Contrary to last week’s performance, altcoins have registered notable upswings in the second week of July. While there are some astonishing entries, some stayed true to the wider expectations.
From BeInCrypto’s observations, Notcoin (NOT), Celestia (TIA), and MANTRA (OM) are the top three biggest gainers. This analysis explains how it happened and points out a few others who are in the class.
Notcoin (NOT) Breaks Out of the Descending Triangle
With a 42.25% increase in the last seven days, Telegram-based project Notcoin (NOT) is this week’s top gainer.
Currently, NOT trades at $0.014. Between June 4 and July 5, Notcoin’s price fell from $0.027 to $0.0094. Amid the 65.78% decrease, a descending triangle formed. Considered a bearish pattern, a descending triangle appears when a cryptocurrency hits a series of lower highs and lower lows.
This pattern exhibits weakness and indicates that bulls are no longer in control. However, the triangle can sometimes precede a breakout, as with Notcoin.
According to the 4-hour chart, bulls observed that selling pressure became weak when the price reached $0.0094. In turn, they took advantage of the fatigue. Driven by higher demand, Notcoin reached $0.017 on July 8.
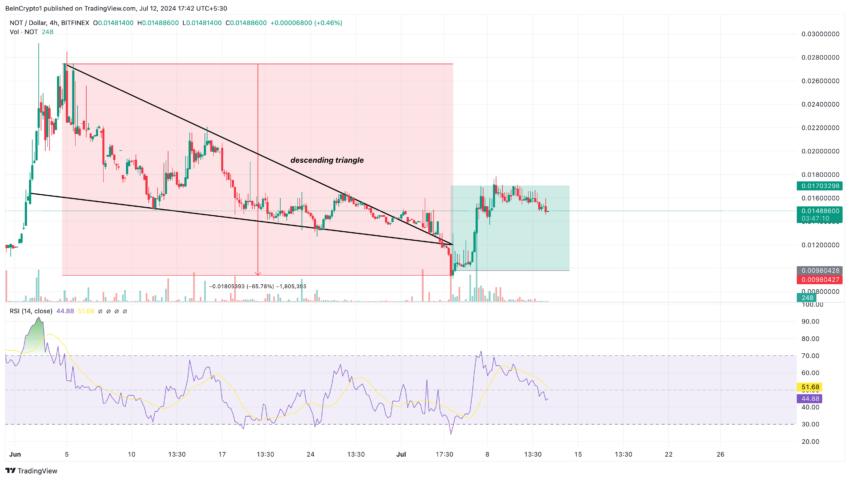
However, the Relative Strength Index (RSI), which measures momentum, shows that the altcoin became overbought as the reading crossed 70.00. At press time, the RSI reading has decreased, and it is the same with Notcoin’s price
If the momentum continues to fall, NOT will likely follow in a similar direction. If this is the case, the price may drop to $0.012. However, if buying pressure increases, the value of the biggest altcoin gainer may reverse toward $0.016.
Read More: Notcoin (NOT) Price Prediction 2024/2025/2030
Celestia (TIA) Gains 35% For the First Time In Months
Earlier in the week, we reported how Celestia (TIA) broke out of a five-month downtrend after reaching its lowest point since November.
The breakout resulted in TIA being the second biggest altcoin gainer of July’s second week. Within the last seven days, TIA’s price increased by 35.04%.
According to the daily chart, the token was oversold around the last week of June. This was shown by the Money Flow Index (MFI). Usually, when the MFI is over 80.00, the crypto involved is overbought.
On the other hand, readings at 20.00 or below mean it is oversold. During the week, the MFI climbed, indicating that TIA experienced increased capital deployed. This buying pressure was one of the rationales for the price hike.
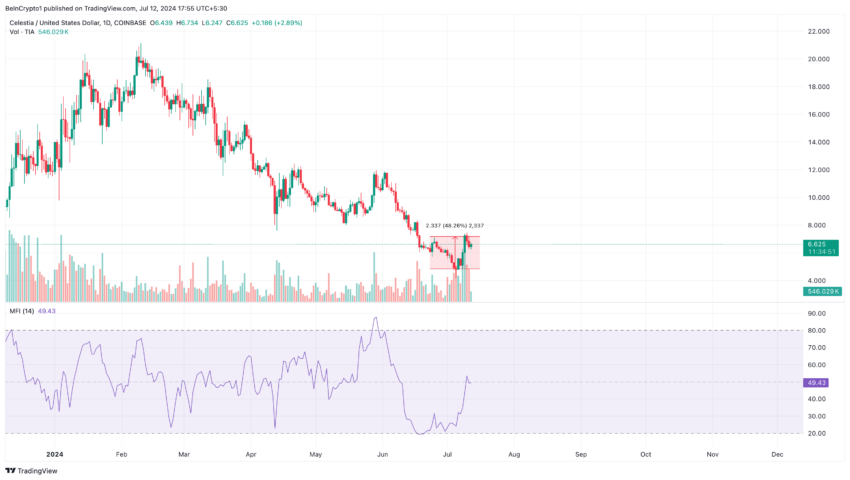
While the price decreased to $6.62, the MFI is on the brink of jumping past the neutral line. If successful, TIA will revisit $7 within a short period. If not, the token will approach $6.06.
MANTRA (OM) Is Again Part of the Heavyweights
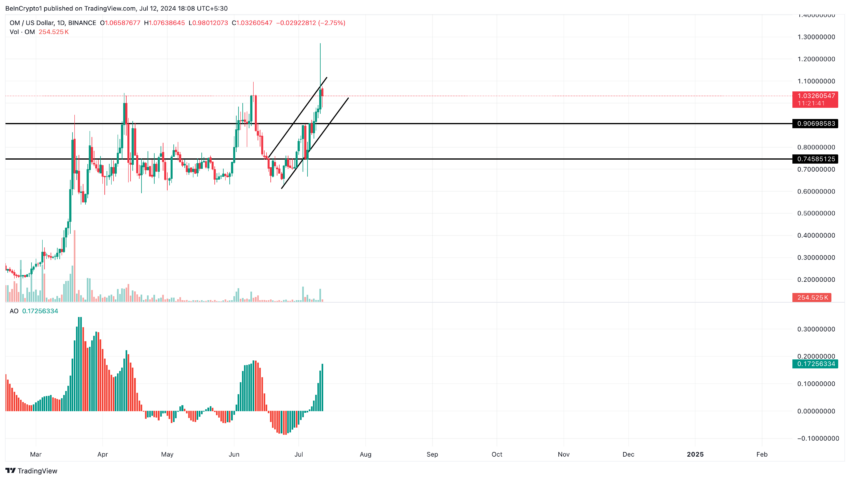
MANTRA (OM) was one of the biggest altcoin gainers in the first week of July 2024. Thanks to its 32.05% seven-day increase, it makes a second consecutive appearance.
At press time, OM trades at $1.03. Unlike the other two altcoins mentioned above, MANTRA is maintaining the uptrend.
Analysis shows that strong support at $0.74 was instrumental to the token’s break of the $0.90 resistance. By forming an ascending channel may be on the verge of reaching $1.10. This is also backed by the Awesome Oscillator (AO).
The AO measures momentum using the difference between the 34-period Simple Moving Average (SMA) and the 5-period.
Read More: 11 Cryptos To Add To Your Portfolio Before Altcoin Season
Positive values indicate increasing upward momentum, while negative ones suggest otherwise. As of this writing, the rating remains positive, hinting at a further uptrend.
If this trend continues, OM’s price will reach close to $1.10. If not, the altcoin may drop back to $0.90.
In addition, other gainers of the week include Optimism (OP) — the token of the Ethereum layer-2, Conflux (CFX), and Ronin (RON).
Disclaimer
In line with the Trust Project guidelines, this price analysis article is for informational purposes only and should not be considered financial or investment advice. BeInCrypto is committed to accurate, unbiased reporting, but market conditions are subject to change without notice. Always conduct your own research and consult with a professional before making any financial decisions. Please note that our Terms and Conditions, Privacy Policy, and Disclaimers have been updated.


Controversies surrounding token listings, the depegging of the FDUSD stablecoin, and allegations of unethical behavior have raised a crucial question: Is Binance losing its credibility?
These issues threaten to erode trust and challenge Binance’s standing in the crypto industry.
Binance Struggles to Meet the Standard
One of Binance‘s most pressing issues is the poor performance of the tokens listed on the exchange. As BeInCrypto reported earlier, 89% of the tokens listed on the platform in 2025 recorded negative returns.
Even more concerning, another report reveals that most of the tokens listed in 2024 also experienced negative performance.
Listing on Binance was once considered a “launchpad” for new projects. However, it no longer guarantees success.
A prime example is the ACT token, a meme coin listed on the exchange that quickly plummeted. Earlier this week, Wintermute—a major market maker—dumped a large amount of ACT, exerting strong downward pressure on its price and raising concerns about the transparency of Binance’s listing process.
Such criticism has led the community to believe Binance prioritizes listing fees over users’ interests.
Connection to FDUSD
The FDUSD stablecoin has also become a focal point of controversy, with Binance at its center. FDUSD lost its peg, dropping to $0.89 after reports surfaced that its issuing company had gone bankrupt.
Wintermute, one of the largest FDUSD holders outside of Binance, withdrew 31.36 million FDUSD from the exchange at 11:15 AM UTC. This move is believed to have exacerbated the depegging situation, sparking panic in the market.
More concerning, a community member claimed that some Binance employees leaked internal information about the FDUSD incident so they could select whale chat groups.
If true, this would severely damage Binance’s reputation and raise major questions about the platform’s transparency and ethics.
Overall, the community’s dissatisfaction is growing, with many users calling for a boycott of the exchange. Such negative reactions are shaking user confidence in the platform, which was once considered a symbol of credibility in the crypto space.
“Binance today caused massive liquidations on alts listed on their exchange. I warned you all yesterday about their very dirty tactics, specifically GUN. I refuse to use Binance #BoycottBinance,” wrote popular crypto YouTuber Jesus Martinez.
These accusations stem from a central issue that Binance prioritizes profits over user interests. Over the past few months, the community has constantly criticized its listing strategy, arguing that the exchange focuses on “shitcoins” to collect high listing fees without considering project quality.
Although the exchange recently introduced a community voting mechanism to decide on listings, this might not be enough to silence the criticism.
As a Tier-1 exchange, the company is evaluated based on trading volume, security, regulatory compliance, and community trust. However, recent events suggest that the exchange is struggling to maintain these standards.
Disclaimer
In adherence to the Trust Project guidelines, BeInCrypto is committed to unbiased, transparent reporting. This news article aims to provide accurate, timely information. However, readers are advised to verify facts independently and consult with a professional before making any decisions based on this content. Please note that our Terms and Conditions, Privacy Policy, and Disclaimers have been updated.

Stellar (XLM) is down more than 5% on Thursday, with its market capitalization dropping to $8 billion. XLM technical indicators are flashing strong bearish signals, suggesting continued downward momentum that could test critical support levels around $0.22.
While a reversal scenario remains possible with resistance targets at $0.27, $0.29, and $0.30, such an upside move would require a substantial shift in market sentiment.
XLM RSI Shows Sellers Are In Control
Stellar’s Relative Strength Index (RSI) has dropped sharply to 38.99, down from 59.54 just two days ago—signaling a notable shift in momentum.
The RSI is a widely used momentum oscillator that measures the speed and magnitude of recent price changes, typically ranging between 0 and 100.
Readings above 70 suggest overbought conditions, while levels below 30 indicate oversold territory. A reading between 30 and 50 often reflects bearish momentum but is not yet extreme enough to trigger an immediate reversal.
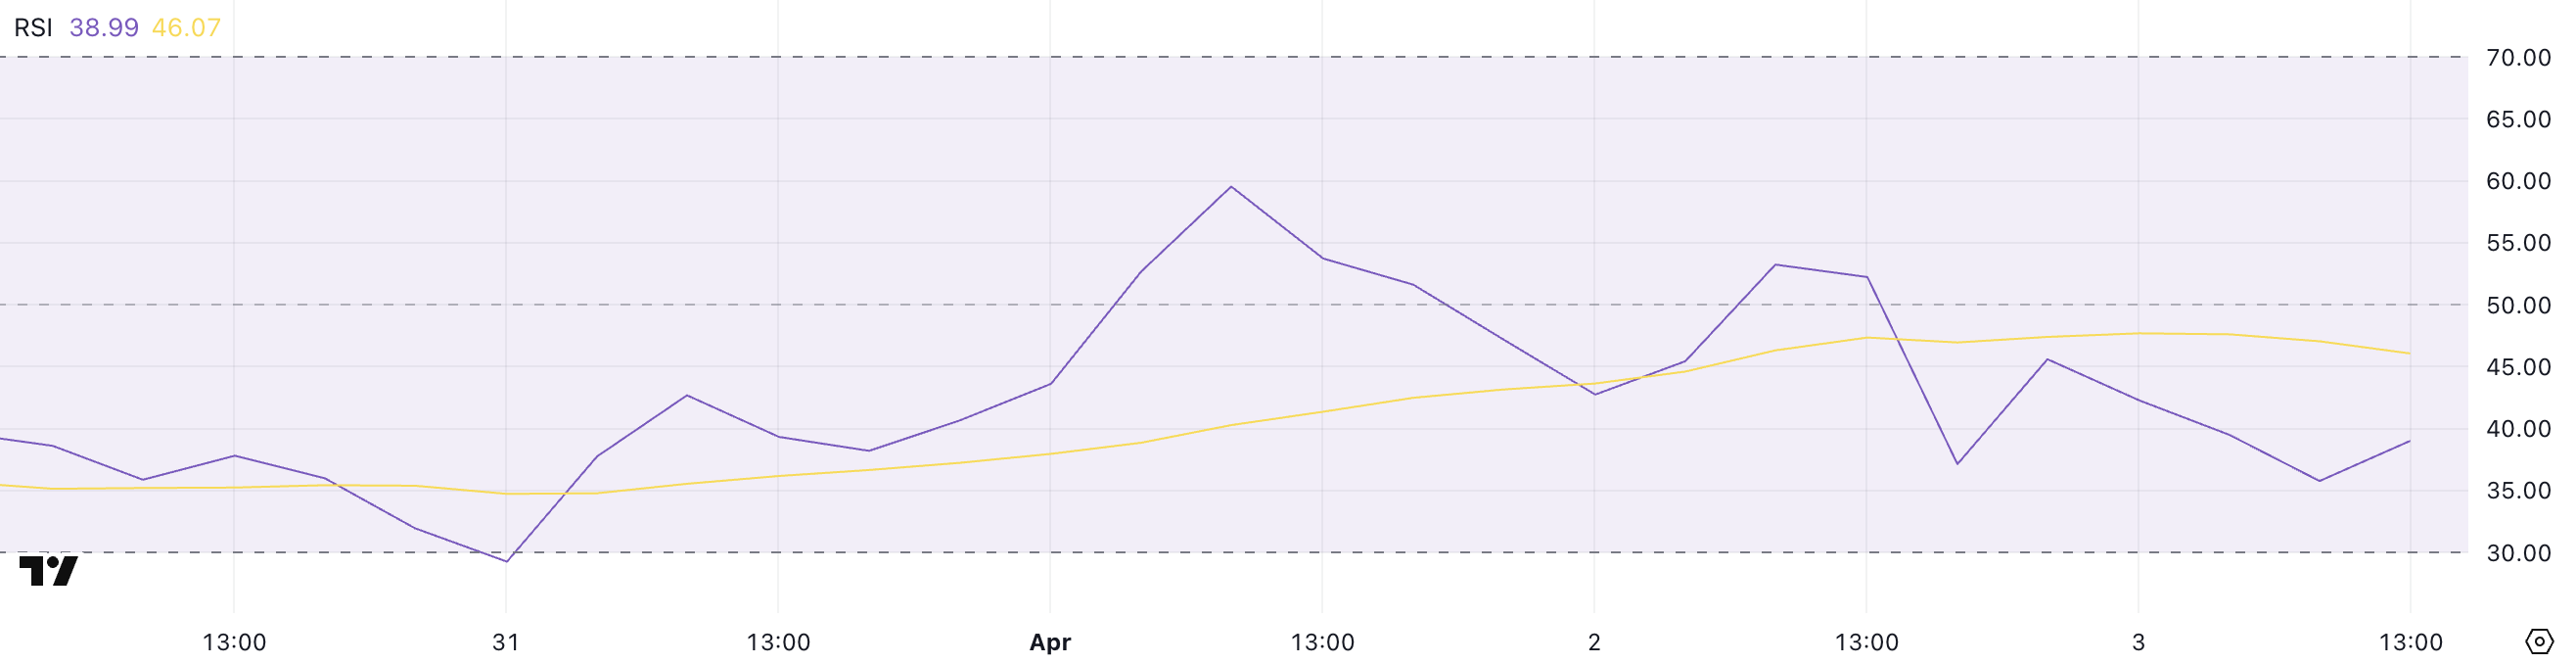
With Stellar’s RSI now below the key midpoint of 50 and approaching the oversold threshold, the current reading of 38.99 suggests that sellers are gaining control.
While it’s not yet in oversold territory, it does signal weakening buying pressure and increasing downside risk.
If the RSI continues to fall, XLM could face further price declines unless buyers step in soon to stabilize the trend and prevent a slide into more deeply oversold levels.
Stellar CMF Heavily Dropped Since April 1
Stellar’s Chaikin Money Flow (CMF) has plunged to -10, a sharp decline from 0.19 just two days ago, signaling a significant shift in capital flow dynamics.
The CMF is an indicator that measures the volume-weighted average of accumulation and distribution over a set period—essentially tracking whether money is flowing into or out of an asset.
Positive values suggest buying pressure and accumulation, while negative values point to selling pressure and capital outflow.
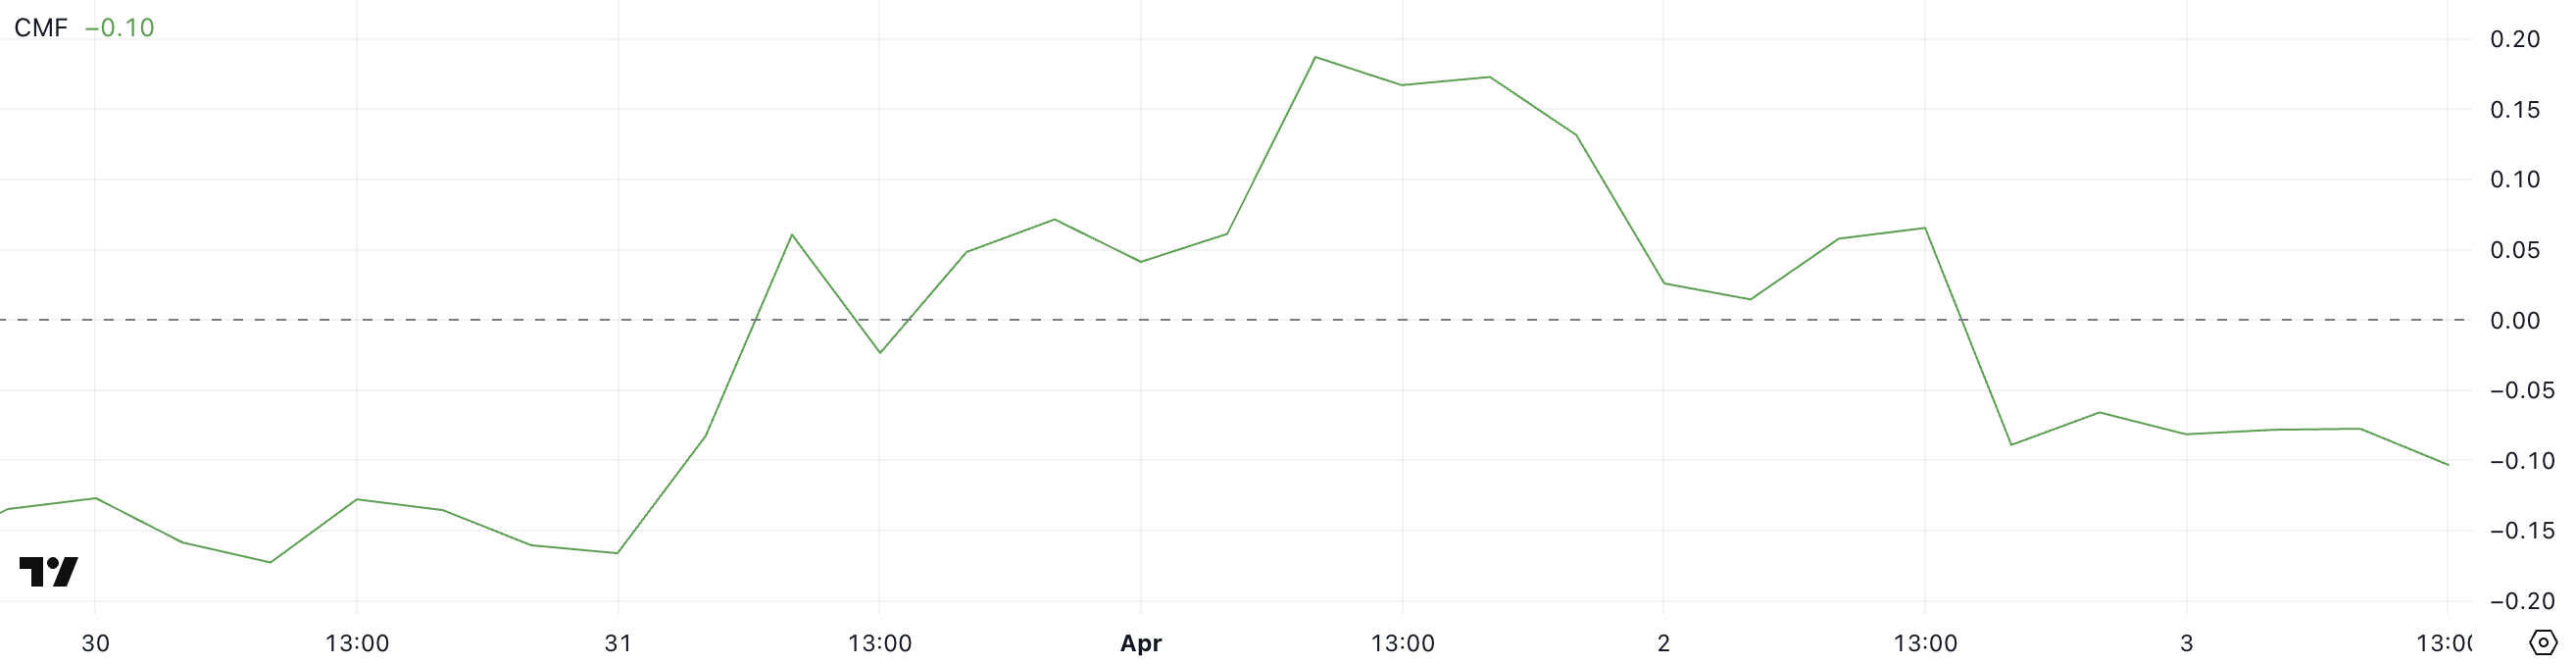
With XLM’s CMF now deep in negative territory at -10, it indicates that sellers are firmly in control and substantial capital is leaving the asset.
This level of negative flow can put downward pressure on price, especially if it aligns with other bearish technical signals. Unless buying volume returns to offset this outflow, XLM could continue to weaken in the near term.
Will Stellar Fall To Five-Month Lows?
Stellar price action presents concerning signals as EMA indicators point to a strong bearish trend with significant downside potential.
Technical analysis suggests this downward momentum could push XLM to test critical support around $0.22. It could breach this level and fall below the psychologically important $0.20 threshold—a price not seen since November 2024.
This technical deterioration warrants caution from traders and investors as selling pressure appears to be intensifying.
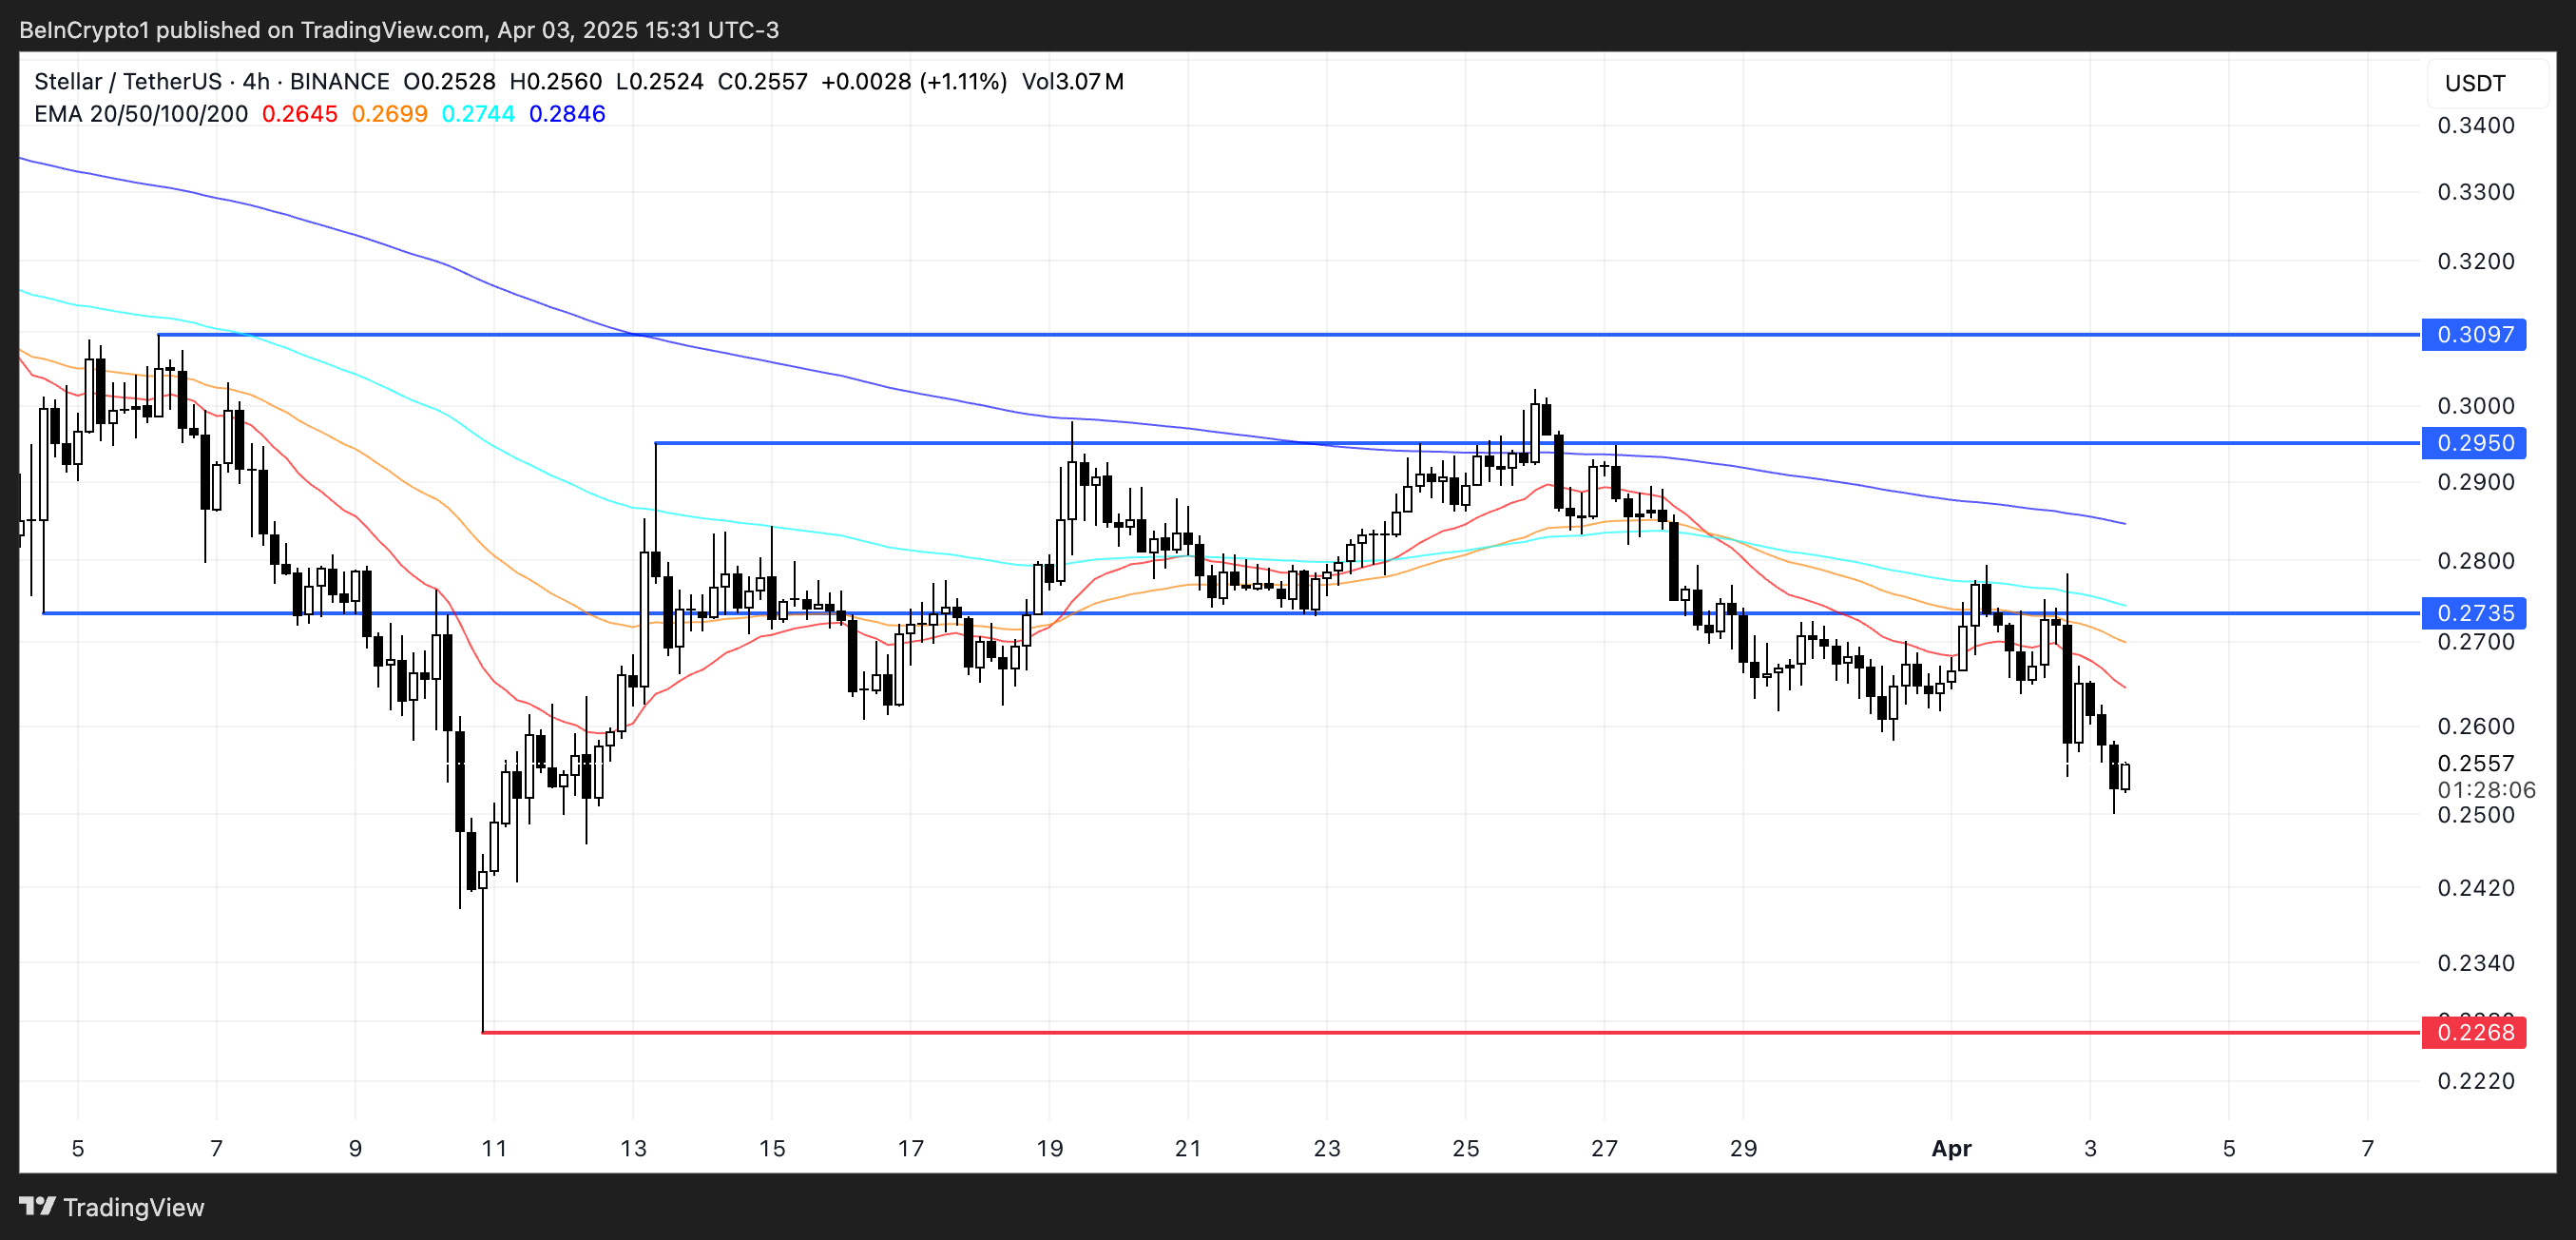
Conversely, a trend reversal scenario would require a substantial shift in market sentiment. Should bulls regain control, XLM could challenge the immediate resistance at $0.27, with further upside targets at $0.29 and the key $0.30 level.
However, this optimistic outlook faces considerable obstacles, as only a dramatic sentiment shift coupled with the emergence of a powerful uptrend would enable such a recovery.
Until clearer bullish signals manifest, the prevailing technical structure continues to favor the bearish case.
Disclaimer
In line with the Trust Project guidelines, this price analysis article is for informational purposes only and should not be considered financial or investment advice. BeInCrypto is committed to accurate, unbiased reporting, but market conditions are subject to change without notice. Always conduct your own research and consult with a professional before making any financial decisions. Please note that our Terms and Conditions, Privacy Policy, and Disclaimers have been updated.

Solana (SOL) is under heavy pressure, with its price down more than 10% in the last 24 hours as bearish momentum intensifies across key indicators. The Ichimoku Cloud, BBTrend, and price structure all point to continued downside risk, with SOL now hovering dangerously close to critical support levels.
Technical signals show sellers firmly in control, while the widening gap from resistance zones makes a near-term recovery increasingly difficult.
Solana’s Ichimoku Cloud chart is currently flashing strong bearish signals. The price has sharply broken below both the Tenkan-sen (blue line) and Kijun-sen (red line), confirming a clear rejection of short-term support levels.
Both of these lines are now angled downward, reinforcing the view that bearish momentum is gaining strength.
The sharp distance between the latest candles and the cloud further suggests that any recovery would face significant resistance ahead.
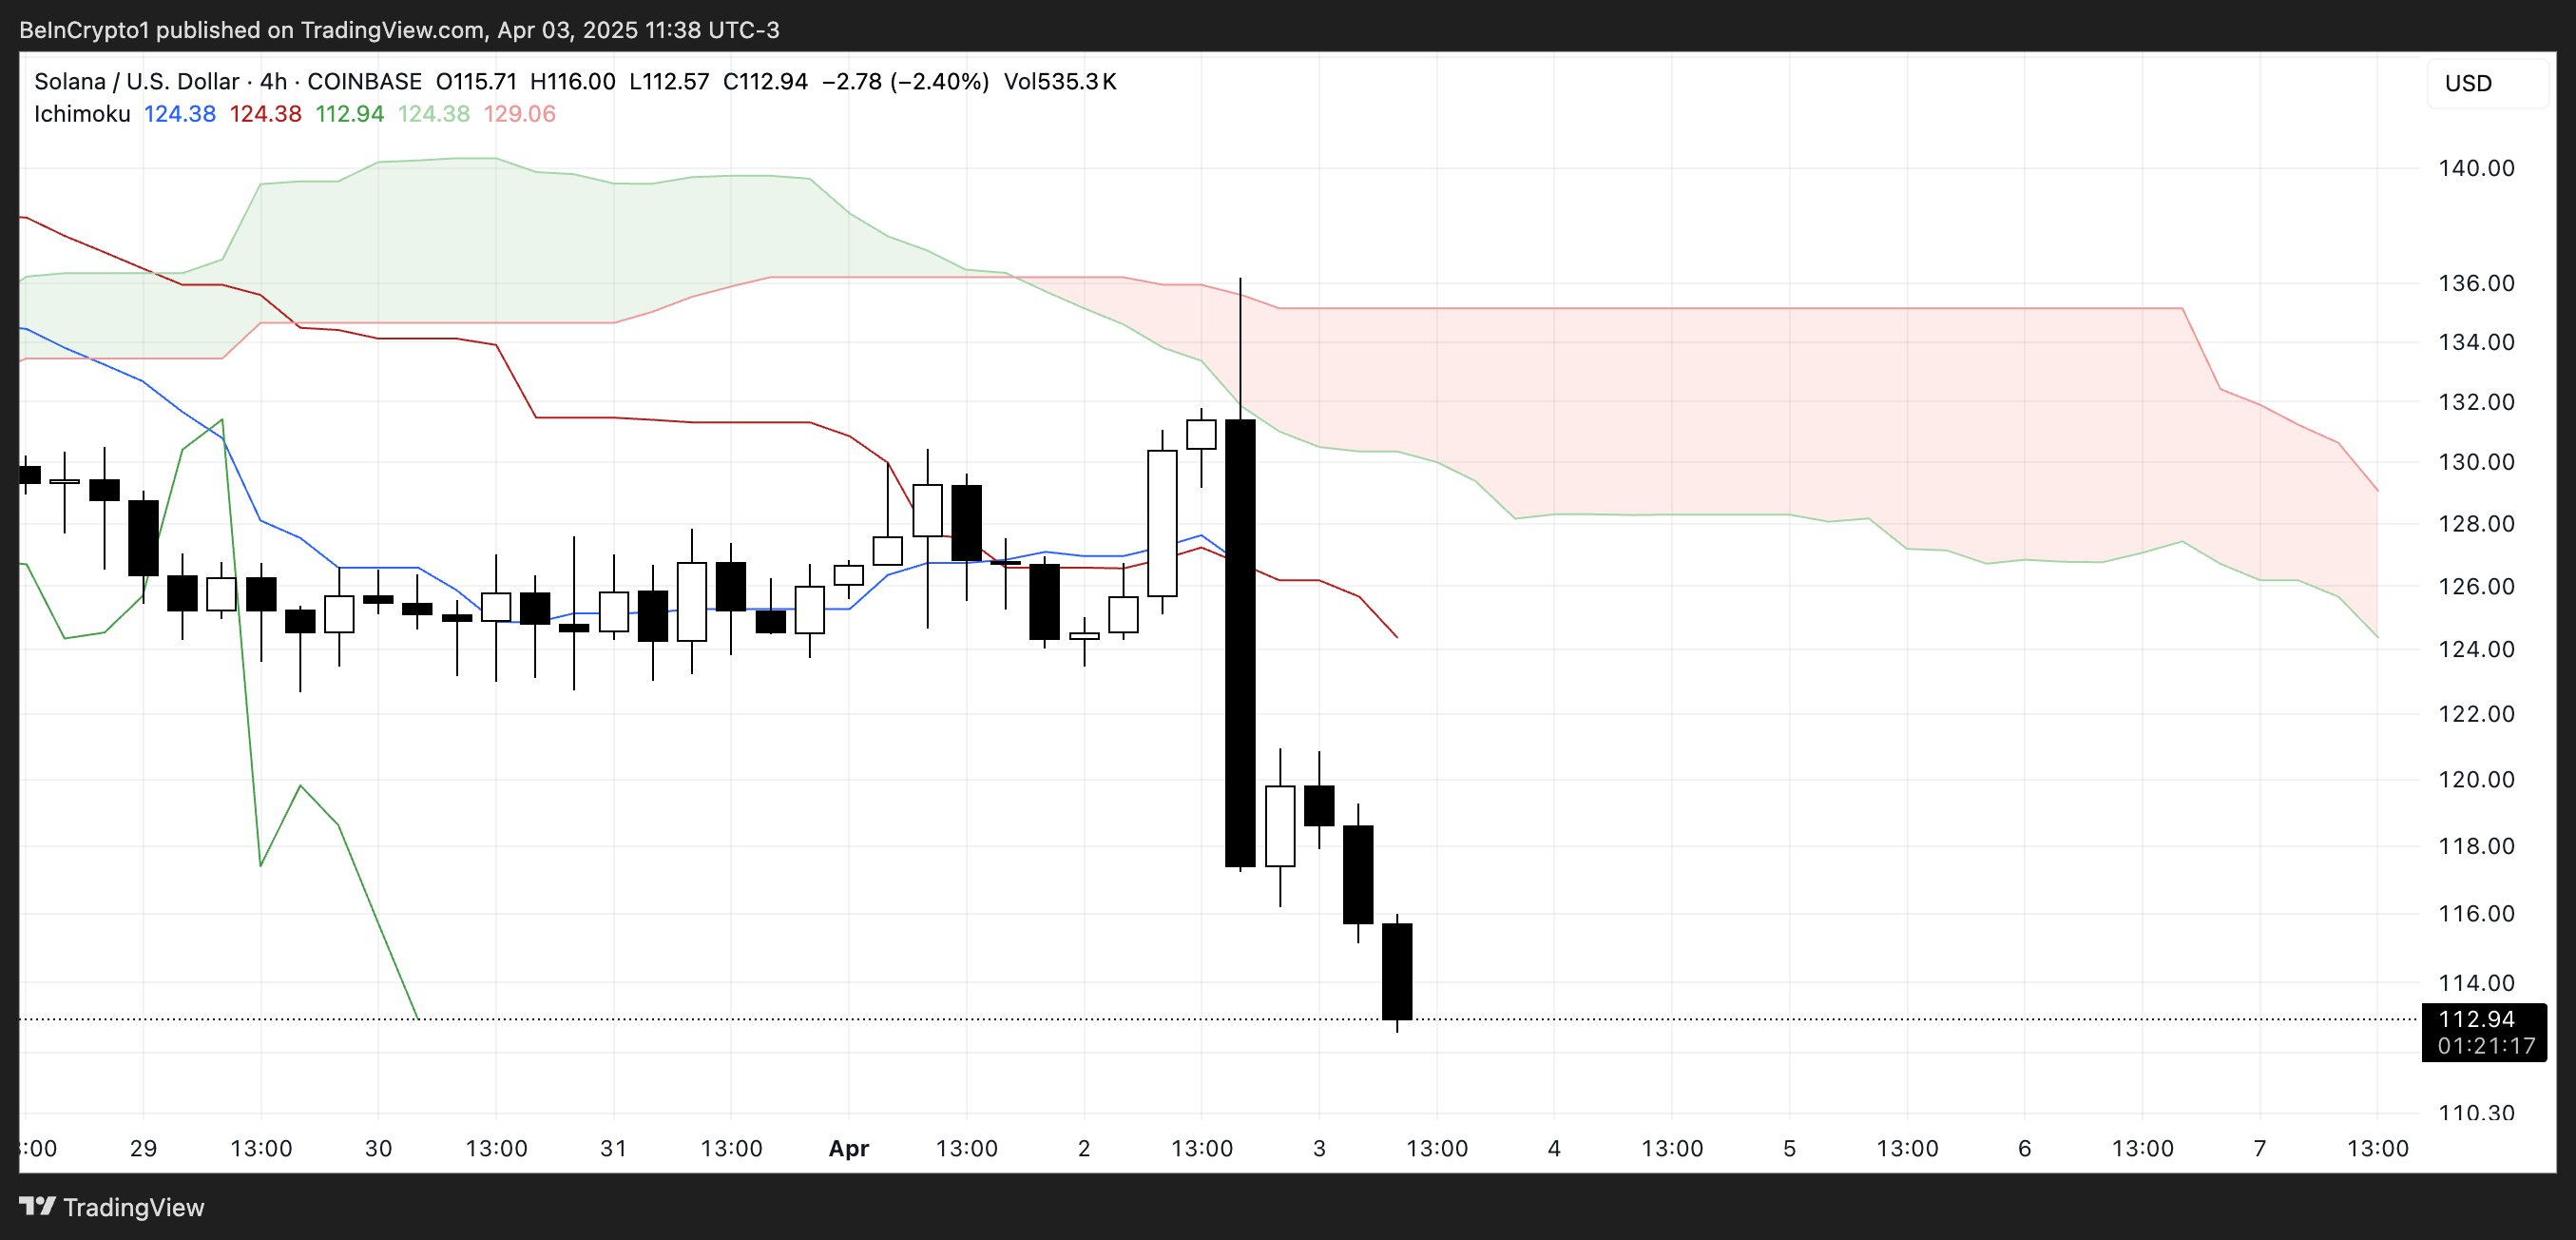
Looking at the Kumo (cloud) itself, the red cloud projected forward is thick and sloping downward, indicating that bearish pressure is expected to persist in the coming sessions.
The price is well below the cloud, which typically means the asset is in a strong downtrend.
For Solana to reverse this trend, it would need to reclaim the Tenkan-sen and Kijun-sen and push decisively through the entire cloud structure—an outcome that looks unlikely in the short term, given the current momentum and cloud formation.
Solana’s BBTrend Signals Prolonged Bearish Momentum
Solana’s BBTrend indicator currently sits at -6, having remained in negative territory for over five consecutive days. Just two days ago, it hit a bearish peak of -12.72, showing the strength of the recent downtrend.
Although it has slightly recovered from that low, the sustained negative reading signals that selling pressure remains firmly in control and that the bearish momentum hasn’t yet been reversed.
The BBTrend (Bollinger Band Trend) measures the strength and direction of a trend using Bollinger Bands. Positive values suggest bullish conditions and upward momentum, while negative values indicate bearish trends.
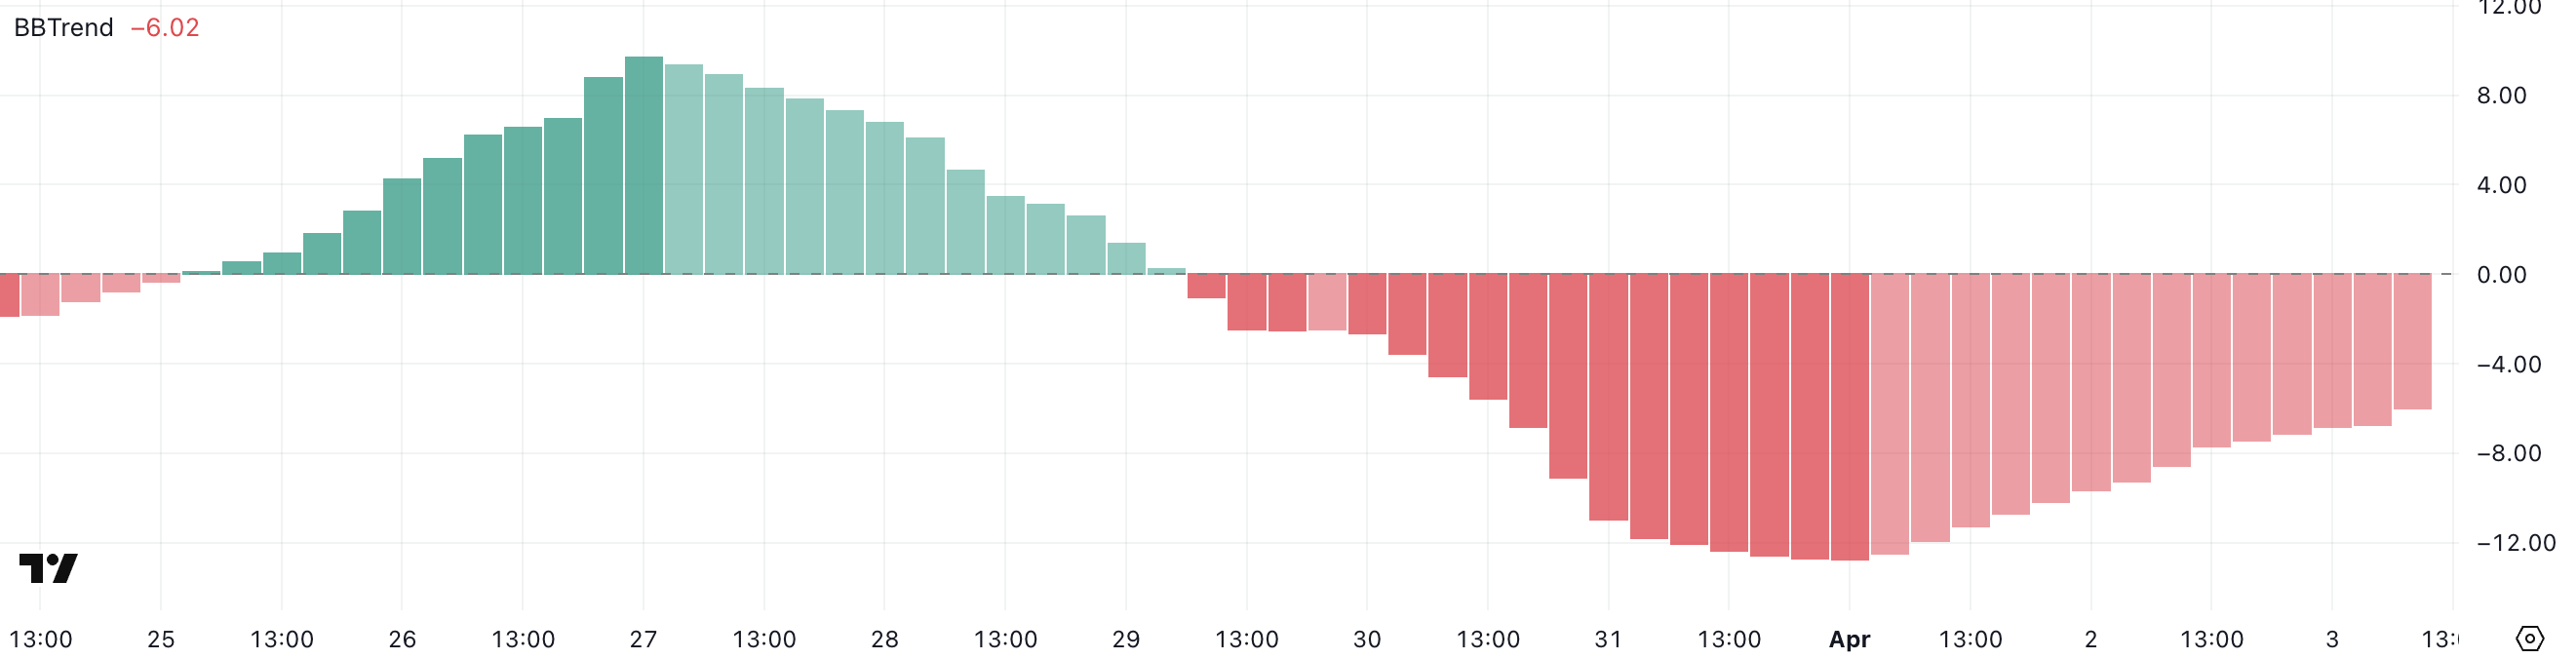
Generally, values beyond 5 are considered strong trend signals. With Solana’s BBTrend still well below -5, it implies that downside risk remains elevated.
Unless a sharp shift in momentum occurs, this persistent bearish reading may continue to weigh on SOL’s price in the near term.
Solana Eyes $112 Support as Bears Test February Lows
Solana’s price has broken below the key $115 level, and the next major support lies around $112. A confirmed move below this threshold could trigger further downside. That could potentially push the price under $110 for the first time since February 2024.
The recent momentum and strong bearish indicators suggest sellers remain in control, increasing the likelihood of testing these lower support levels in the near term.
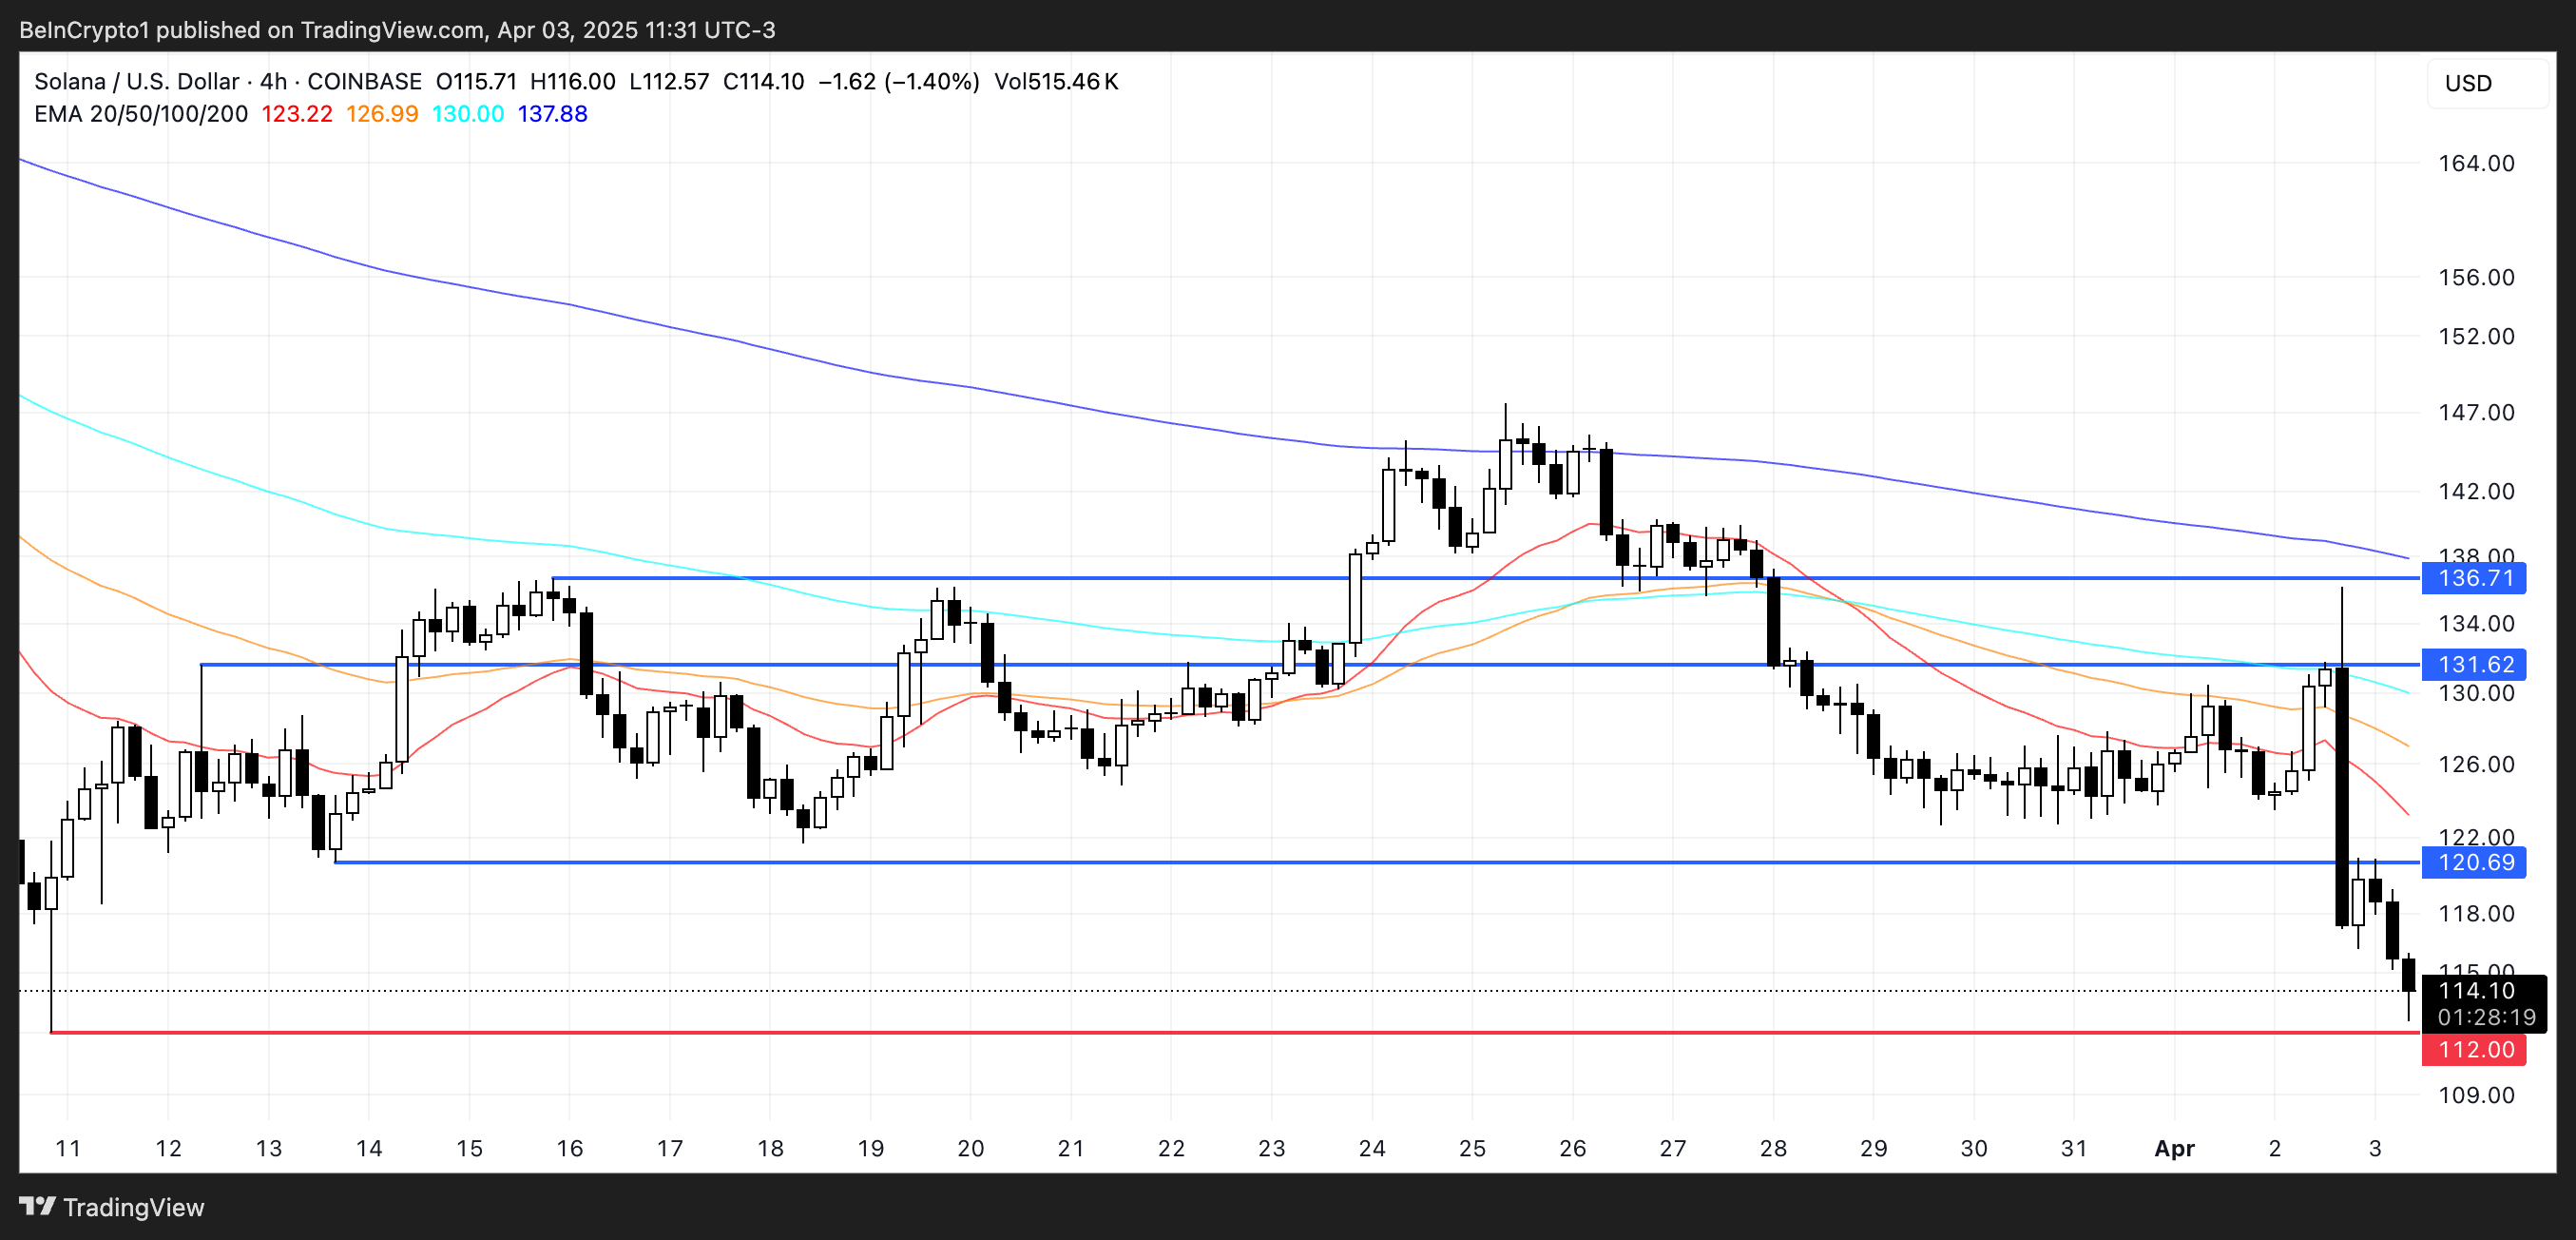
However, if Solana manages to stabilize and reverse its current trajectory, a rebound toward the $120 resistance level could follow.
Breaking above that would be the first sign of recovery, and if bullish momentum accelerates, SOL price could aim for higher targets at $131 and $136.
Disclaimer
In line with the Trust Project guidelines, this price analysis article is for informational purposes only and should not be considered financial or investment advice. BeInCrypto is committed to accurate, unbiased reporting, but market conditions are subject to change without notice. Always conduct your own research and consult with a professional before making any financial decisions. Please note that our Terms and Conditions, Privacy Policy, and Disclaimers have been updated.
Cardano Price Can Clinch $1 As It Eyes Bounce From New Support Zone

Binance Faces Community Backlash and Boycott Calls

Stellar (XLM) Falls 5% as Bearish Signals Strengthen

Why ETF Issuers are Buying Bitcoin Despite Recession Fears

Solana (SOL) Crashes 11%—Is More Pain Ahead?
Expert Reveals XRP Price Could Drop To $1.90 Before Rally To New Highs

2.52 Million Altcoins Are Ruining Crypto’s Future

Animoca Brands Valuation Tanks 75% In Two Years, Here’s Why

Crypto exchange BingX hacked for $43 million

Are The Big Players Losing Interest?

Hong Kong’s Securities Association Tips Authorities On Crypto Self-Regulation

Coinbase cbBTC Set to go Live on Solana
2.52 Million Altcoins Are Ruining Crypto’s Future
Animoca Brands Valuation Tanks 75% In Two Years, Here’s Why
Crypto exchange BingX hacked for $43 million
Are The Big Players Losing Interest?
Hong Kong’s Securities Association Tips Authorities On Crypto Self-Regulation
Coinbase cbBTC Set to go Live on Solana
-
 Altcoin24 hours ago
Binance Sidelines Pi Network Again In Vote To List Initiative, Here’s All
-
 Altcoin21 hours ago
Analyst Forecasts 250% Dogecoin Price Rally If This Level Holds
-

 Market20 hours ago
Cardano (ADA) Downtrend Deepens—Is a Rebound Possible?
-

 Market24 hours ago
XRP Price Reversal Toward $3.5 In The Works With Short And Long-Term Targets Revealed
-

 Market21 hours ago
XRP Price Under Pressure—New Lows Signal More Trouble Ahead
-

 Market16 hours ago
IP Token Price Surges, but Weak Demand Hints at Reversal
-

 Market19 hours ago
Ethereum Price Recovery Stalls—Bears Keep Price Below $2K
-
 Altcoin18 hours ago
VanEck Seeks BNB ETF Approval—Big Win For Binance?