
Market
Will Render (RNDR) Price Save Face From Losing Downtrend?

Render’s (RNDR) price slipped below its downtrend, signaling losses are continuing to rise on the network.
However, this still has not put fear in some investors whose conviction could help the recovery.
Render Investors Exhibit Mixed Signals
Render’s price has noted a considerable drawdown over the past month. During this time, investors lost a huge chunk of their money, and many even receded. The overall Artificial Intelligence (AI) space witnessed bearishness impacting other similar tokens as well. Speaking to the same, Akshay Nassa – Founder of Chimp Exchange, exclusively told BeInCrypto,
“For crypto markets, it’s been a volatile week. AI tokens such as FET, with a market cap of $2.98B, RNDR with a market cap of $2.53B, and GRT, with a market cap of $1.75B, witnessed a substantial decline.Despite the volatile nature of AI tokens in the crypto market, their value propositions are compelling.”
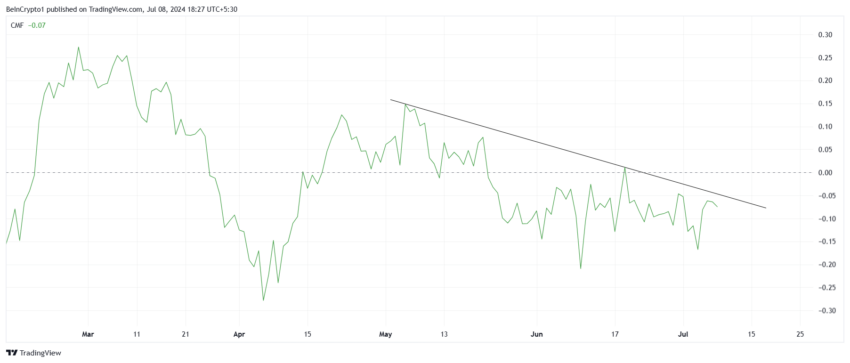
Render’s Chaikin Money Flow (CMF) shows this well, as it has been stuck in a downtrend for the last two months. Currently, it is below the zero line, indicating significant outflows. This typically signifies an increase in selling pressure.
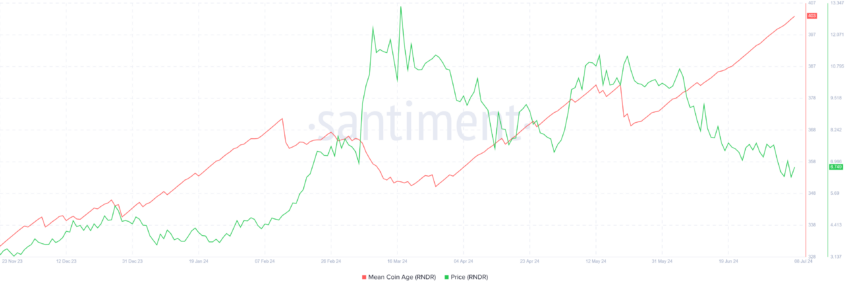
Despite this bearish signal, another key metric tells a different story. Render’s Mean Coin Age continues to show an uptick. This metric measures the average age of coins in the network, indicating how long coins have been held.
An increasing Mean Coin Age suggests that most investors hold onto their coins, showing strong conviction. This behavior contrasts with the selling pressure indicated by the CMF.
Read More: How To Buy Render Token (RENDER) and Everything You Need To Know
The combination of these factors could lead to potential consolidation in Render’s price. While selling pressure is present, the continued holding by long-term investors suggests that a significant price drop may be avoided.
RNDR Price Prediction: Breaking Another Resistance
Render’s price has noted a 40% decline in the last couple of days, invalidating multiple support levels. The altcoin has dropped from $11 to $6.7 in a month, stabilizing above the $6.3 support line.
The mixed signals coming from the investors, however, suggest consolidation above $6.8 and under $8.0. This range has been tested before, and the same could occur again since the market is still volatile.
Read More: Render Token (RNDR) Price Prediction 2024/2025/2030
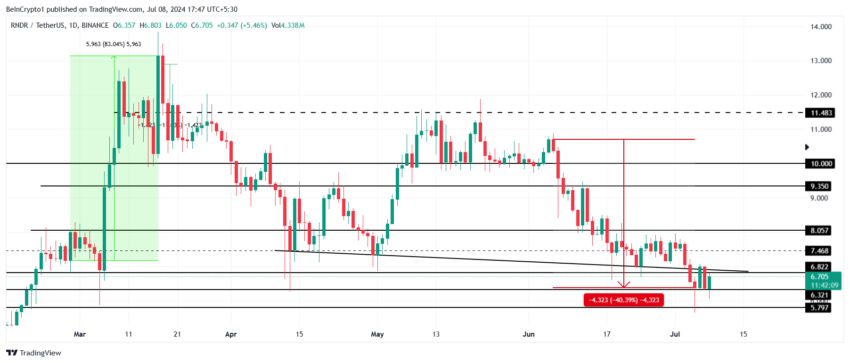
However, if the upper limit of $8.0 is breached, the Render’s price could rally to $9.0 or more. This would invalidate the bearish-neutral thesis to push the altcoin toward recovery.
Disclaimer
In line with the Trust Project guidelines, this price analysis article is for informational purposes only and should not be considered financial or investment advice. BeInCrypto is committed to accurate, unbiased reporting, but market conditions are subject to change without notice. Always conduct your own research and consult with a professional before making any financial decisions. Please note that our Terms and Conditions, Privacy Policy, and Disclaimers have been updated.


Ethereum ETFs have closed yet another week in the red, recording net outflows amid continued investor hesitation.
Notably, there has been no single week of net inflows since the end of February, highlighting waning institutional interest in ETH-related products.
Ethereum ETFs Face Steady Outflows
Ethereum-backed ETFs have recorded their seventh consecutive week of net outflows, highlighting sustained institutional hesitance toward the asset.
This week alone, net outflows from spot ETH ETFs totaled $82.47 million, marking a 39% surge from the $49 million recorded in outflows the previous week.
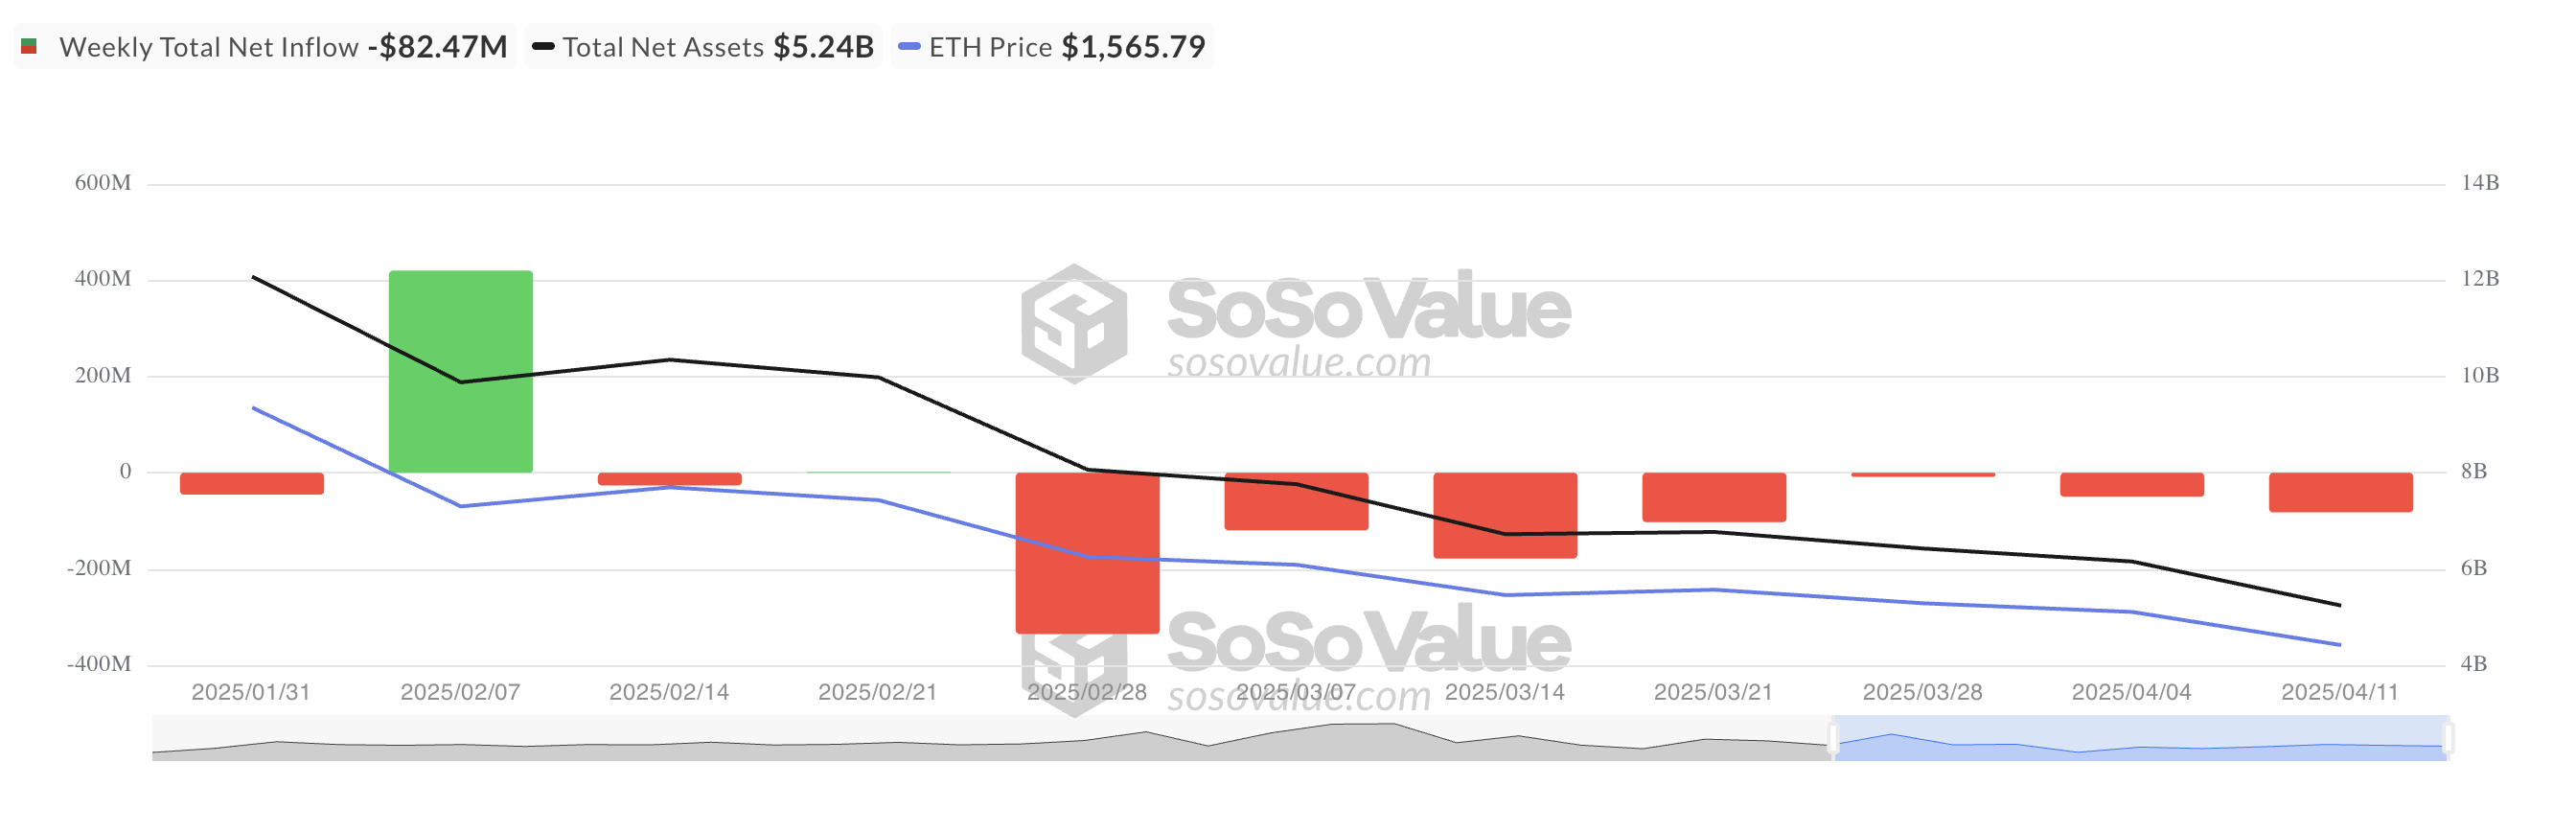
With the steady decline in institutional presence in the ETH market, the selling pressure on the coin has soared.
Over the past week, ETH’s price has declined by 11%. The steady outflows from the funds backed by the coin suggest that the downward momentum may persist, increasing the likelihood of a price drop below the $1,500 mark.
On the price chart, technical indicators remain bearish, confirming the mounting pressure from the selling side of the market. For example, at press time, readings from ETH’s Directional Movement Index (DMI) show its positive directional index (+DI) resting below the negative directional index (-DI).
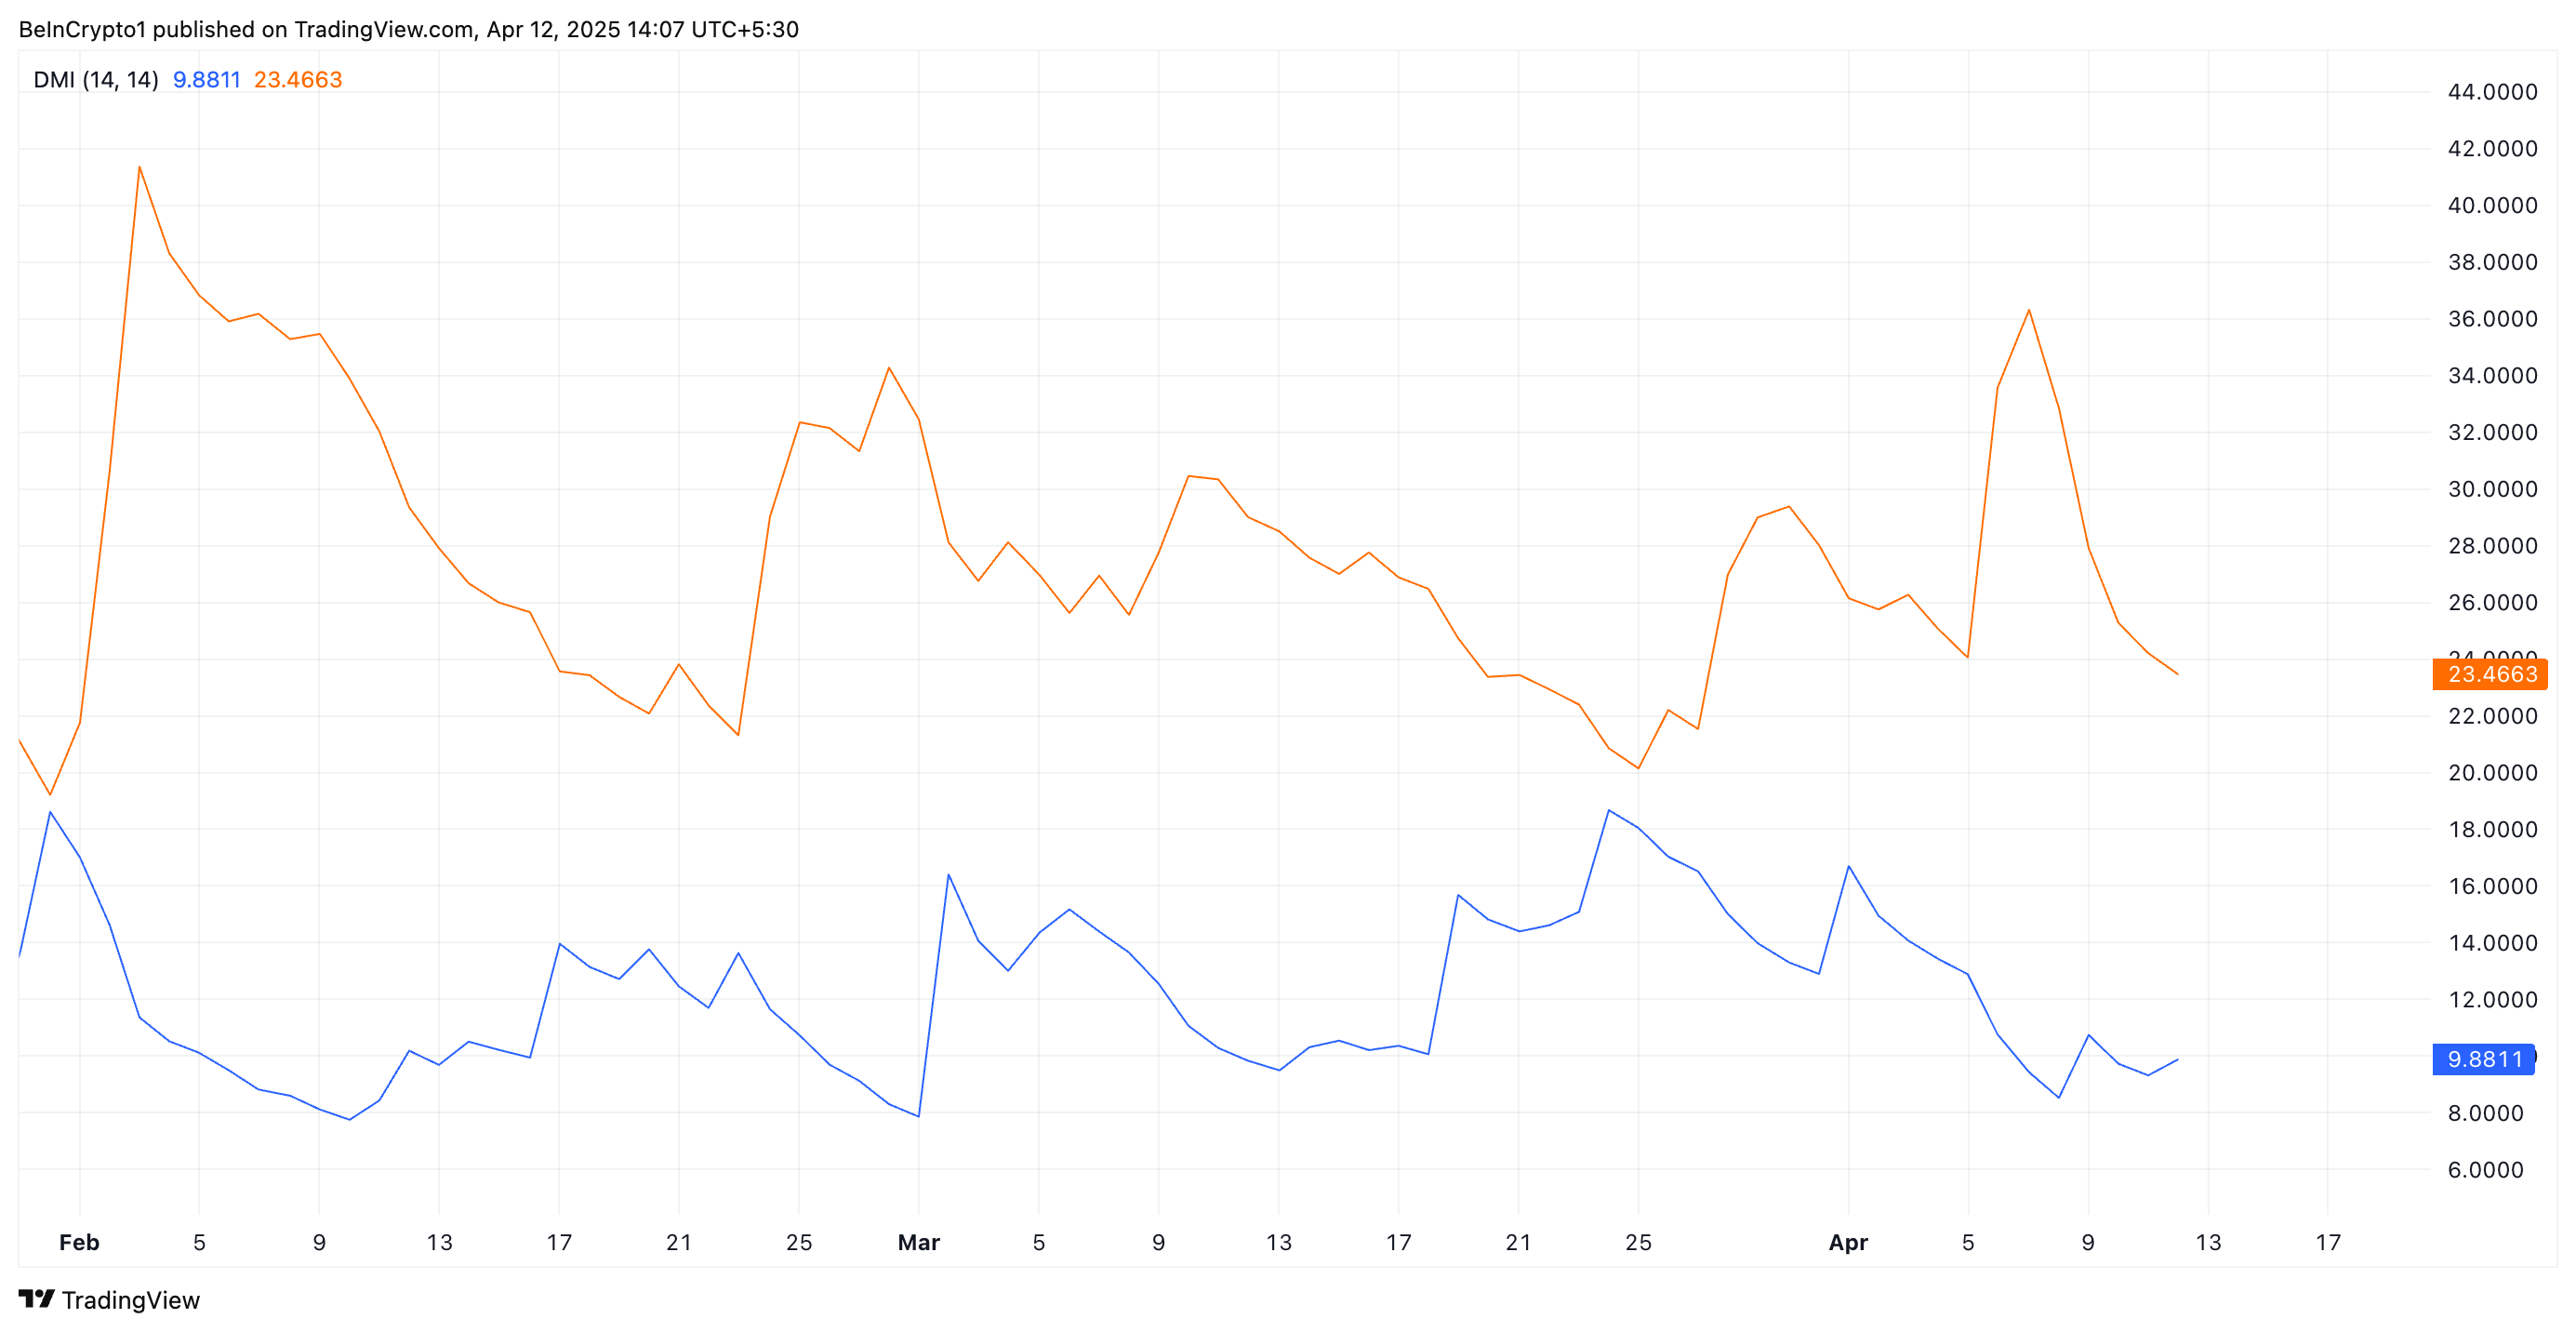
The DMI indicator measures the strength of an asset’s price trend. It consists of two lines: the +DI, which represents upward price movement, and the -DI, which represents downward price movement.
As with ETH, when the +DI rests below the -DI, the market is in a bearish trend, with downward price movement dominating the market sentiment.
Ethereum’s Price Could Drop Below $1,500
The lack of institutional capital could delay any significant rebound in ETH price, further dampening short-term prospects for recovery. If demand leans further, ETH could break out of its narrow range and follow a downward trend.
The altcoin could fall below $1,500 in this scenario to reach $1,395.
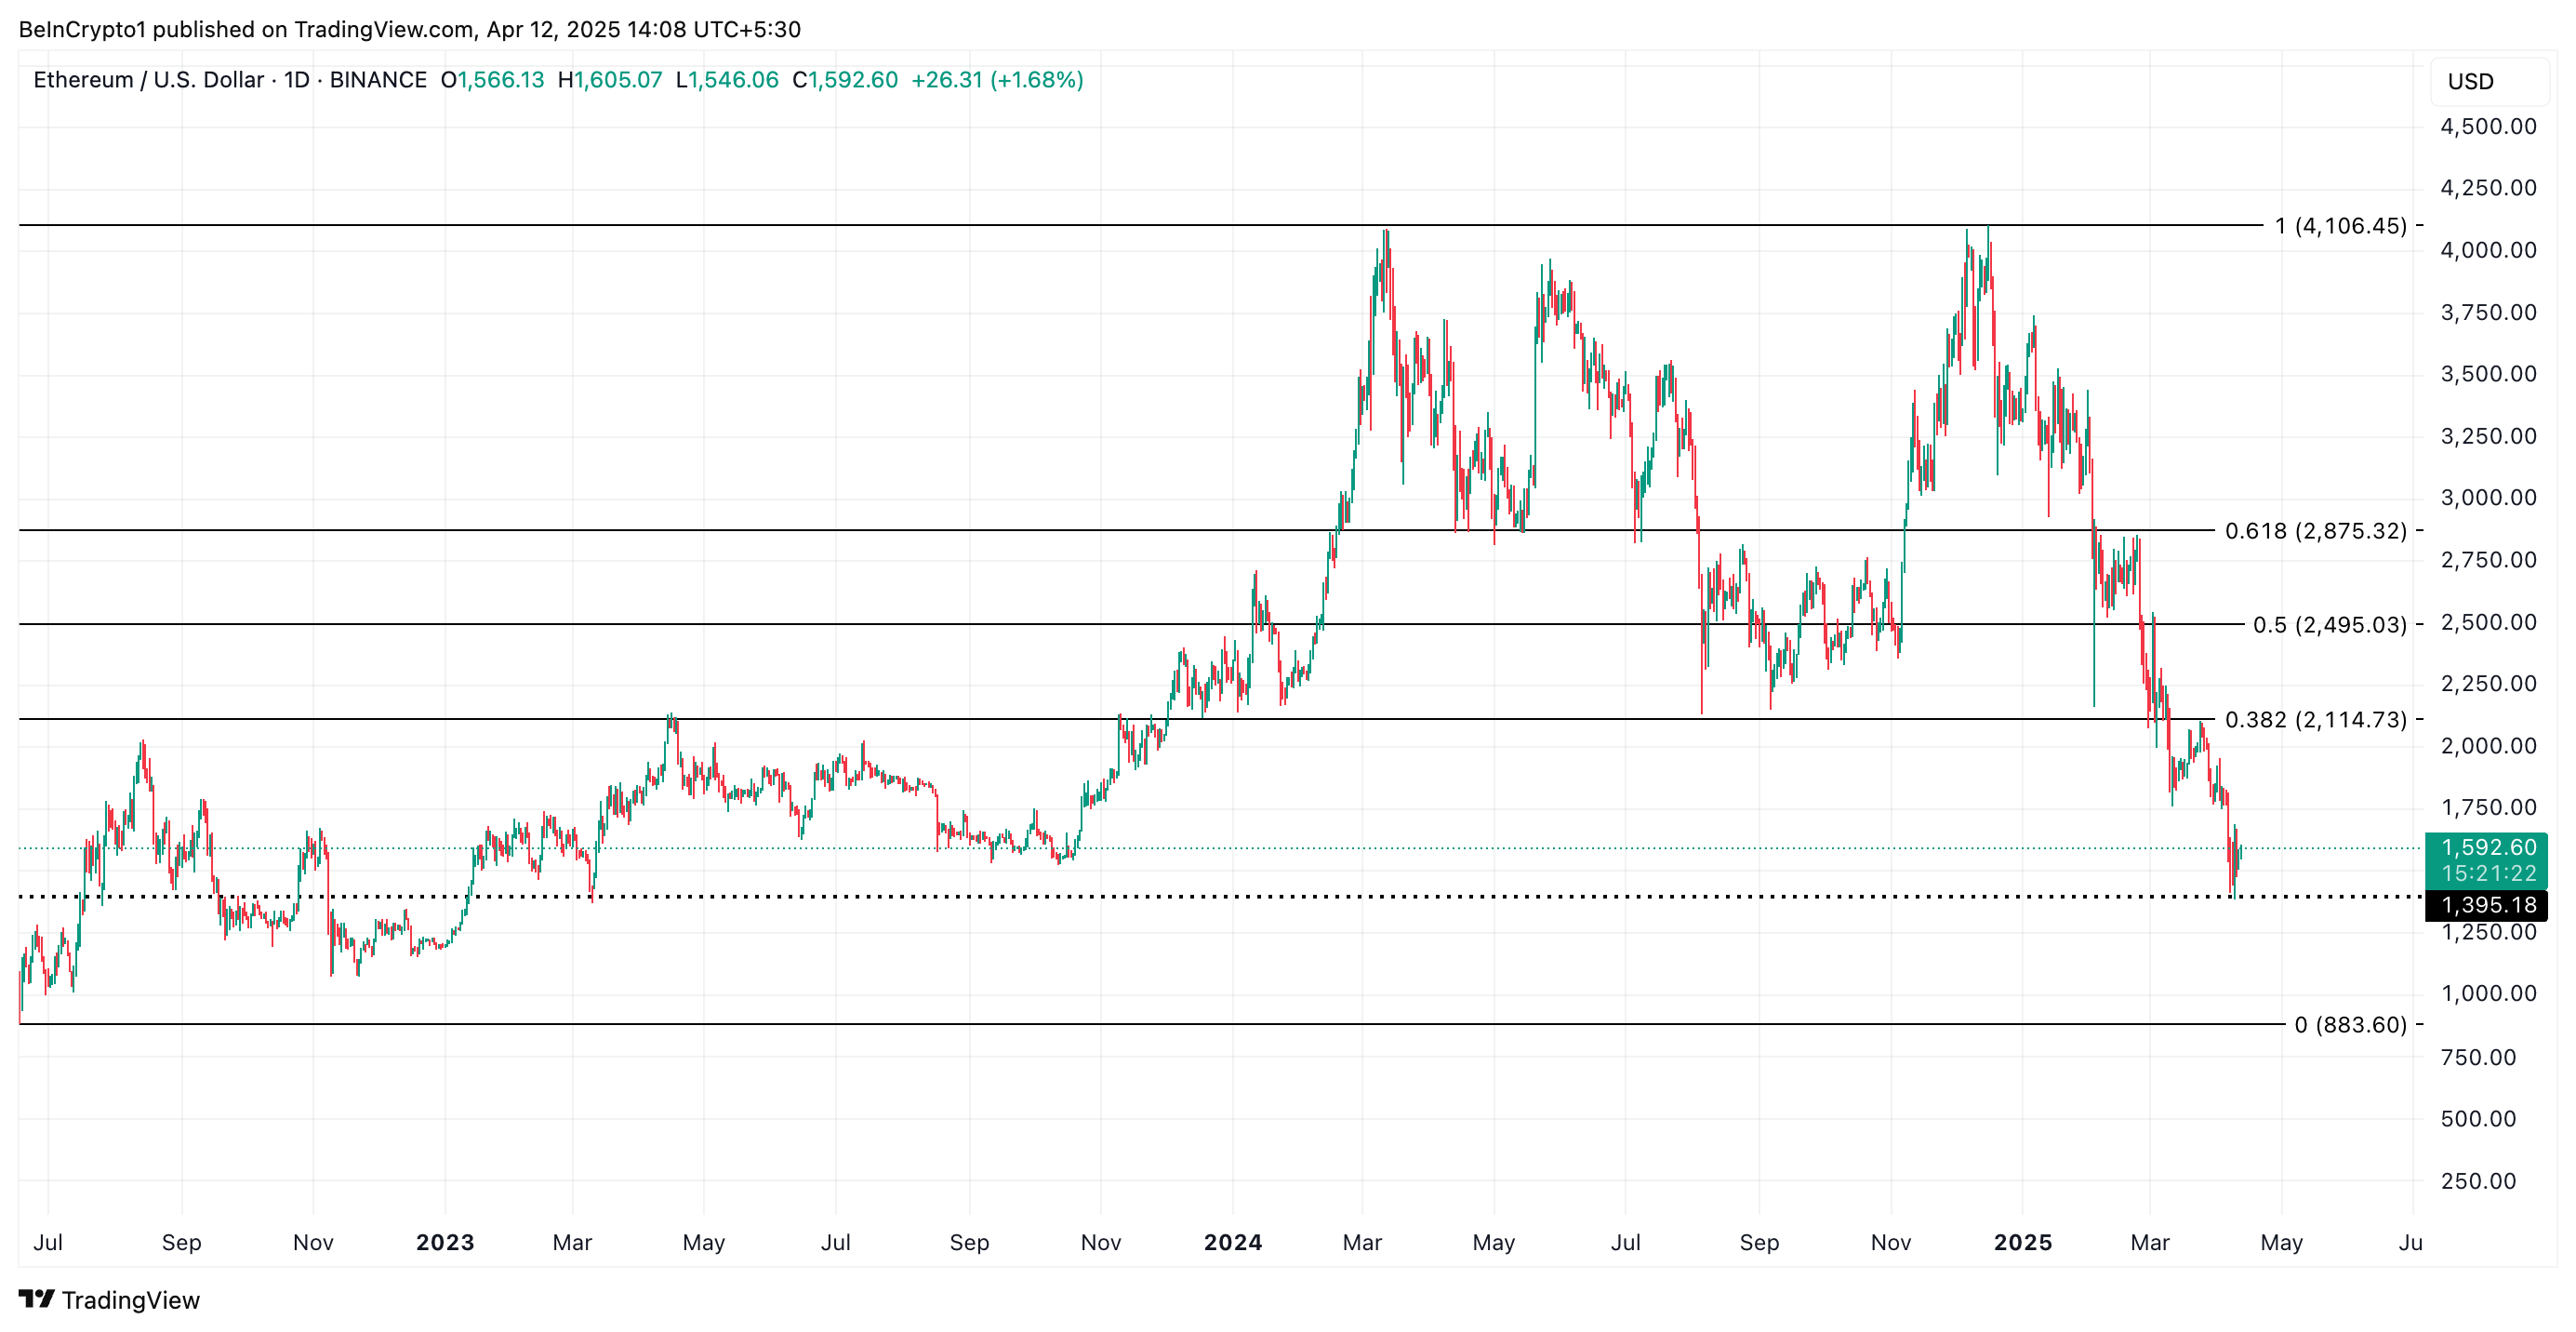
However, if ETH witnesses a positive shift in sentiment and demand spikes, its price could climb to $2,114.
Disclaimer
In line with the Trust Project guidelines, this price analysis article is for informational purposes only and should not be considered financial or investment advice. BeInCrypto is committed to accurate, unbiased reporting, but market conditions are subject to change without notice. Always conduct your own research and consult with a professional before making any financial decisions. Please note that our Terms and Conditions, Privacy Policy, and Disclaimers have been updated.

Mark Uyeda, Acting Chair of the US Securities and Exchange Commission (SEC), has encouraged crypto industry participants to offer input on a proposed framework. The initiative is designed to ease regulatory pressure on digital asset trading.
Speaking at the SEC’s April 11 Crypto Task Force roundtable, Uyeda highlighted the growing disconnect between current regulations and the realities of blockchain innovation.
SEC Considers Federal Licensing Model to Streamline Crypto Compliance
Uyeda likened the evolution of crypto markets to the early days of US securities trading, which began under a buttonwood tree in New York City.
He argued that early brokers created rules that suited the needs of their time. In the same way, modern regulators must now consider frameworks that align with the distinct structure of crypto platforms.
Unlike traditional exchanges, crypto trading systems often combine custody, execution, and clearing into one platform. Blockchain technology makes this integration possible.
Uyeda pointed out that this setup can improve transparency, efficiency, and trading speed. He also highlighted benefits like 24/7 trading through smart contracts and streamlined collateral management via tokenization.
“Blockchain technology offers the potential to execute and clear securities transactions in ways that may be more efficient and reliable than current processes,” Uyeda said.
Still, Uyeda acknowledged that the architects of US securities laws never anticipated blockchain technology or decentralized systems. As a result, compliance challenges have emerged as many tokenized securities remain unregistered and ineligible for national exchanges.
Besides that, existing rules, such as the order protection rule, are also difficult to apply in hybrid trading environments where assets move between on-chain and off-chain systems.
Uyeda also criticized the current patchwork of state-by-state licensing requirements, which create barriers for crypto firms aiming to operate nationwide.
To address these gaps, Uyeda proposed a conditional relief framework that could support experimentation while maintaining investor protections. He also suggested that a unified federal licensing model under the SEC could simplify compliance and enhance market consistency.
“Under an accommodating federal regulatory framework, some market participants would likely prefer to offer trading in both tokenized securities and non-security crypto assets under a single SEC license rather than offer trading solely in non-security crypto assets under fifty different state licenses,” Uyeda said.
Nonetheless, he invited industry experts to recommend specific areas where such relief would unlock practical use cases without undermining market integrity.
Uyeda’s remarks signal the SEC’s growing awareness that digital asset regulation must evolve. While long-term reform may take time, the proposed relief framework could create room for innovation without compromising market safeguards
Disclaimer
In adherence to the Trust Project guidelines, BeInCrypto is committed to unbiased, transparent reporting. This news article aims to provide accurate, timely information. However, readers are advised to verify facts independently and consult with a professional before making any decisions based on this content. Please note that our Terms and Conditions, Privacy Policy, and Disclaimers have been updated.

Despite lingering market uncertainty fueled by Donald Trump’s escalating trade war, the cryptocurrency market showed signs of recovery this week.
On-chain data reveals that crypto whales took advantage of the volatility to accumulate select altcoins, signaling growing confidence in specific digital assets.
Dogecoin (DOGE)
Leading meme coin Dogecoin (DOGE) has received significant attention from crypto whales this week. This is reflected by the spike in the number of coins purchased over the past seven days by DOGE whale addresses that hold between 100 million and 1 billion coins.
According to data from Santiment, these DOGE holders have accumulated 1.41 billion coins worth over $220 million during the review period. As of press time, their total holdings have surged to 25.68 billion DOGE, marking the highest level since December last year.
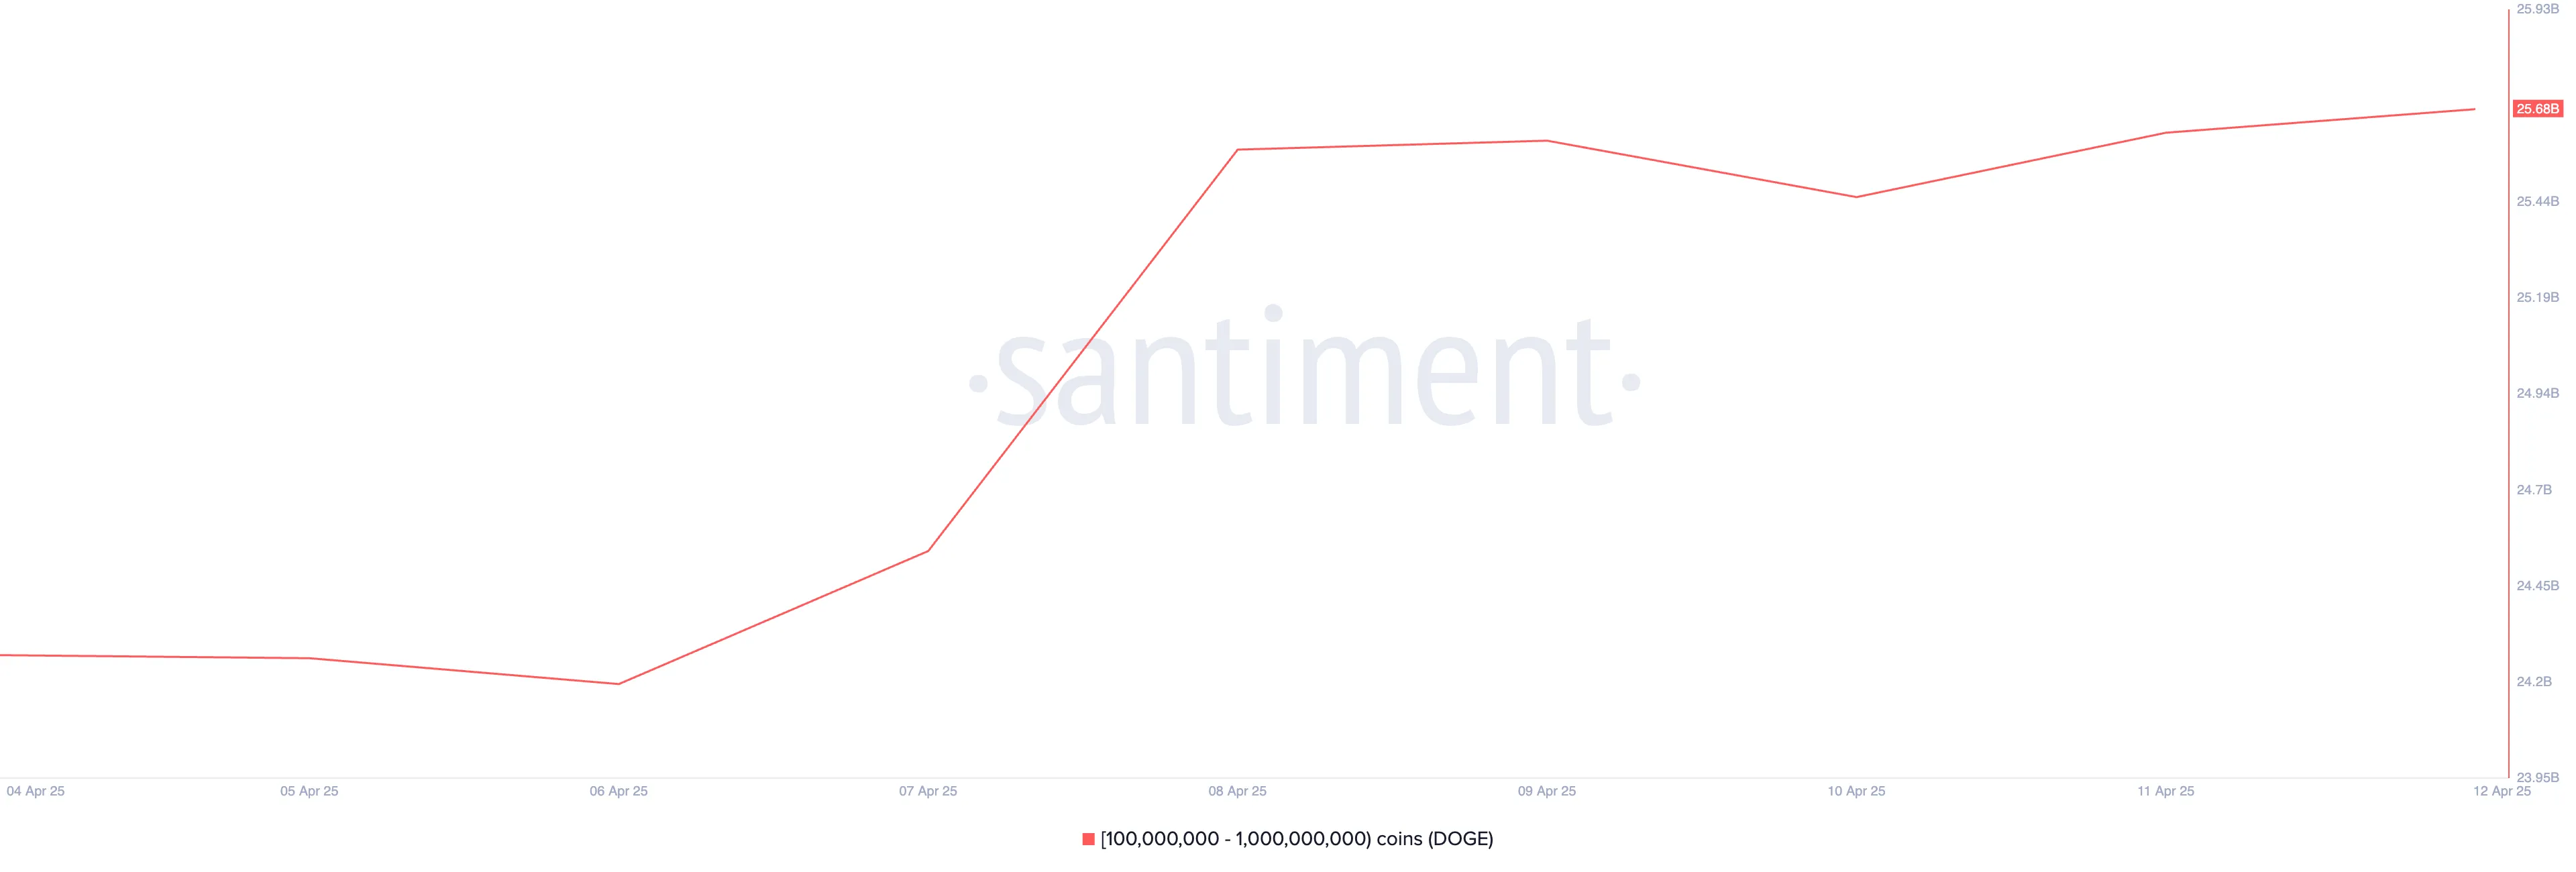
When an asset’s large holders increase their accumulation like this, it suggests increased confidence or anticipation of future price gains. If this continues, DOGE could break above the resistance at $0.17 in the near term and climb toward $0.23.
Worldcoin (WLD)
WLD is another altcoin that has caught whales’ attention this week. The Sam Altman-linked token currently trades at $0.74, shedding 1% of its value over the past week.
During that period, whales holding between 100,000 and 1,000,000 WLD have accumulated 2.63 million tokens valued above $1.94 million.
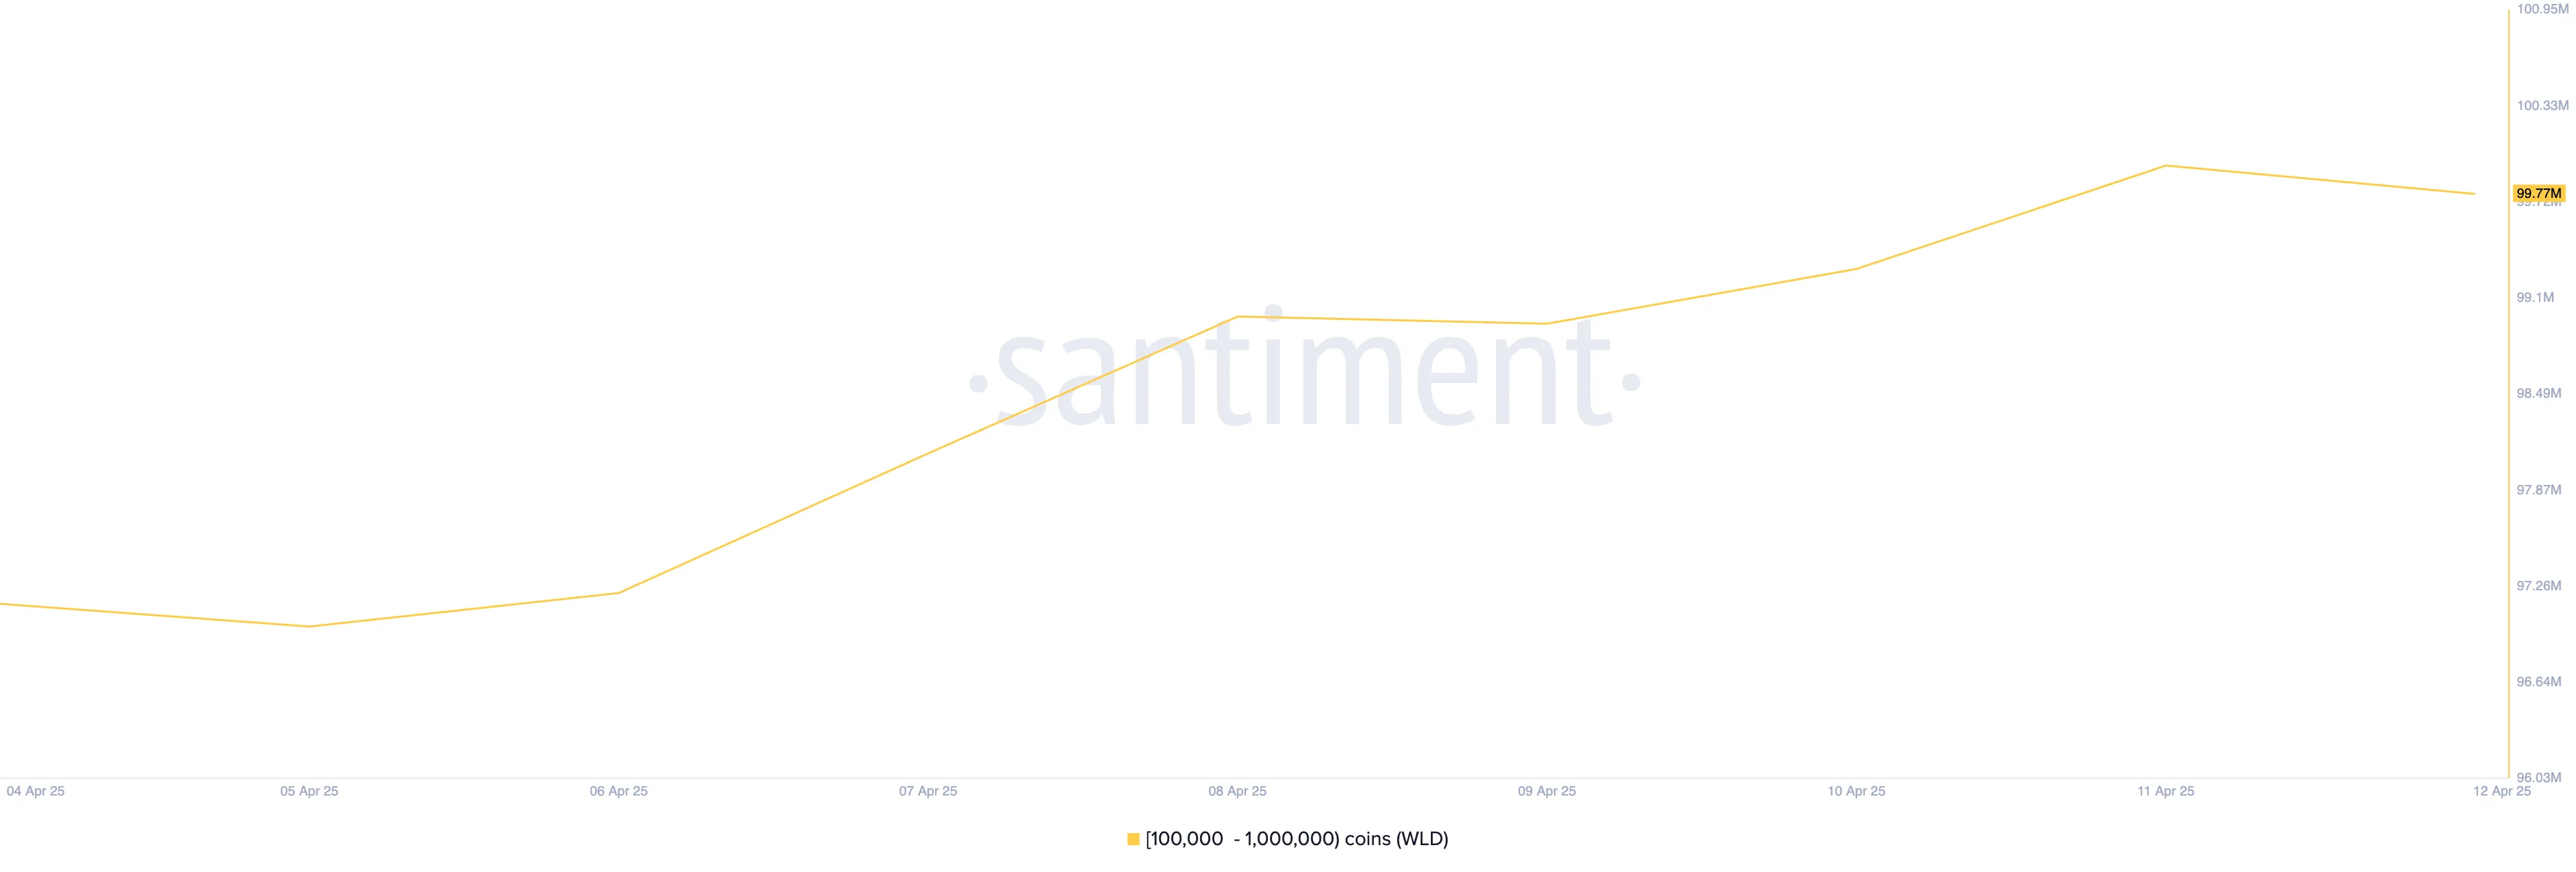
If whale accumulation persists, it could make WLD buck the broader market downtrend to record gains.
Ondo (ONDO)
The real-world asset-based (RWA) token ONDO is also on this week’s crypto whales’ list. According to Santiment, in the past seven days, whales holding between 1 million and 10 million ONDO have purchased 19.41 million, valued at approximately $17 million.
This cohort of ONDO investors currently holds 702.37 million coins.
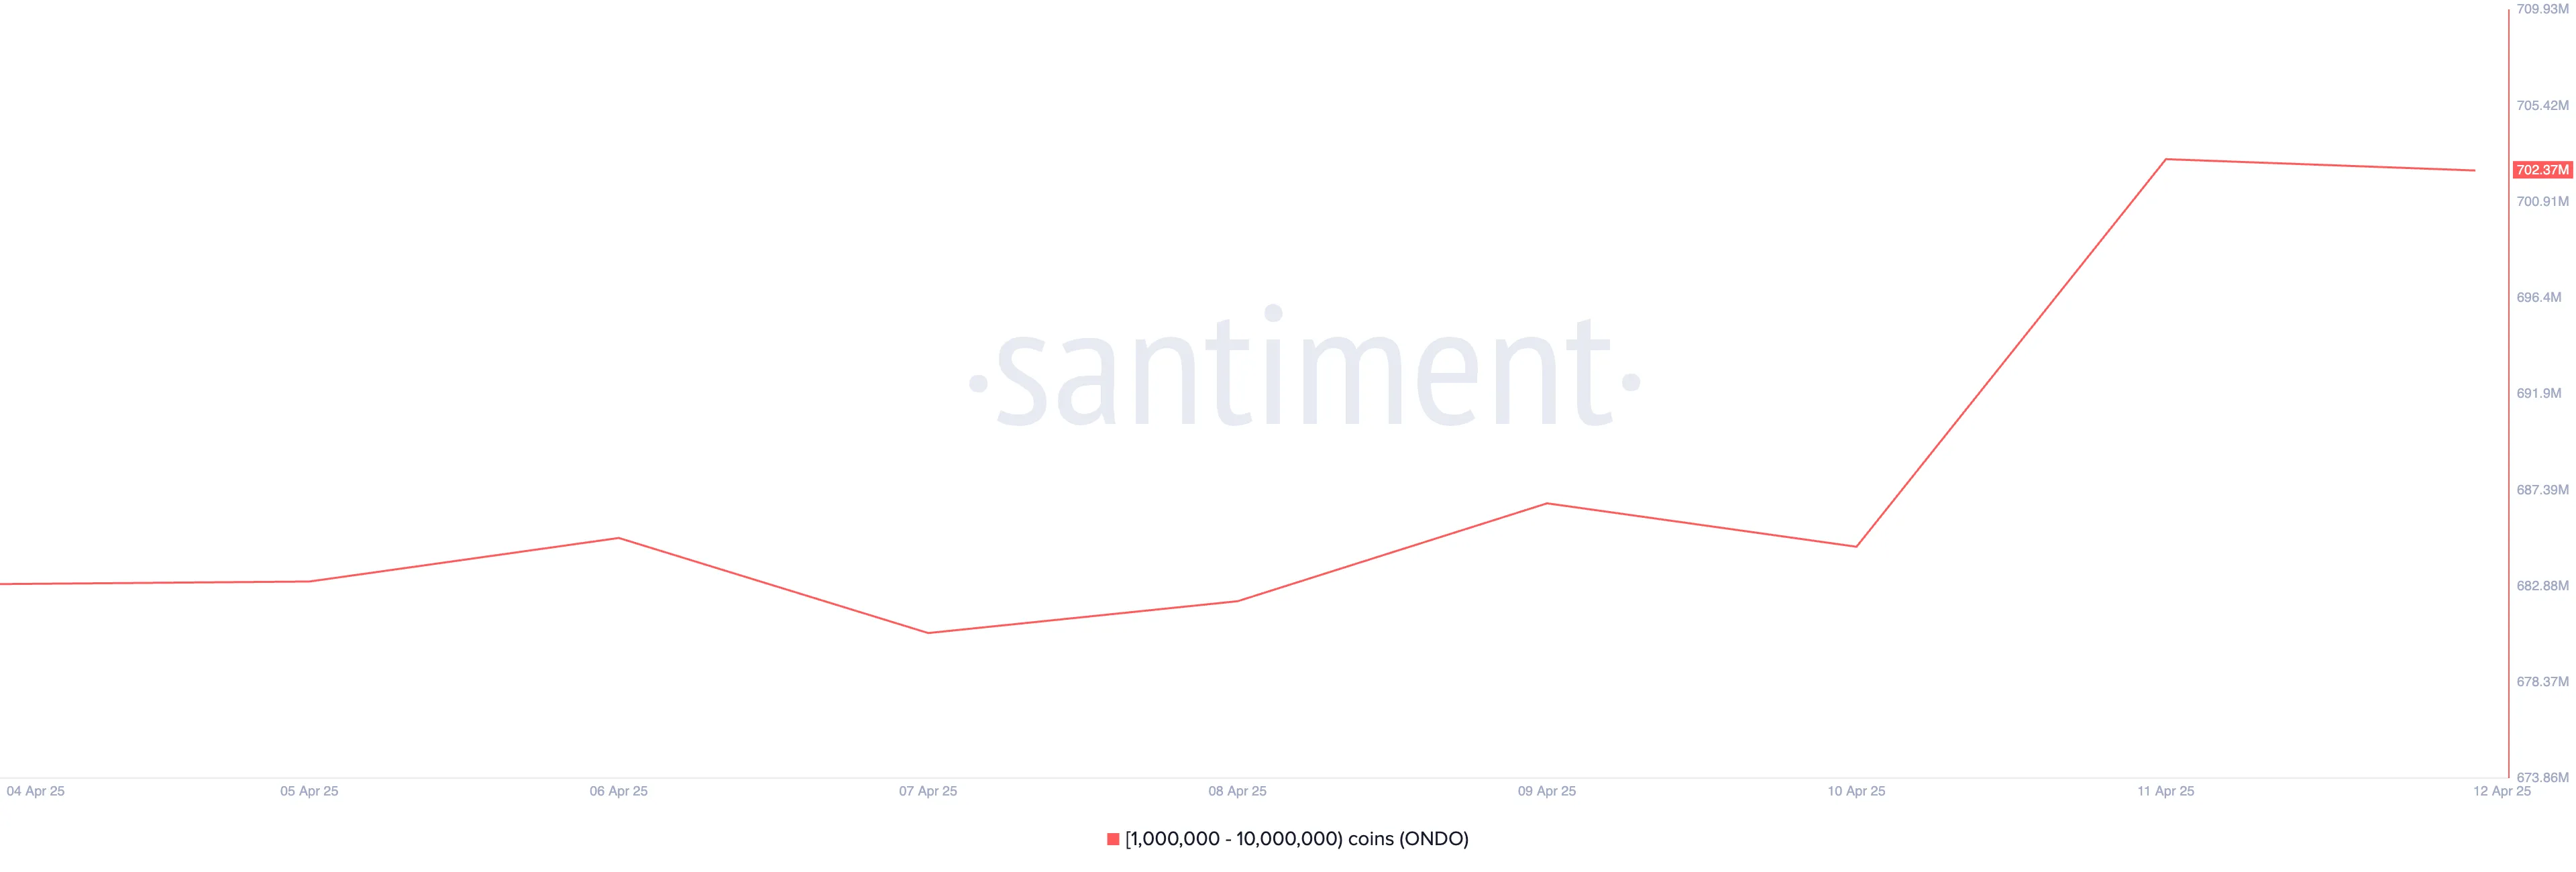
Should this prompt a market-wide ONDO accumulation phase, it could signal the resurgence of interest in RWA-based assets and drive further price momentum in the coming weeks.
Disclaimer
In line with the Trust Project guidelines, this price analysis article is for informational purposes only and should not be considered financial or investment advice. BeInCrypto is committed to accurate, unbiased reporting, but market conditions are subject to change without notice. Always conduct your own research and consult with a professional before making any financial decisions. Please note that our Terms and Conditions, Privacy Policy, and Disclaimers have been updated.

Bitcoin’s Impact Alarming, Says NY Atty. General—Congress Needs To Act

Ethereum ETFs See Seventh Consecutive Week of Net Outflows

SEC Signals Readiness to Rethink Crypto Trading Oversight
Crypto Whales Position for Gains with DOGE, WLD and ONDO
Solana Meme Coin Fartcoin Price Could Hit $1.29 If It Holds This Key Level

Binance Reportedly Seeks Reentry Into American Market

2.52 Million Altcoins Are Ruining Crypto’s Future

Animoca Brands Valuation Tanks 75% In Two Years, Here’s Why

Crypto exchange BingX hacked for $43 million

Are The Big Players Losing Interest?

Hong Kong’s Securities Association Tips Authorities On Crypto Self-Regulation

Coinbase cbBTC Set to go Live on Solana
2.52 Million Altcoins Are Ruining Crypto’s Future
Animoca Brands Valuation Tanks 75% In Two Years, Here’s Why
Crypto exchange BingX hacked for $43 million
Are The Big Players Losing Interest?
Hong Kong’s Securities Association Tips Authorities On Crypto Self-Regulation
Coinbase cbBTC Set to go Live on Solana
-

 Market18 hours ago
This is Why The Federal Reserve Might Not Cutting Interest Rates
-

 Regulation22 hours ago
US Senators Reintroduce PROOF Act To Set Reserve Standards for Crypto Firms
-

 Market21 hours ago
3 Altcoins to Watch for Binance Listing This April
-
 Market19 hours ago
Lawmakers Propose the PROOF Act to Avoid Another FTX Incident
-
 Market23 hours ago
Investors Shift to Crypto, Gold, and Equities Amid Tariff Volatility
-

 Market16 hours ago
Crypto Whales Are Buying These Altcoins Post Tariffs Pause
-

 Market15 hours ago
Binance and the SEC File for Pause in Lawsuit
-
 Altcoin7 hours ago
Shiba Inu Burn Rate Explodes 1000%, Can SHIB Price Hit $0.000015?