
Market
These Are the Altcoin Gainers for the First Week of July 2024
Talks of an altcoin season have been put to rest after the total crypto market cap briefly slipped below $2 trillion. The decline resulted from a broader price crash in which many altcoins reached extremely low values that had not appeared in weeks, some months, and others— years.
Despite the steep correction, a few cryptocurrencies posted gains in the first week of July. Here are the top five.
MultiversX (EGLD) Bulls Show Resilience
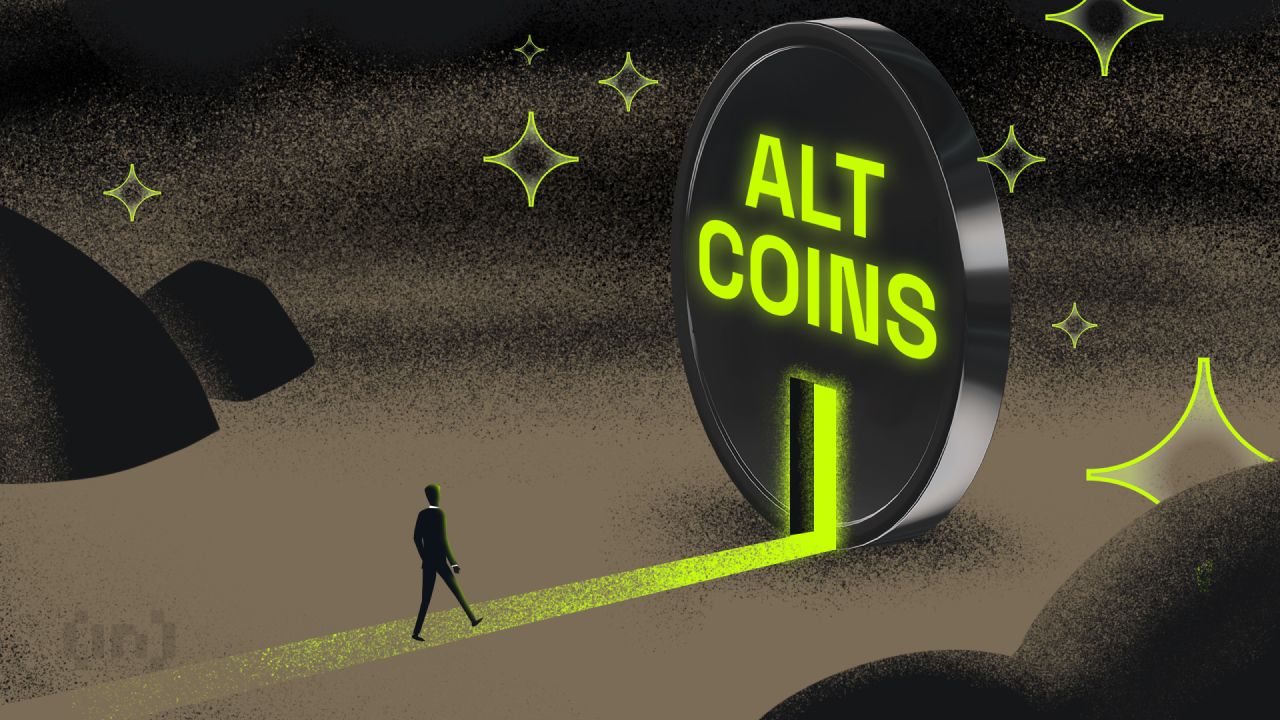
MultiversX (EGLD), the native token of the new Internet economy blockchain, registered a 1.5% increase in the last seven days. However, the last 24 hours have been better as the price climbed by 7.15%% while trading at $31.42.
Earlier in the week, EGLD’s price increased to $32.18. But on July 3, the price fell to $29.43. Eventually, bulls could not defend the support, falling to $27.87.
However, the 4-hour showed that bulls mounted support around $27 to prevent a further fall. As a result, a bullish engulfing candle appears on the chart, leading the token value higher.
In addition, the token’s price is above the 20 EMA (blue) and 50 EMA (yellow). EMA stands for Exponential Moving Average and measures price changes over a period of time.
Read More: What Is Altcoin Season? A Comprehensive Guide
If the price is below the short-term EMAs, the trend is bearish. However, since it is above the indicators, it means that EGLD may continue to jump.
In addition, if this happens, the token will revisit its weekly high of $32.18. However, invalidation may occur if the market correction worsens.
MANTRA (OM) Triumphant After Tokenization Deal
Second on the list of altcoin gainers is MANTRA (OM). MANTRA is a layer-1 blockchain focused on the security of Real-World Assets (RWAs).
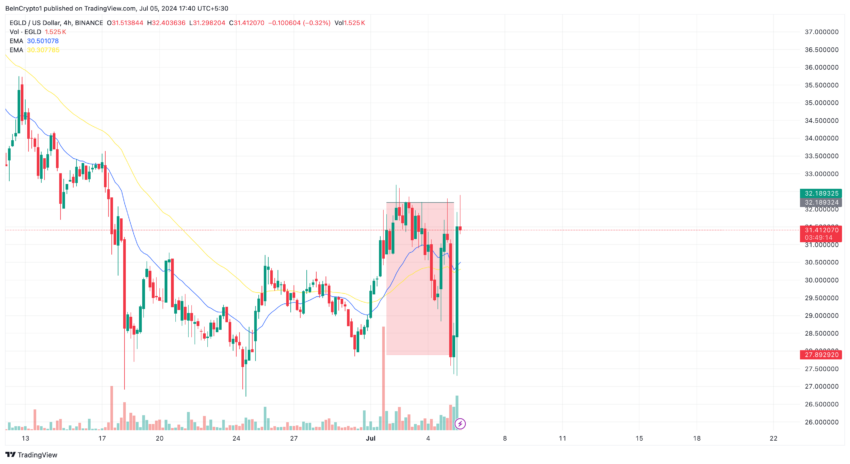
This week, OM’s price increased by 11%, trading at $0.78 at press time. Initially, the token’s price jumped to $0.89 after the project concluded a $500 million tokenization deal.
Afterward, the value declined to $0.74 before the recent revival. According to the OM/USD daily chart, the Moving Average Convergence Divergence (MACD) is positive.
As a key technical indicator, the MACD helps traders spot trend reversals by comparing the difference between the 26-day EMA (orange) and the 12-day EMA (blue). If the reading is positive, it implies that momentum is bullish and prices can increase.
The opposite happens when the MACD is negative. Since the reading is in the green zone, it implies that OM’s momentum is bullish. A look at the Fibonacci retracement indicator gives an idea of possible price targets.
From the chart above, OM can climb to $0.84, which is the 0.618 Fib level position. This will be the case if buying pressure increases. However, if things turn around, OM may retrace, possibly leading the price back to $0.72.
LayerZero (ZRO) Tops the Altcoin Gainers Table
LayerZero (ZRO) is a surprise entry into the top altcoin gainers of the first week. This is largely due to the controversy that rocked the token launch and airdrop distribution.
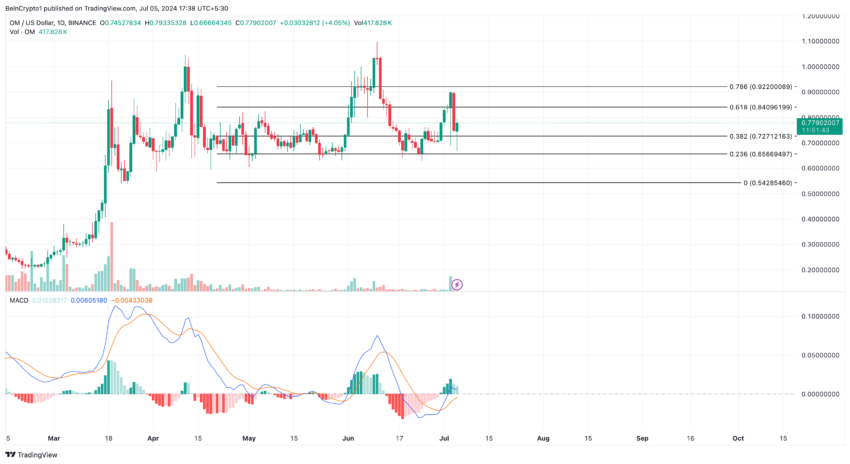
But none of the top 3 altcoin gainers comes close to ZRO. The token trades at $3.32, representing a 29.30% increase this week.
According to the 4-hour chart, ZRO was oversold on July 5. During this period, the Relative Strength Index (RSI), which measures momentum was below 30.00. The Chaikin Money Flow (CMF), which tracks accumulation and distribution, confirms the selling pressure at that time.
However, as of this writing, traders seem to be accumulating the token, as indicated by the CMF reading. The RSI is also on the cusp of jumping above the 50.00 neutral point.
Read More: Which Are the Best Altcoins to Invest in July 2024?
If this happens, coupled with a rise of the CMF into the positive region, ZRO’s price can reach $3.45 in the short term. However, the inability to reach the zones mentioned above may invalidate the prediction. Should this happen, ZRO may slip to $3.07.
Disclaimer
In line with the Trust Project guidelines, this price analysis article is for informational purposes only and should not be considered financial or investment advice. BeInCrypto is committed to accurate, unbiased reporting, but market conditions are subject to change without notice. Always conduct your own research and consult with a professional before making any financial decisions. Please note that our Terms and Conditions, Privacy Policy, and Disclaimers have been updated.


Reason to trust
![]()
Strict editorial policy that focuses on accuracy, relevance, and impartiality
Created by industry experts and meticulously reviewed
The highest standards in reporting and publishing
Strict editorial policy that focuses on accuracy, relevance, and impartiality
Morbi pretium leo et nisl aliquam mollis. Quisque arcu lorem, ultricies quis pellentesque nec, ullamcorper eu odio.
Ethereum price attempted a recovery wave above the $1,880 level but failed. ETH is now trimming all gains and remains below the $1,880 resistance zone.
- Ethereum failed to stay above the $1,850 and $1,880 levels.
- The price is trading below $1,850 and the 100-hourly Simple Moving Average.
- There was a break below a key bullish trend line with support at $1,865 on the hourly chart of ETH/USD (data feed via Kraken).
- The pair must clear the $1,865 and $1,890 resistance levels to start a decent increase.
Ethereum Price Fails Again
Ethereum price managed to stay above the $1,800 support zone and started a recovery wave, like Bitcoin. ETH was able to climb above the $1,850 and $1,880 resistance levels.
The bulls even pushed the price above the $1,920 resistance zone. However, the bears are active near the $1,950 zone. A high was formed at $1,955 and the price trimmed most gains. There was a break below a key bullish trend line with support at $1,865 on the hourly chart of ETH/USD.
A low was formed at $1,781 and the price is now consolidating near the 23.6% Fib retracement level of the downward move from the $1,955 swing high to the $1,781 low.
Ethereum price is now trading below $1,850 and the 100-hourly Simple Moving Average. On the upside, the price seems to be facing hurdles near the $1,850 level. The next key resistance is near the $1,865 level and the 50% Fib retracement level of the downward move from the $1,955 swing high to the $1,781 low.

The first major resistance is near the $1,920 level. A clear move above the $1,920 resistance might send the price toward the $1,950 resistance. An upside break above the $1,950 resistance might call for more gains in the coming sessions. In the stated case, Ether could rise toward the $2,000 resistance zone or even $2,050 in the near term.
Another Decline In ETH?
If Ethereum fails to clear the $1,865 resistance, it could start another decline. Initial support on the downside is near the $1,800 level. The first major support sits near the $1,780 zone.
A clear move below the $1,780 support might push the price toward the $1,720 support. Any more losses might send the price toward the $1,680 support level in the near term. The next key support sits at $1,620.
Technical Indicators
Hourly MACD – The MACD for ETH/USD is gaining momentum in the bearish zone.
Hourly RSI – The RSI for ETH/USD is now below the 50 zone.
Major Support Level – $1,780
Major Resistance Level – $1,865
Cardano price started a recovery wave above the $0.680 zone but failed. ADA is consolidating near $0.650 and remains at risk of more losses.
- ADA price failed to recover above the $0.70 resistance zone.
- The price is trading below $0.680 and the 100-hourly simple moving average.
- There was a break below a connecting bullish trend line with support at $0.6720 on the hourly chart of the ADA/USD pair (data source from Kraken).
- The pair could start another increase if it clears the $0.70 resistance zone.
Cardano Price Dips Again
In the past few days, Cardano saw a recovery wave from the $0.6350 zone, like Bitcoin and Ethereum. ADA was able to climb above the $0.680 and $0.6880 resistance levels.
However, the bears were active above the $0.70 zone. A high was formed at $0.7090 and the price corrected most gains. There was a move below the $0.650 level. Besides, there was a break below a connecting bullish trend line with support at $0.6720 on the hourly chart of the ADA/USD pair.
A low was formed at $0.6356 and the price is now consolidating losses near the 23.6% Fib retracement level of the recent decline from the $0.7090 swing high to the $0.6356 low. Cardano price is now trading below $0.680 and the 100-hourly simple moving average.
On the upside, the price might face resistance near the $0.6720 zone or the 50% Fib retracement level of the recent decline from the $0.7090 swing high to the $0.6356 low. The first resistance is near $0.6950. The next key resistance might be $0.700.

If there is a close above the $0.70 resistance, the price could start a strong rally. In the stated case, the price could rise toward the $0.7420 region. Any more gains might call for a move toward $0.7650 in the near term.
Another Drop in ADA?
If Cardano’s price fails to climb above the $0.6720 resistance level, it could start another decline. Immediate support on the downside is near the $0.6420 level.
The next major support is near the $0.6350 level. A downside break below the $0.6350 level could open the doors for a test of $0.620. The next major support is near the $0.60 level where the bulls might emerge.
Technical Indicators
Hourly MACD – The MACD for ADA/USD is losing momentum in the bearish zone.
Hourly RSI (Relative Strength Index) – The RSI for ADA/USD is now below the 50 level.
Major Support Levels – $0.6420 and $0.6350.
Major Resistance Levels – $0.6720 and $0.7000.
Aayush Jindal, a luminary in the world of financial markets, whose expertise spans over 15 illustrious years in the realms of Forex and cryptocurrency trading. Renowned for his unparalleled proficiency in providing technical analysis, Aayush is a trusted advisor and senior market expert to investors worldwide, guiding them through the intricate landscapes of modern finance with his keen insights and astute chart analysis.
From a young age, Aayush exhibited a natural aptitude for deciphering complex systems and unraveling patterns. Fueled by an insatiable curiosity for understanding market dynamics, he embarked on a journey that would lead him to become one of the foremost authorities in the fields of Forex and crypto trading. With a meticulous eye for detail and an unwavering commitment to excellence, Aayush honed his craft over the years, mastering the art of technical analysis and chart interpretation.
As a software engineer, Aayush harnesses the power of technology to optimize trading strategies and develop innovative solutions for navigating the volatile waters of financial markets. His background in software engineering has equipped him with a unique skill set, enabling him to leverage cutting-edge tools and algorithms to gain a competitive edge in an ever-evolving landscape.
In addition to his roles in finance and technology, Aayush serves as the director of a prestigious IT company, where he spearheads initiatives aimed at driving digital innovation and transformation. Under his visionary leadership, the company has flourished, cementing its position as a leader in the tech industry and paving the way for groundbreaking advancements in software development and IT solutions.
Despite his demanding professional commitments, Aayush is a firm believer in the importance of work-life balance. An avid traveler and adventurer, he finds solace in exploring new destinations, immersing himself in different cultures, and forging lasting memories along the way. Whether he’s trekking through the Himalayas, diving in the azure waters of the Maldives, or experiencing the vibrant energy of bustling metropolises, Aayush embraces every opportunity to broaden his horizons and create unforgettable experiences.
Aayush’s journey to success is marked by a relentless pursuit of excellence and a steadfast commitment to continuous learning and growth. His academic achievements are a testament to his dedication and passion for excellence, having completed his software engineering with honors and excelling in every department.
At his core, Aayush is driven by a profound passion for analyzing markets and uncovering profitable opportunities amidst volatility. Whether he’s poring over price charts, identifying key support and resistance levels, or providing insightful analysis to his clients and followers, Aayush’s unwavering dedication to his craft sets him apart as a true industry leader and a beacon of inspiration to aspiring traders around the globe.
In a world where uncertainty reigns supreme, Aayush Jindal stands as a guiding light, illuminating the path to financial success with his unparalleled expertise, unwavering integrity, and boundless enthusiasm for the markets.

US Dollar Index Drops – What Does It Mean for Bitcoin?

Ethereum Price Recovery Stalls—Bears Keep Price Below $2K

Cardano (ADA) Downtrend Deepens—Is a Rebound Possible?

Analyst Forecasts 250% Dogecoin Price Rally If This Level Holds

XRP Price Under Pressure—New Lows Signal More Trouble Ahead

Bitcoin Price Swings Wildly—Yet Bears Keep the Upper Hand!

2.52 Million Altcoins Are Ruining Crypto’s Future

Animoca Brands Valuation Tanks 75% In Two Years, Here’s Why

Crypto exchange BingX hacked for $43 million

Are The Big Players Losing Interest?

Hong Kong’s Securities Association Tips Authorities On Crypto Self-Regulation

Coinbase cbBTC Set to go Live on Solana
2.52 Million Altcoins Are Ruining Crypto’s Future
Animoca Brands Valuation Tanks 75% In Two Years, Here’s Why
Crypto exchange BingX hacked for $43 million
Are The Big Players Losing Interest?
Hong Kong’s Securities Association Tips Authorities On Crypto Self-Regulation
Coinbase cbBTC Set to go Live on Solana
-

 Market23 hours ago
BNB Price Faces More Downside—Can Bulls Step In?
-

 Regulation18 hours ago
Kraken Obtains Restricted Dealer Registration in Canada
-

 Bitcoin24 hours ago
Tokenized Gold Market Cap Tops $1.2 Billion as Gold Prices Surge
-

 Bitcoin19 hours ago
Lummis Confirms Treasury Probes Direct Buys
-
 Altcoin14 hours ago
Here’s Why This Analyst Believes XRP Price Could Surge 44x
-
 Altcoin22 hours ago
What’s Fueling The Shibarium Boost?
-
 Altcoin13 hours ago
How Will Elon Musk Leaving DOGE Impact Dogecoin Price?
-
 Altcoin10 hours ago
First Digital Trust Denies Justin Sun’s Allegations, Claims Full Solvency