
Market
3 Key Causes of Crypto Theft Identified by SlowMist
SlowMist, a leading blockchain security firm, released its 2024 Q2 MistTrack Stolen Funds Analysis report, looking closely at cryptocurrency thefts in the second quarter of 2024.
Based on 467 reports of stolen funds, the firm revealed three key weaknesses led to cryptocurrency theft and explained the methods that users can utilize to protect their funds.
Private Key Leaks Top the List
According to SlowMist, the second quarter of 2024 saw a troubling increase in security incidents. During this time, users reported 467 cases of stolen funds, including 321 from Chinese sources and 146 from other countries.
The platform’s team helped 18 victims lock nearly $20.66 million worth of funds across 13 companies. Additionally, the firm discussed the main causes of these incidents.
The most common cause of crypto theft is the mishandling of private keys. Despite warnings, many people store their private keys in Google Drive and other cloud services. Some even send this data to friends through social networks and messengers. Hackers use credential stuffing attacks to log into these cloud services and steal private keys.
Read more: 15 Most Common Crypto Scams To Look Out For
Another common cause of private key leaks is fake wallets. These apps often replicate legitimate software exactly, tricking users into entering private keys and directly transmitting them to attackers.
“Despite being an old issue, many users still inadvertently click on ads while using search engines and download fake wallet apps. Many users choose to download applications from third-party sites due to network reasons. Although these sites claim that their apps are mirrored from Google Play, their actual security is questionable,” read the report.
Phishing also remains a major cause of theft in the crypto industry. According to SlowMist, about 80% of the first comments under tweets from prominent project accounts are occupied by scam accounts.
Read more: Crypto Social Media Scams: How to Stay Safe
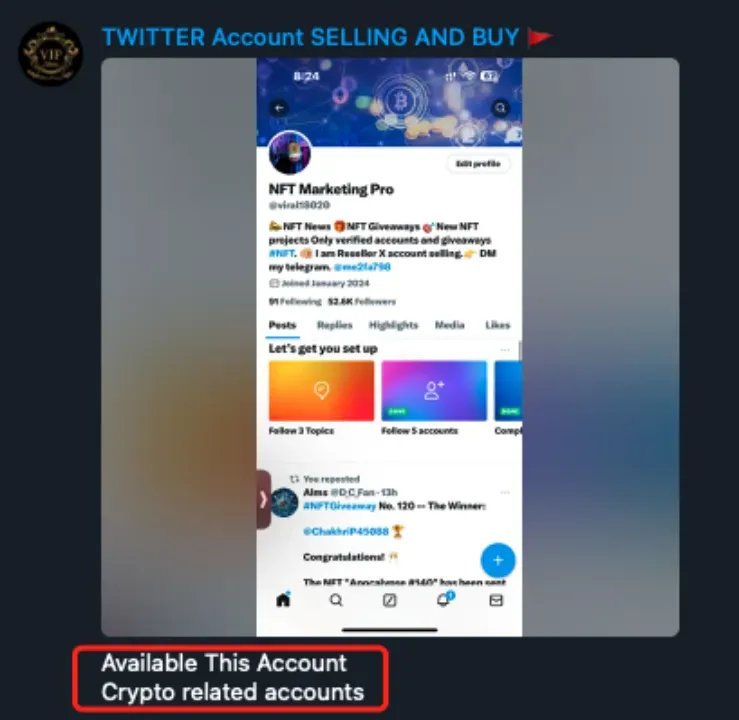
Fake X (formerly Twitter) accounts that spam under posts are sold in various Telegram feeds. Attackers can select profiles based on the number of followers and registration date. Most of the pages being sold are related to the crypto industry and crypto influencers. Experts also noted that some websites sell fake X accounts.
“For example, a fake account named ‘Optimlzm’ can look almost identical to the real account ‘Optimism’. After purchasing the highly similar account, phishing groups use promotion tools to boost the account’s interactions and follower count, thereby increasing its credibility,” SlowMist experts noted.
Honeypot Promises Mislead Crypto Users
The third threat identified by SlowMist is the honeypot scam. In this scheme, fraudsters create tokens that seem promising and offer high returns, but these tokens are programmed to be unsellable. This type of scam is particularly rampant on decentralized exchanges like PancakeSwap.
“I asked a question in a Telegram group, and someone enthusiastically answered and taught me a lot. They suggested I invest in a new token in the primary market and provided me with a contract address on PancakeSwap. After I bought it, the token’s value kept rising. They told me it was a once-in-six-months golden opportunity and urged me to invest more. When I asked others in the group to help investigate, I discovered it was indeed a honeypot token. I could buy but not sell it,” one victim shared with SlowMist.
Read more: Top 9 Safest Crypto Exchanges in 2024
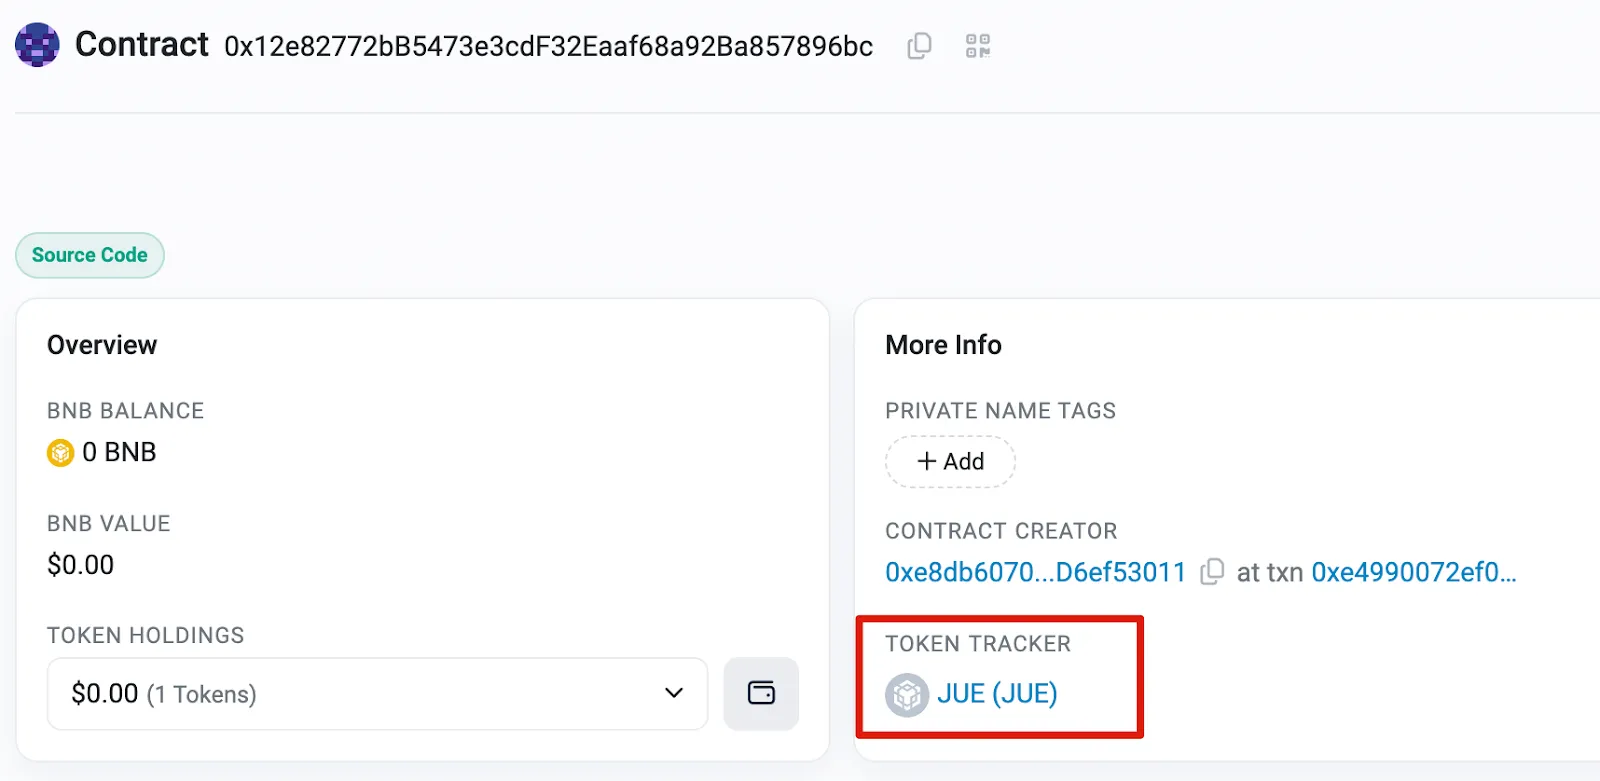
To reduce these risks, SlowMist stresses the need for strong security practices. They recommend using blockchain explorers like Etherscan or BscScan, which offer insights through audit trails and user comments, and browser extensions like Scam Sniffer, which can detect and alert users about potential phishing sites.
The findings of this report highlight the ongoing vulnerabilities and underline the need for proactive security measures by all participants of the ecosystem.
Disclaimer
In adherence to the Trust Project guidelines, BeInCrypto is committed to unbiased, transparent reporting. This news article aims to provide accurate, timely information. However, readers are advised to verify facts independently and consult with a professional before making any decisions based on this content. Please note that our Terms and Conditions, Privacy Policy, and Disclaimers have been updated.


Cardano (ADA) is facing mounting pressure as its price corrects by 10% over the past seven days, continuing a broader downtrend that has kept it trading below the $1 mark for nearly a month. With technical indicators flashing warning signs and large holders exiting their positions, concerns around ADA’s short-term stability are growing.
The recent rejection at higher resistance levels and a strong directional trend signal suggest that bearish momentum is far from over. As the $0.64 support level is tested once again, ADA’s next move could determine whether a rebound is possible—or if further downside is ahead.
Cardano ADX Shows The Downtrend Is Very Strong
Cardano’s Average Directional Index (ADX) is currently at 40.19, rising sharply from 15.83 just four days ago. This steep increase suggests a rapid strengthening in the trend’s momentum.
Given that ADA is currently in a downtrend, the rising ADX indicates that bearish momentum is intensifying and the current downward move is gaining traction.
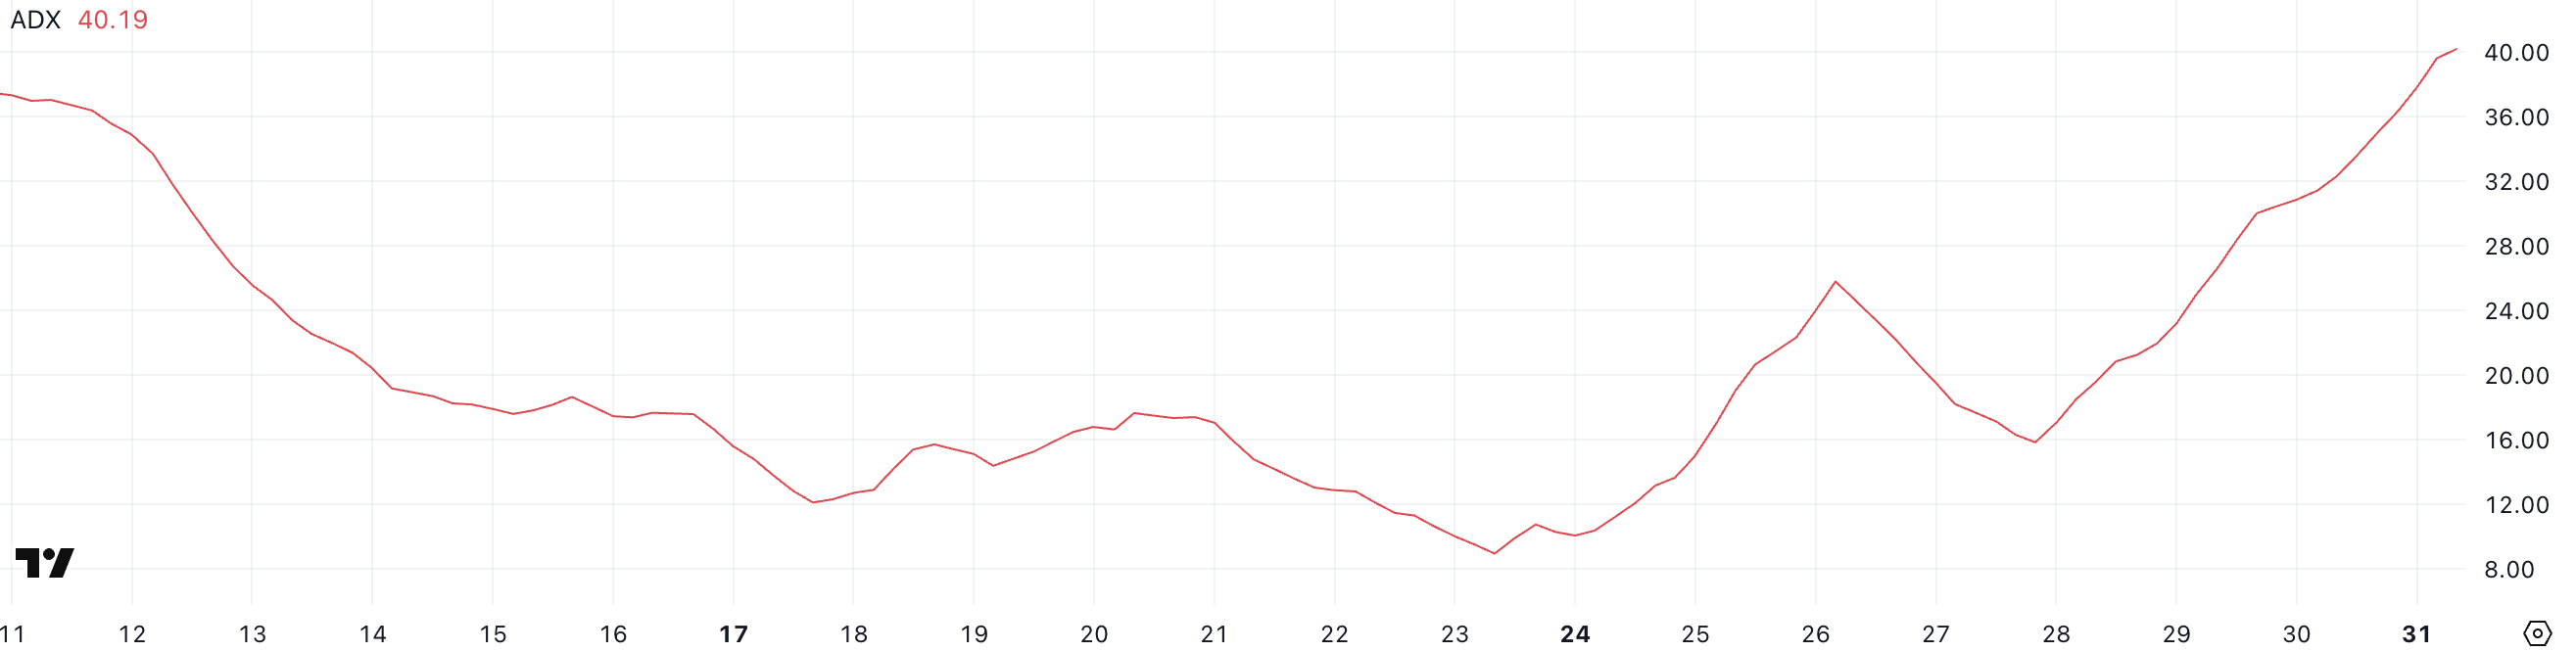
The ADX is a trend strength indicator that measures how strong a trend is, regardless of its direction. It ranges from 0 to 100, with readings below 20 typically indicating a weak or non-existent trend, while values above 25 suggest a strong trend is in place.
Cardano’s ADX climbing above 40 confirms that the current downtrend is active and becoming stronger. If this trend continues, it may point to further downside pressure unless a shift in momentum begins to build from the bulls.
ADA Whales Dropped To Their Lowest Level Since February 2023
The number of Cardano whales—wallets holding between 1 million and 10 million ADA—has dropped to 2,406, down from 2,421 just four days ago.
This decline brings the whale count to its lowest level since February 2023, marking a potentially meaningful shift in large-holder behavior. These movements are worth paying attention to, as changes in whale holdings often precede broader market trends.
Tracking whales is important because these large holders can significantly influence price action through their buying or selling decisions. A decline in whale numbers can signal reduced confidence or capital rotation into other assets.
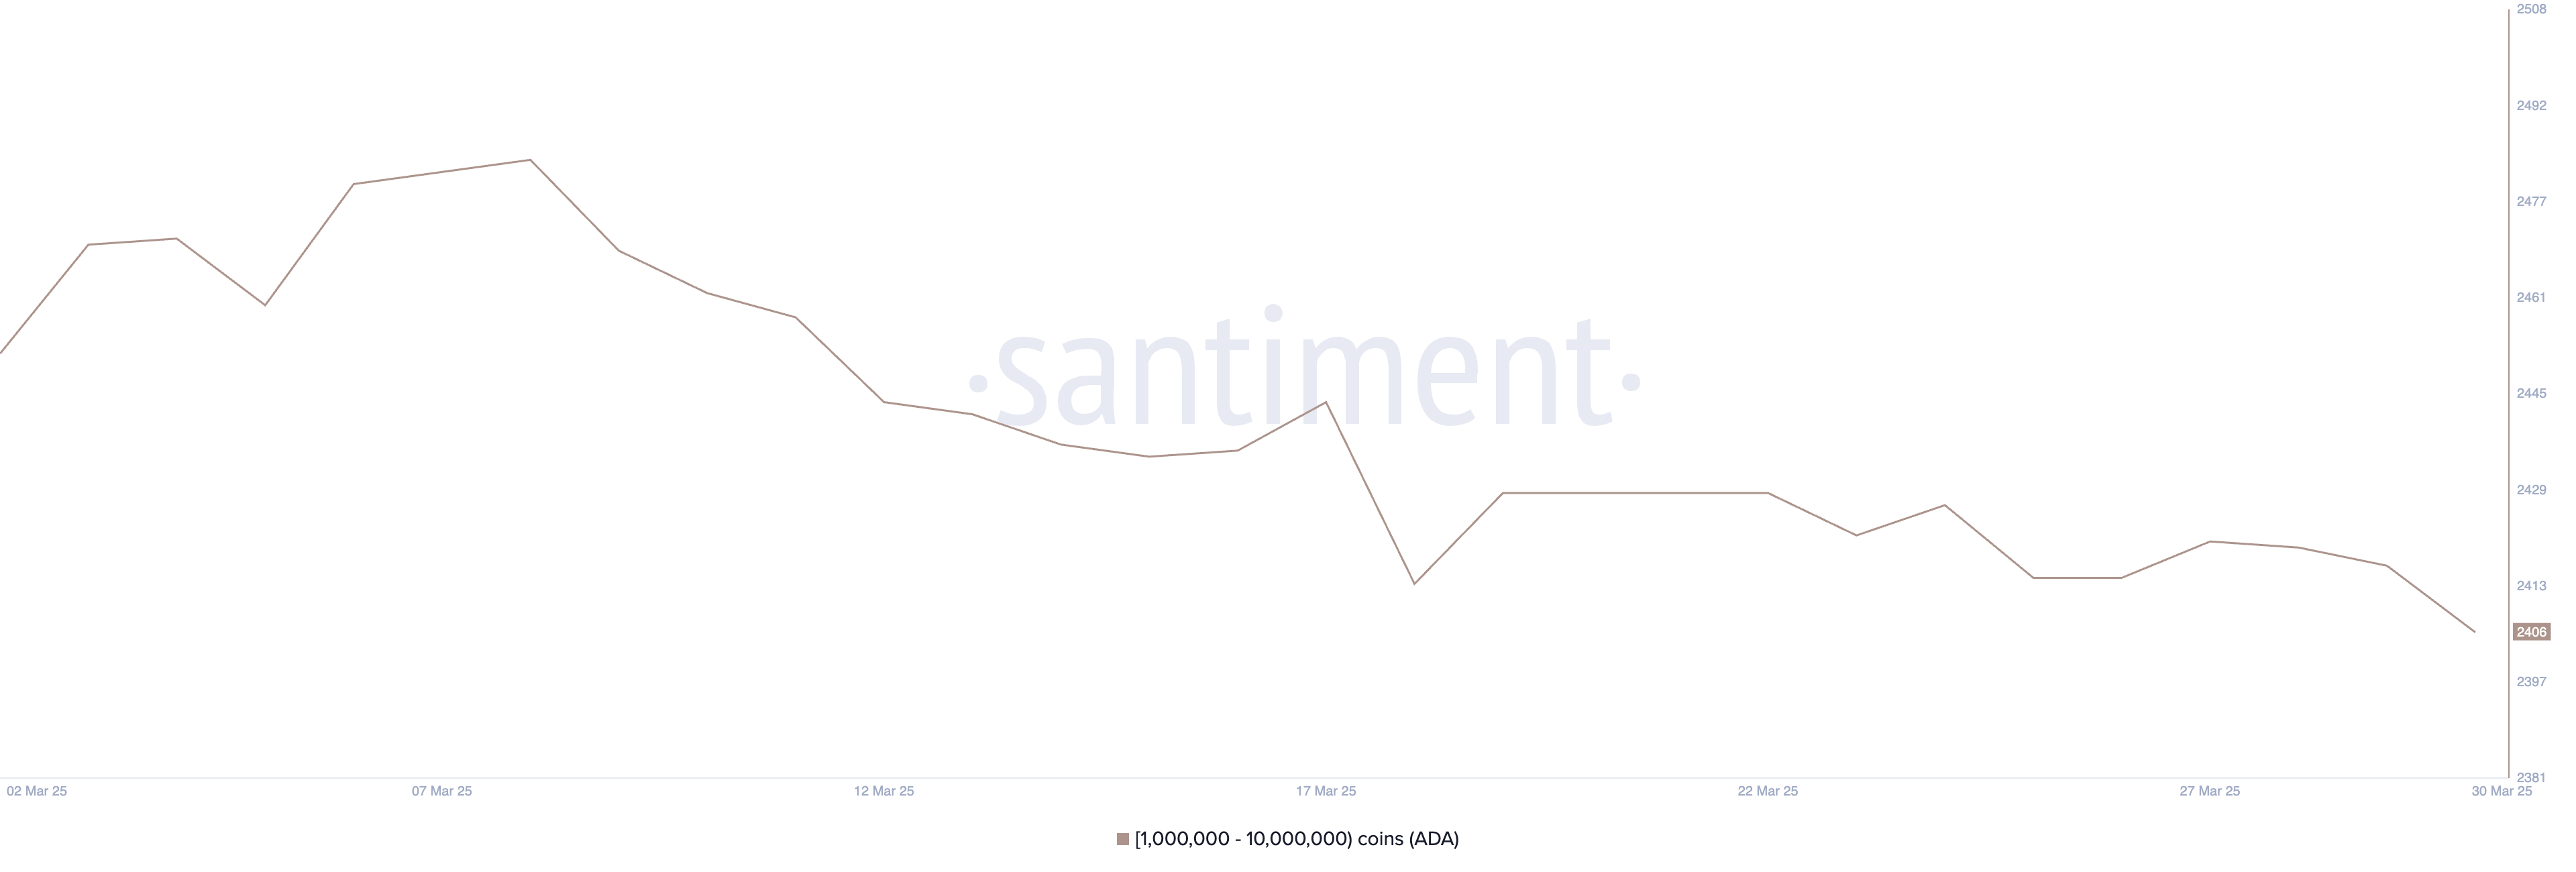
In Cardano’s case, the drop suggests that some major players may be exiting or reducing exposure, which could add downward pressure to ADA’s price.
If this trend continues, it could weaken investor sentiment and make it harder for ADA to recover in the short term.
Can Cardano Sustain The $0.64 Support Again?
Cardano price recently tested the support level at $0.64 and managed to hold, showing that buyers are still defending that zone. This support has become a key line in the sand for ADA’s short-term outlook.
If the current downtrend is reversed and bullish momentum picks up, the next upside target would be the resistance at $0.69. A breakout above that level could open the door for a push toward $0.77.
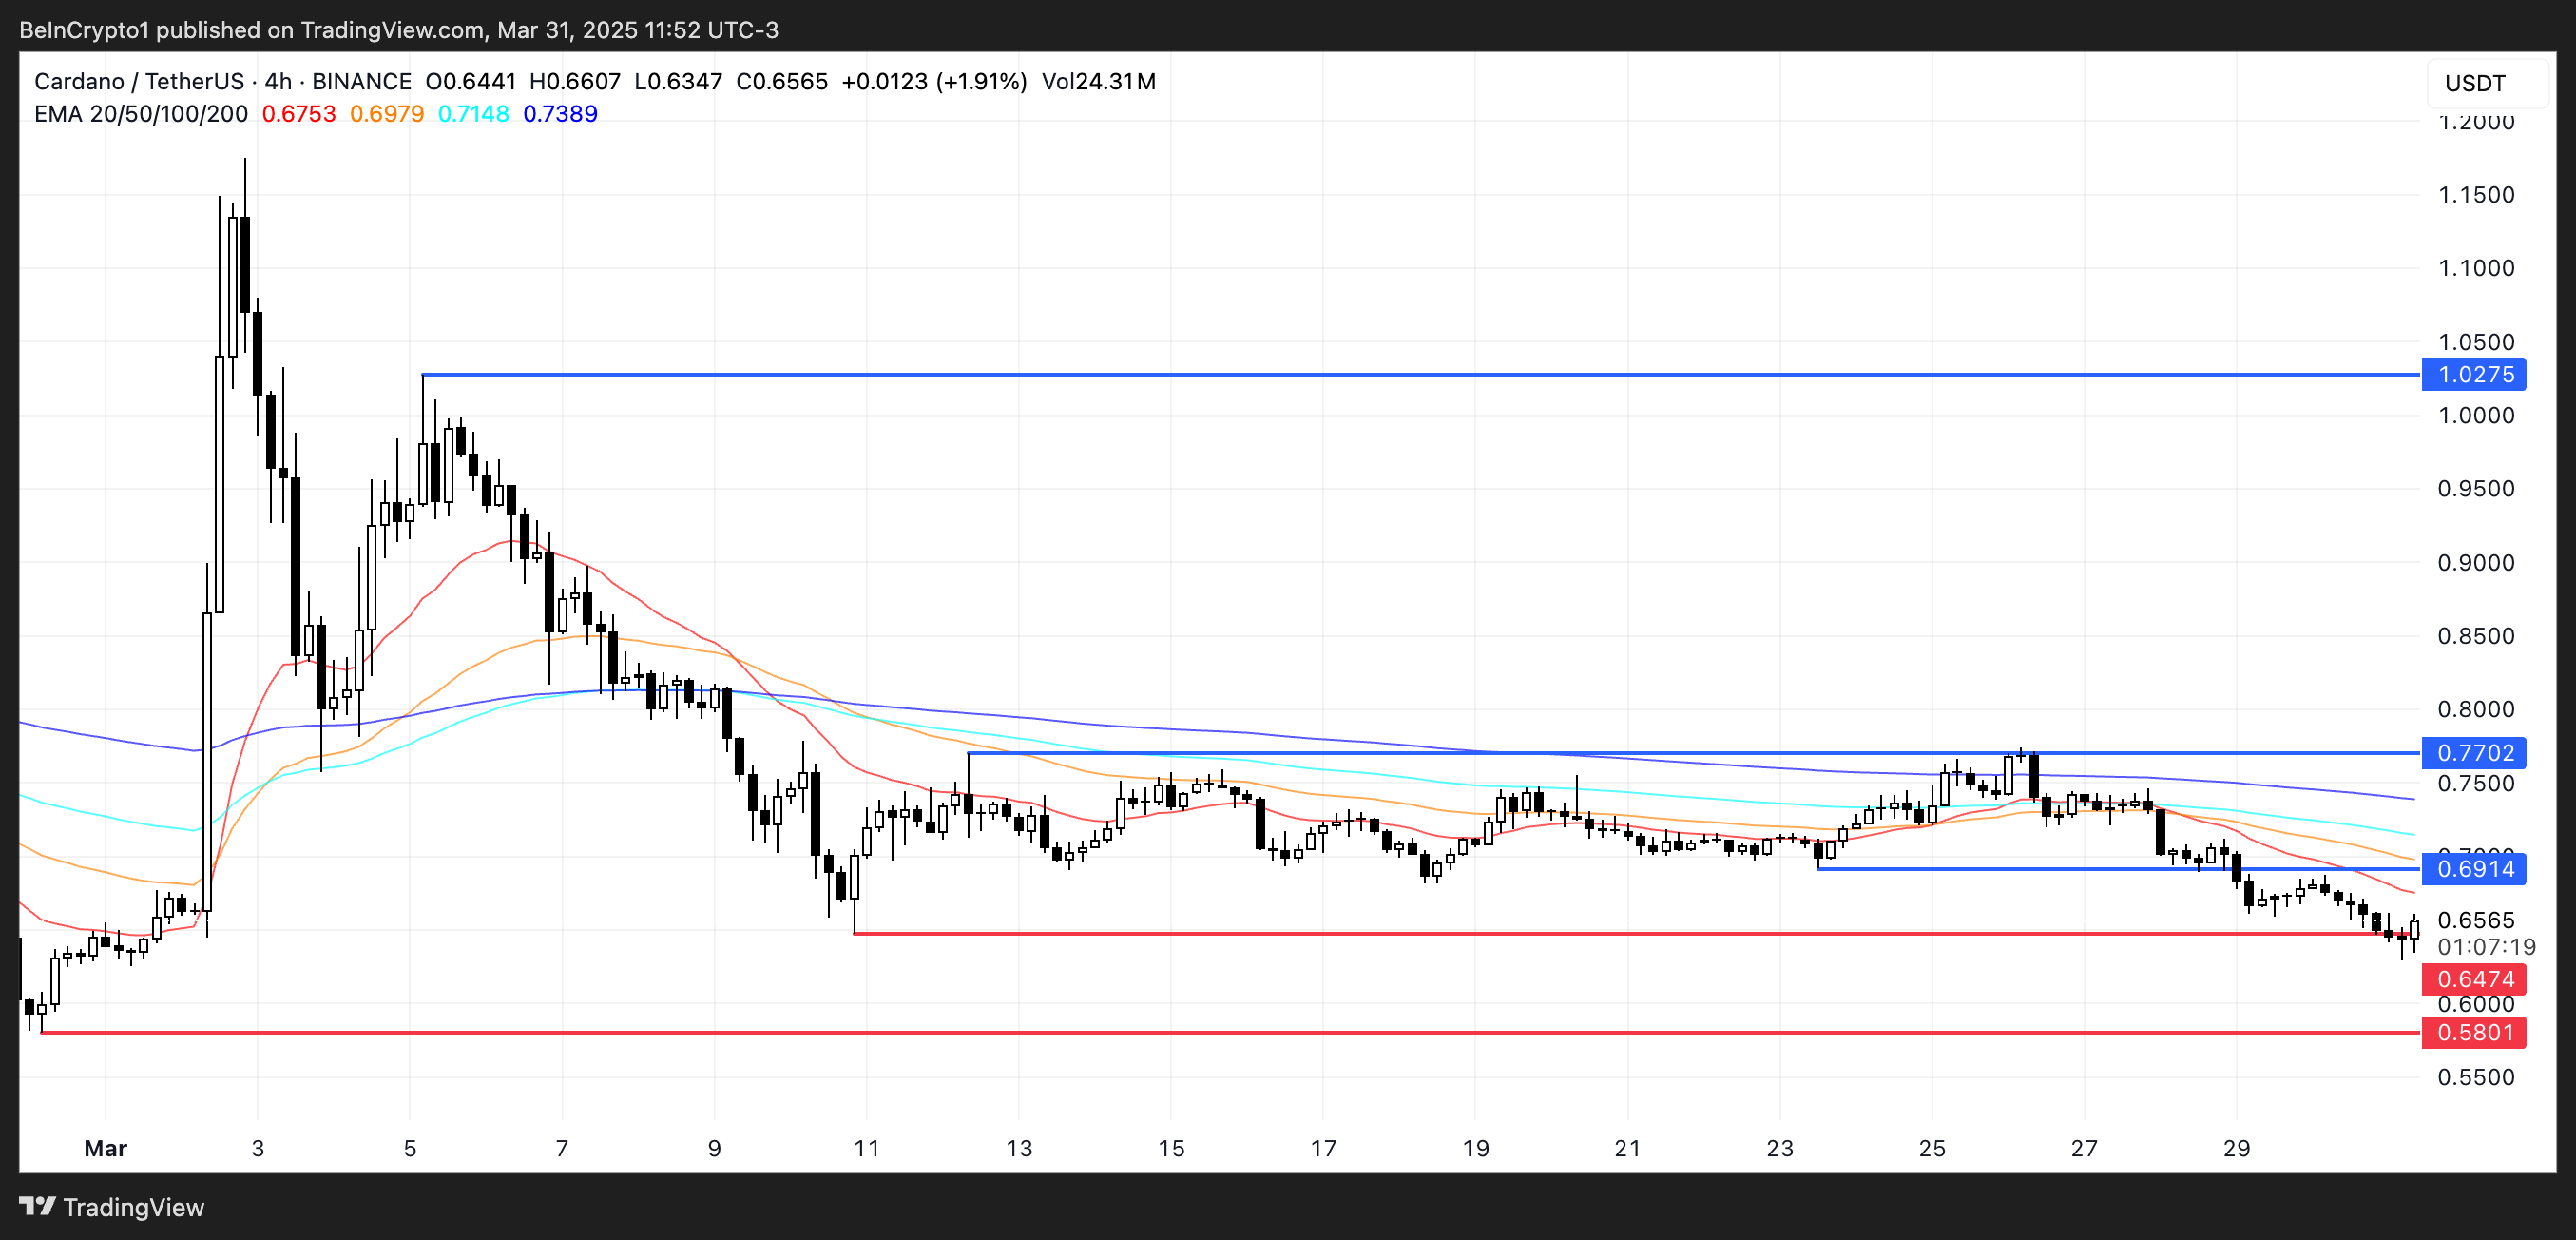
Should the rally continue with strength, ADA could aim for $1.02—marking a return above the $1 level for the first time since early March.
However, the $0.64 support remains a critical level to watch. If Cardano tests it again and fails to hold, it could indicate weakening buyer conviction.
A breakdown below $0.64 would likely send ADA toward the next support at $0.58. This would confirm a continuation of the downtrend and possibly trigger further selling pressure.
Disclaimer
In line with the Trust Project guidelines, this price analysis article is for informational purposes only and should not be considered financial or investment advice. BeInCrypto is committed to accurate, unbiased reporting, but market conditions are subject to change without notice. Always conduct your own research and consult with a professional before making any financial decisions. Please note that our Terms and Conditions, Privacy Policy, and Disclaimers have been updated.

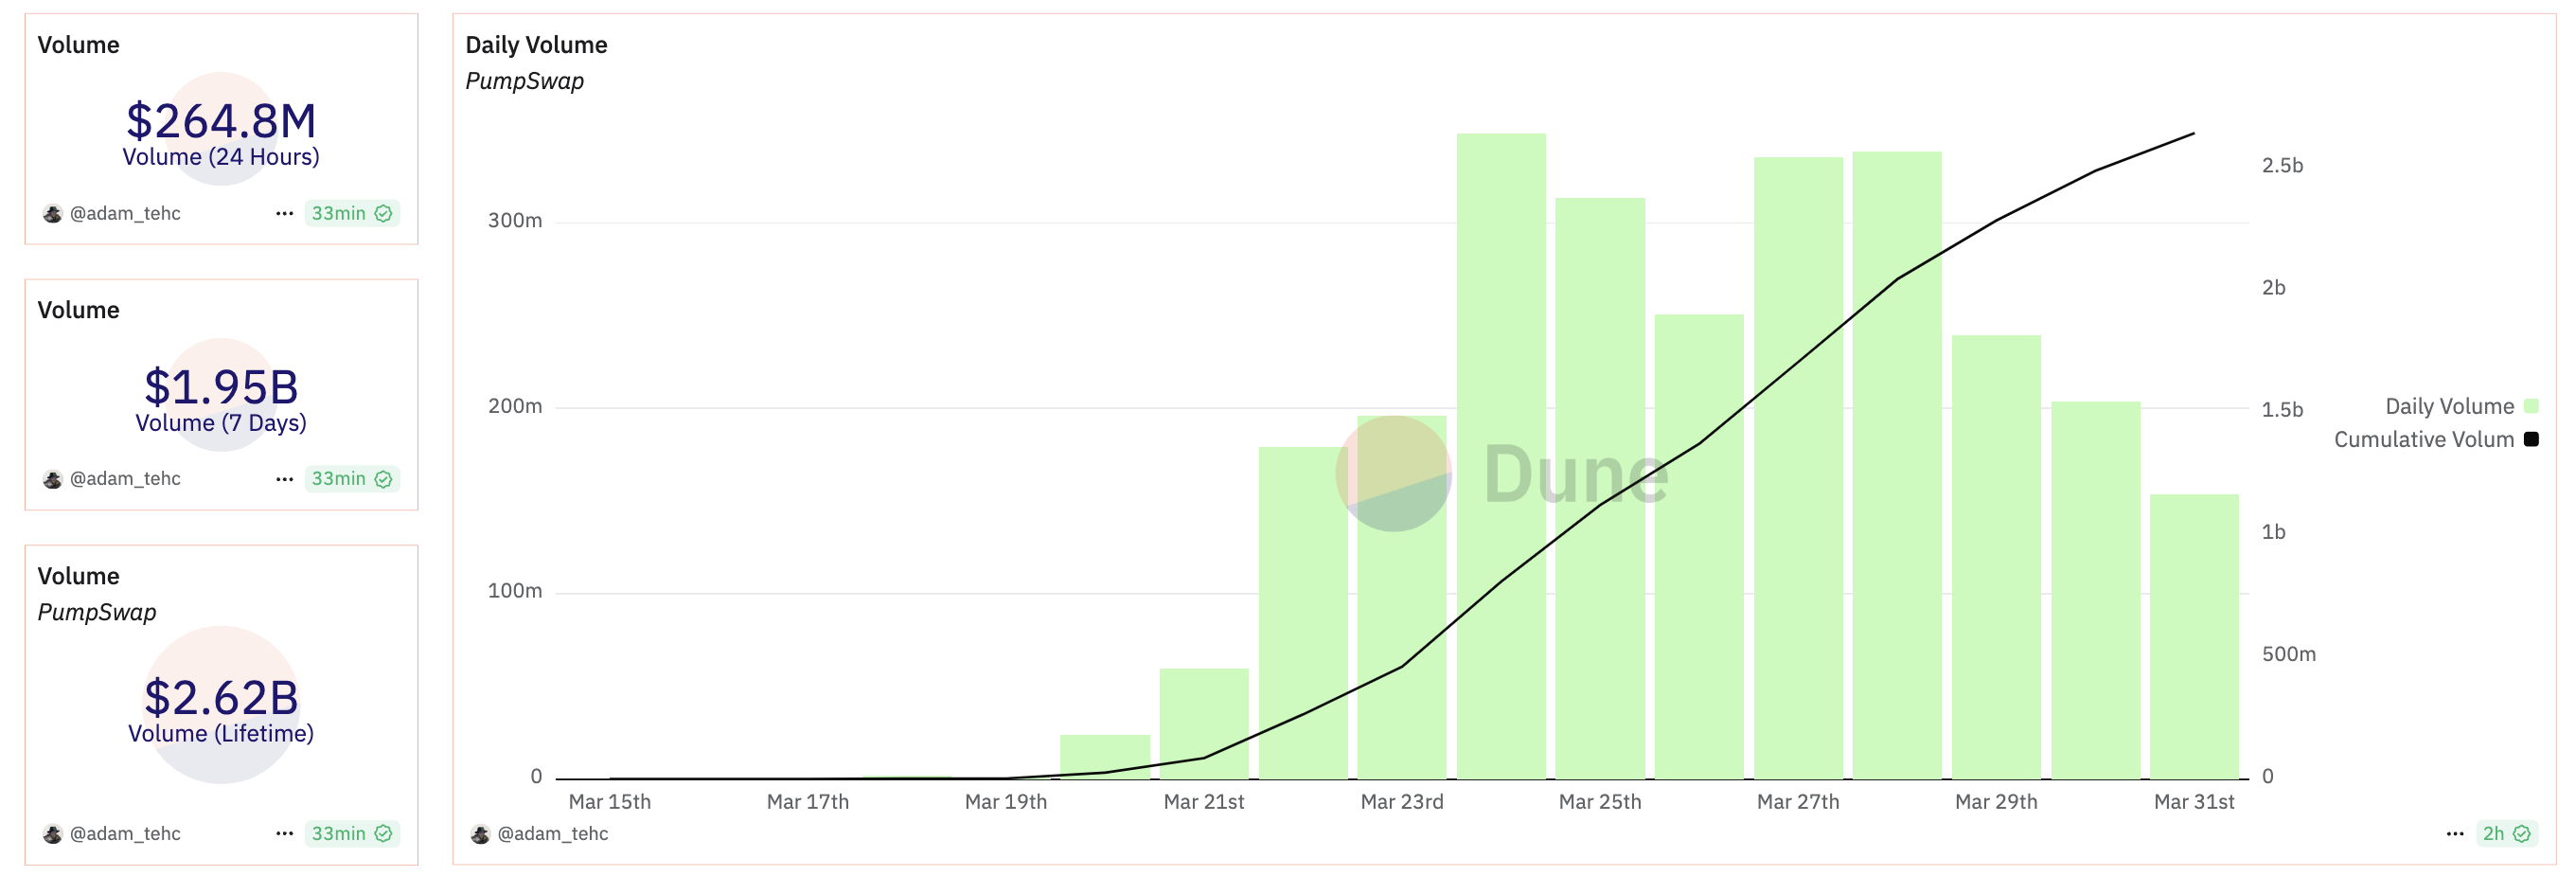
Since launching PumpSwap, token launchpad Pump.fun has resumed its position as a top-level protocol by fees and revenue. It saw over $2.62 billion in volume in less than two weeks, signifying high market interest.
Nonetheless, the meme coin sector as a whole has been more volatile than usual lately. PumpSwap is an attractive new option, but it still needs to stand the test of time.
Pump.fun Surges with PumpSwap
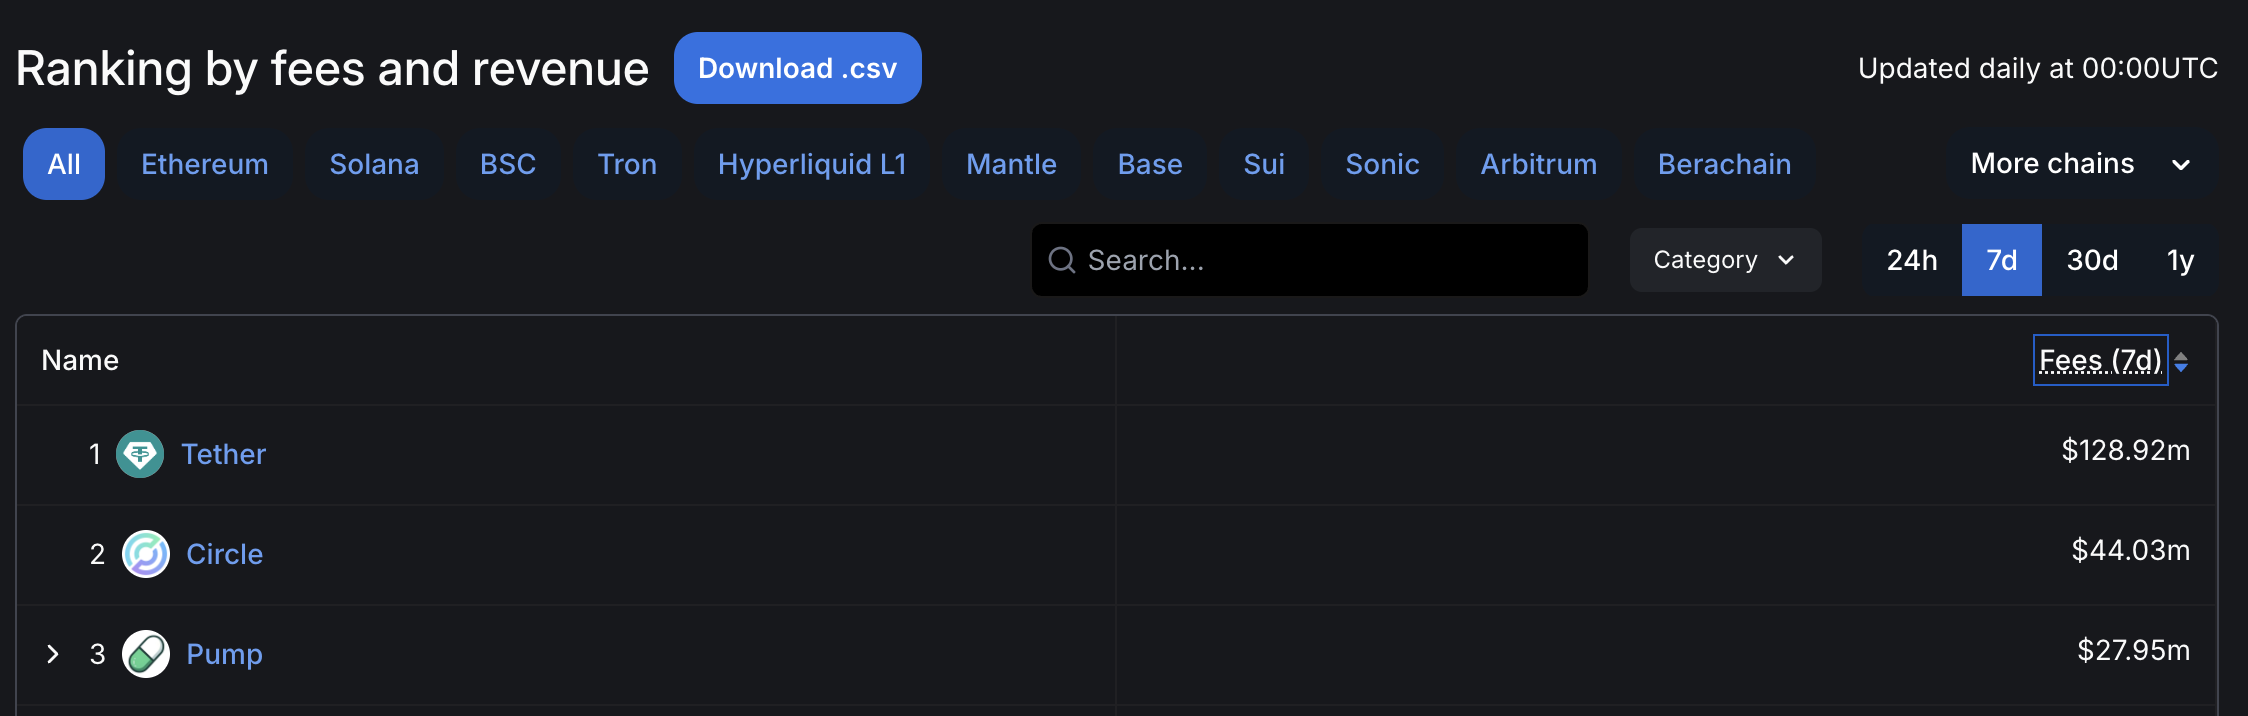
Pump.fun, a prominent meme coin creation platform, recently suffered some difficulties in the market. Facing lawsuits and criticism from the industry, the platform’s revenue had been declining in 2025. However, since launching PumpSwap, Pump.fun’s income has rebounded, making it one of the largest protocols by fees and revenue.
PumpSwap is a decentralized exchange on Solana’s blockchain, and it has grown very quickly since its launch less than two weeks ago. It has already managed over $2.62 billion in trade volume, although its daily volume fell over the weekend. Pump.fun’s cofounder spoke highly about PumpSwap, calling it a “crucial step that will help grow the ecosystem.”
Pump.fun’s overall revenues were declining before it launched PumpSwap, and they have since jumped back up. However, it’s important to not overstate the new exchange’s success. The exchange’s total fees collected have skyrocketed compared to Pump.fun, but the actual revenue growth has been comparatively small.
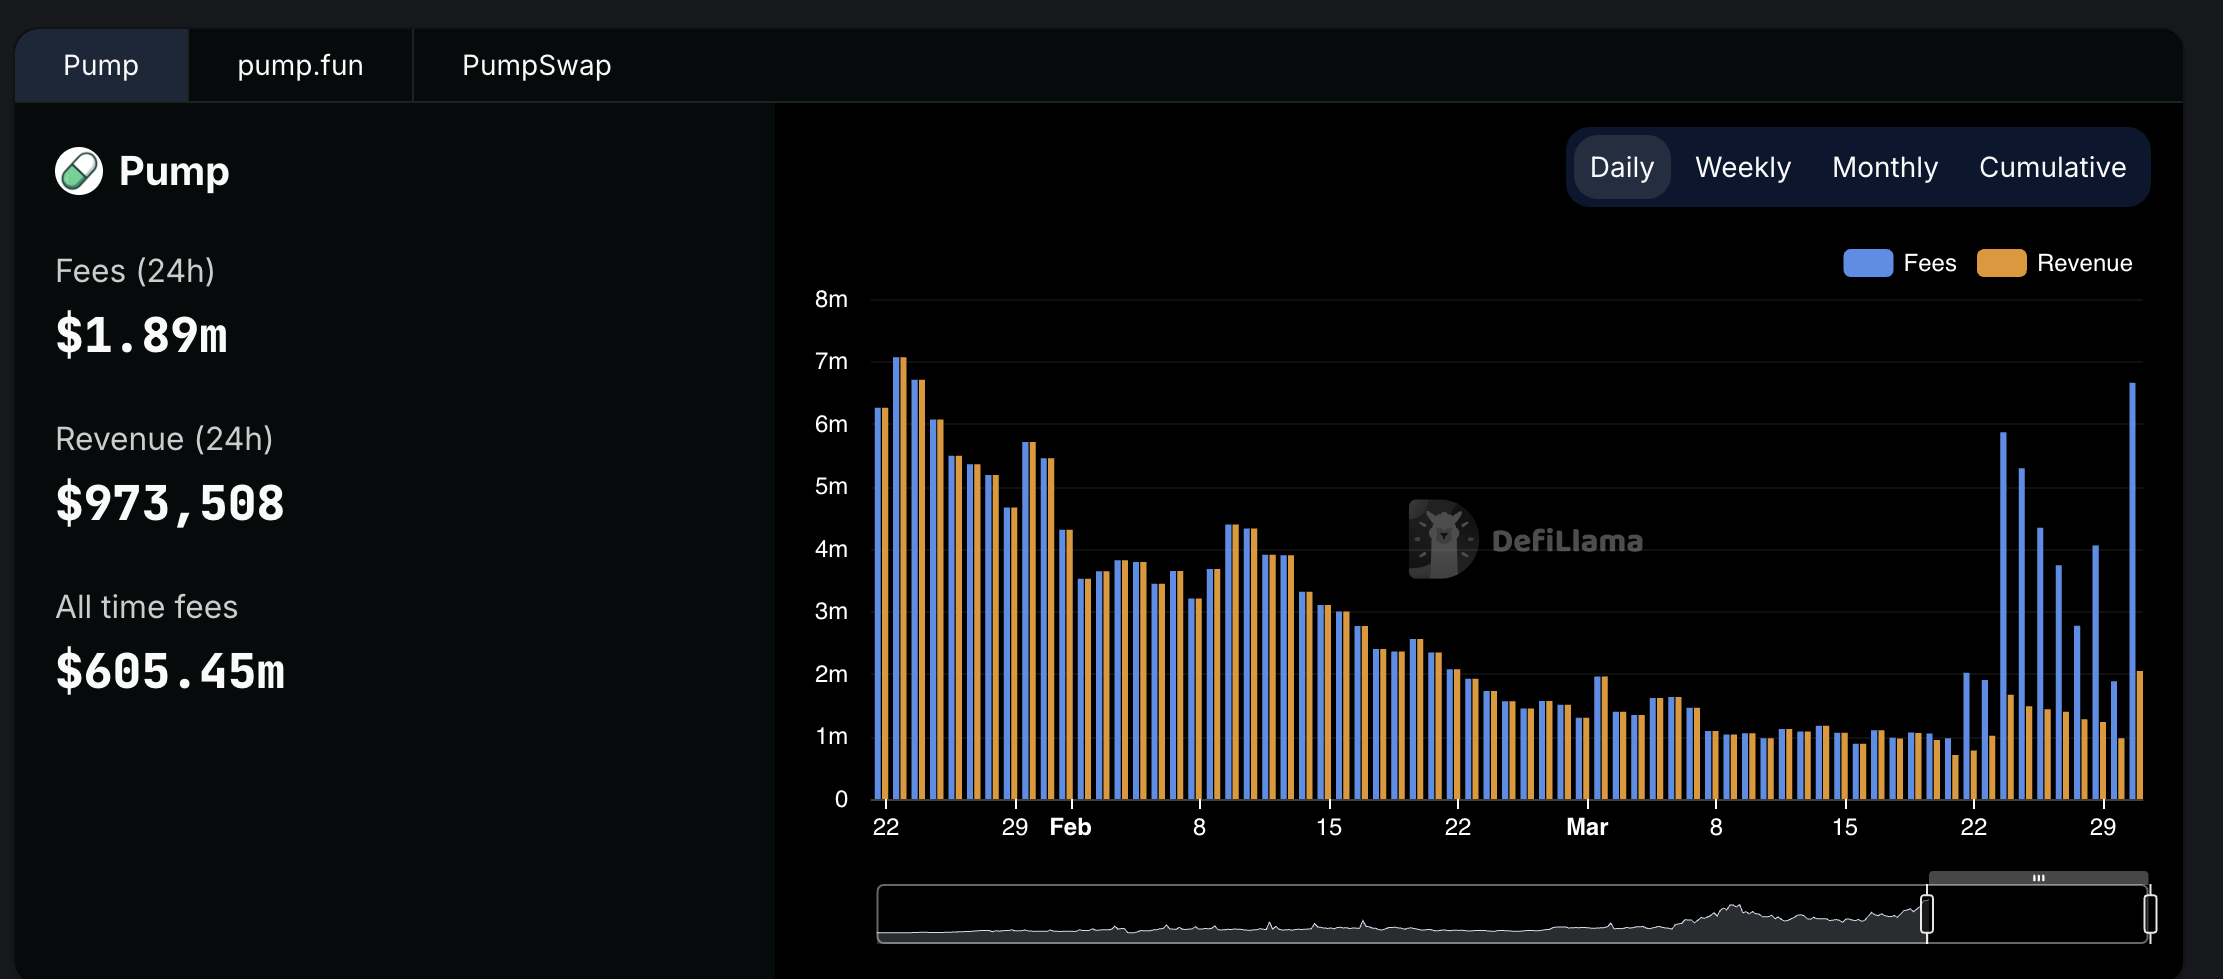
Still, these low fees also have significant advantages. Demand seems to be drying up in the meme coin sector, but Pump.fun faces stiff competition in the form of firms like Raydium, using low fees as a competitive edge. It has also promised things like revenue sharing with token creators to promote ecosystem growth.
Ultimately, the meme coin market as a whole is full of uncertainty. PumpSwap has been able to keep Pump.fun competitive as a top-level platform in this space, giving it a welcome reprieve. The real challenge will come in determining long-term viability.
Disclaimer
In adherence to the Trust Project guidelines, BeInCrypto is committed to unbiased, transparent reporting. This news article aims to provide accurate, timely information. However, readers are advised to verify facts independently and consult with a professional before making any decisions based on this content. Please note that our Terms and Conditions, Privacy Policy, and Disclaimers have been updated.

Hedera (HBAR) is under pressure, down roughly 13.5% over the past seven days, with its market cap holding at around $7 billion. Recent technical signals point to growing bearish momentum, with both trend and momentum indicators leaning heavily negative.
The price has been hovering near a critical support zone, raising the risk of a breakdown below $0.15 for the first time in months. Unless bulls regain control soon, HBAR could face further losses before any meaningful recovery attempt.
HBAR BBTrend Has Been Turning Heavily Down Since Yesterday
Hedera’s BBTrend indicator has dropped sharply to -10.1, falling from 2.59 just a day ago. This rapid decline signals a strong shift in momentum and suggests that HBAR is experiencing an aggressive downside move.
Such a steep drop often reflects a sudden increase in selling pressure, which can quickly change the asset’s short-term outlook.
The BBTrend, or Bollinger Band Trend, measures the strength and direction of a trend using the position of price relative to the Bollinger Bands. Positive values generally indicate bullish momentum, while negative values point to bearish momentum.
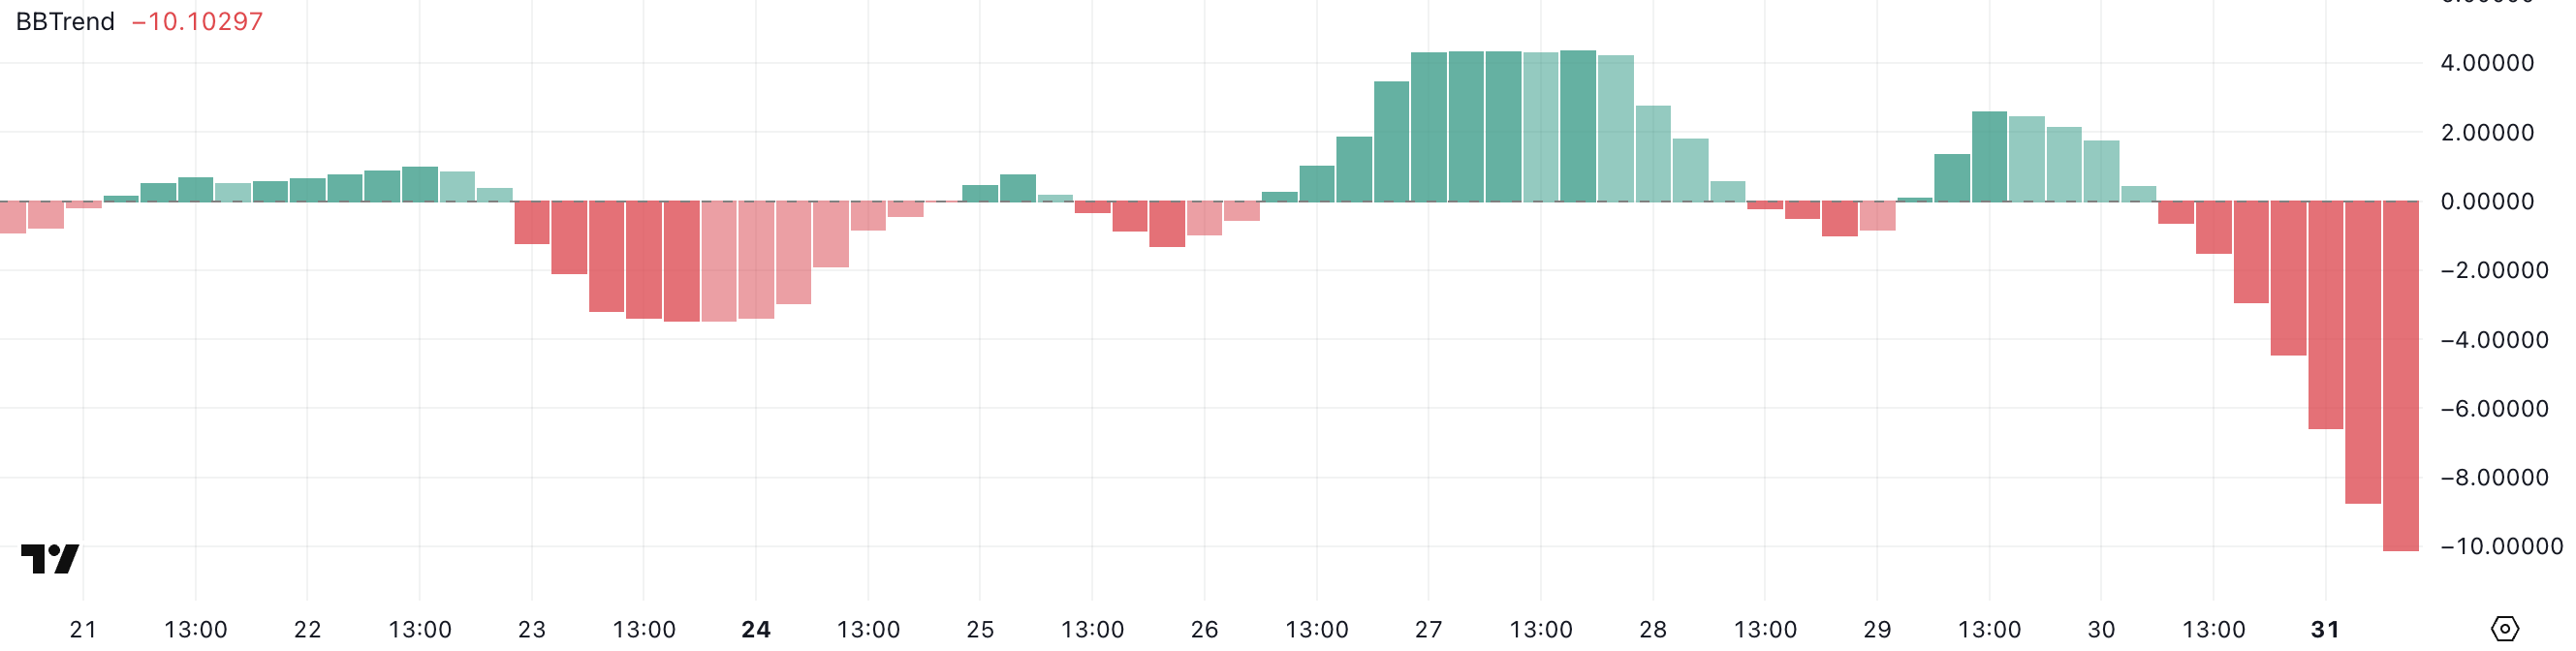
The further the value is from zero, the stronger the trend. HBAR’s BBTrend is now at -10.1, signaling strong bearish momentum.
This suggests that the price is trending lower and doing so with increasing strength, which could lead to further downside unless buyers step in to slow the momentum.
Hedera Ichimoku Cloud Paints a Bearish Picture
Hedera’s Ichimoku Cloud chart reflects a strong bearish structure, with the price action positioned well below both the blue conversion line (Tenkan-sen) and the red baseline (Kijun-sen).
This setup indicates that short-term momentum is clearly aligned with the longer-term downtrend.
The price has consistently failed to break above these dynamic resistance levels, signaling continued seller dominance.
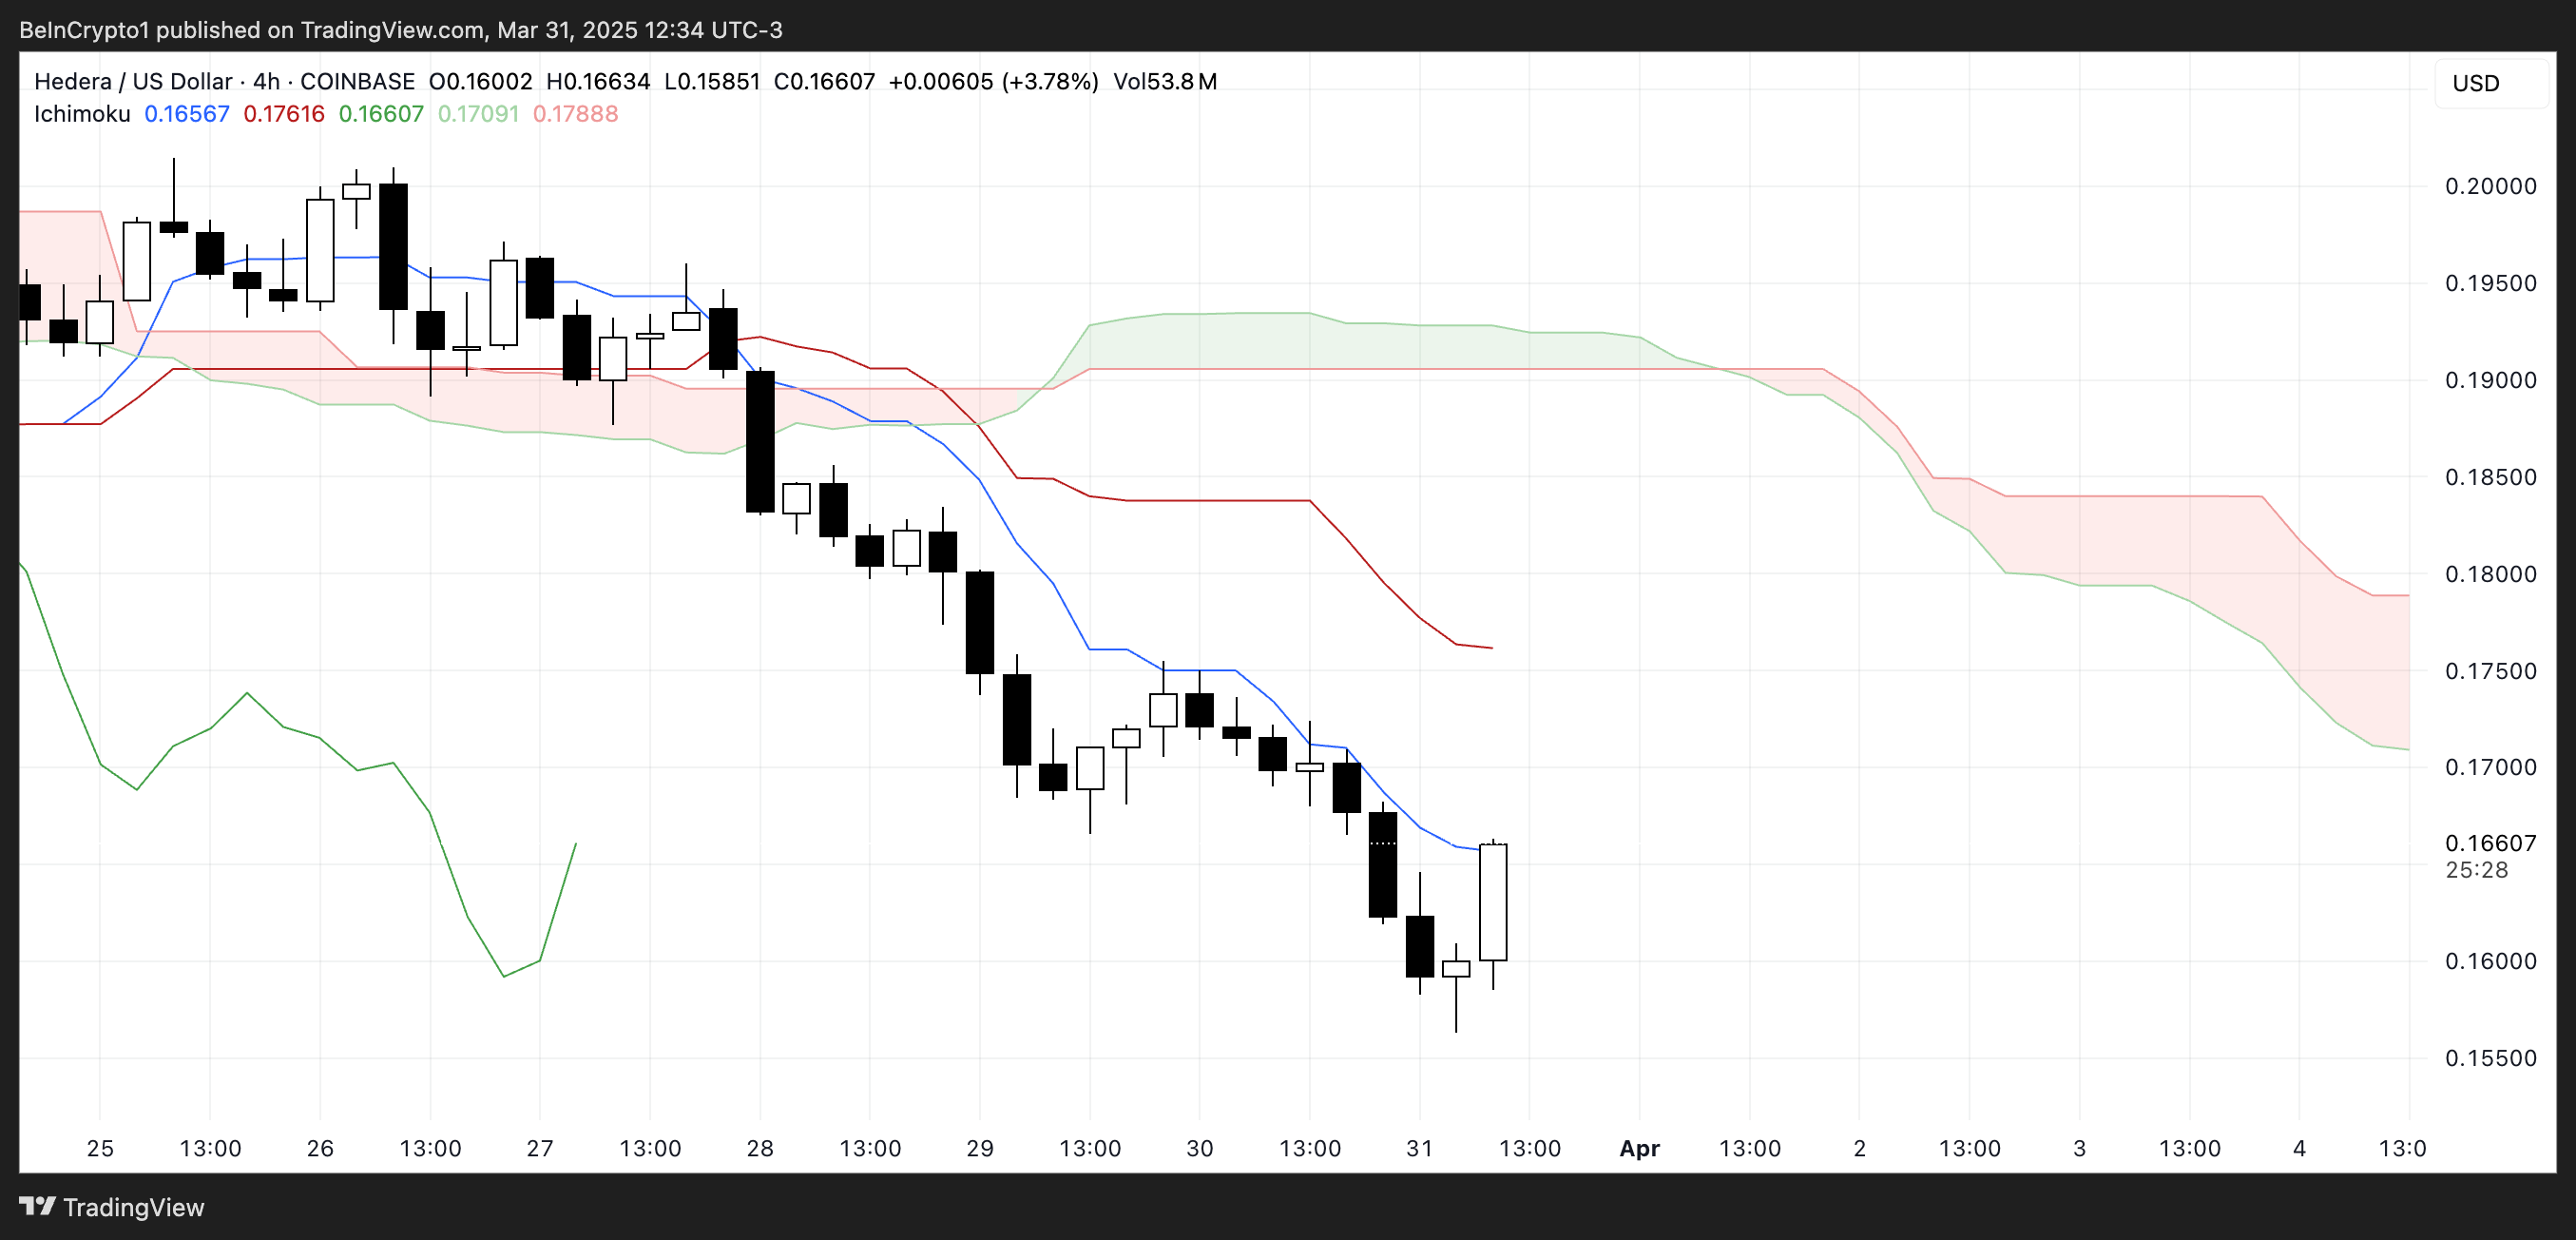
The future cloud is also red and trending downward, suggesting that bearish pressure is expected to persist in the near term.
The span between the Senkou Span A and B lines remains wide, reinforcing the strength of the downtrend. For any potential reversal to gain credibility, HBAR would first need to challenge and break above the Tenkan-sen and Kijun-sen, and eventually push into or above the cloud.
Until then, the current Ichimoku configuration supports a continuation of the bearish outlook.
Can Hedera Fall Below $0.15 Soon?
Hedera price has been hovering around the $0.16 level and is approaching a key support at $0.156.
If this support fails to hold, it could open the door for further downside, potentially pushing HBAR below the $0.15 mark for the first time since November 2024.
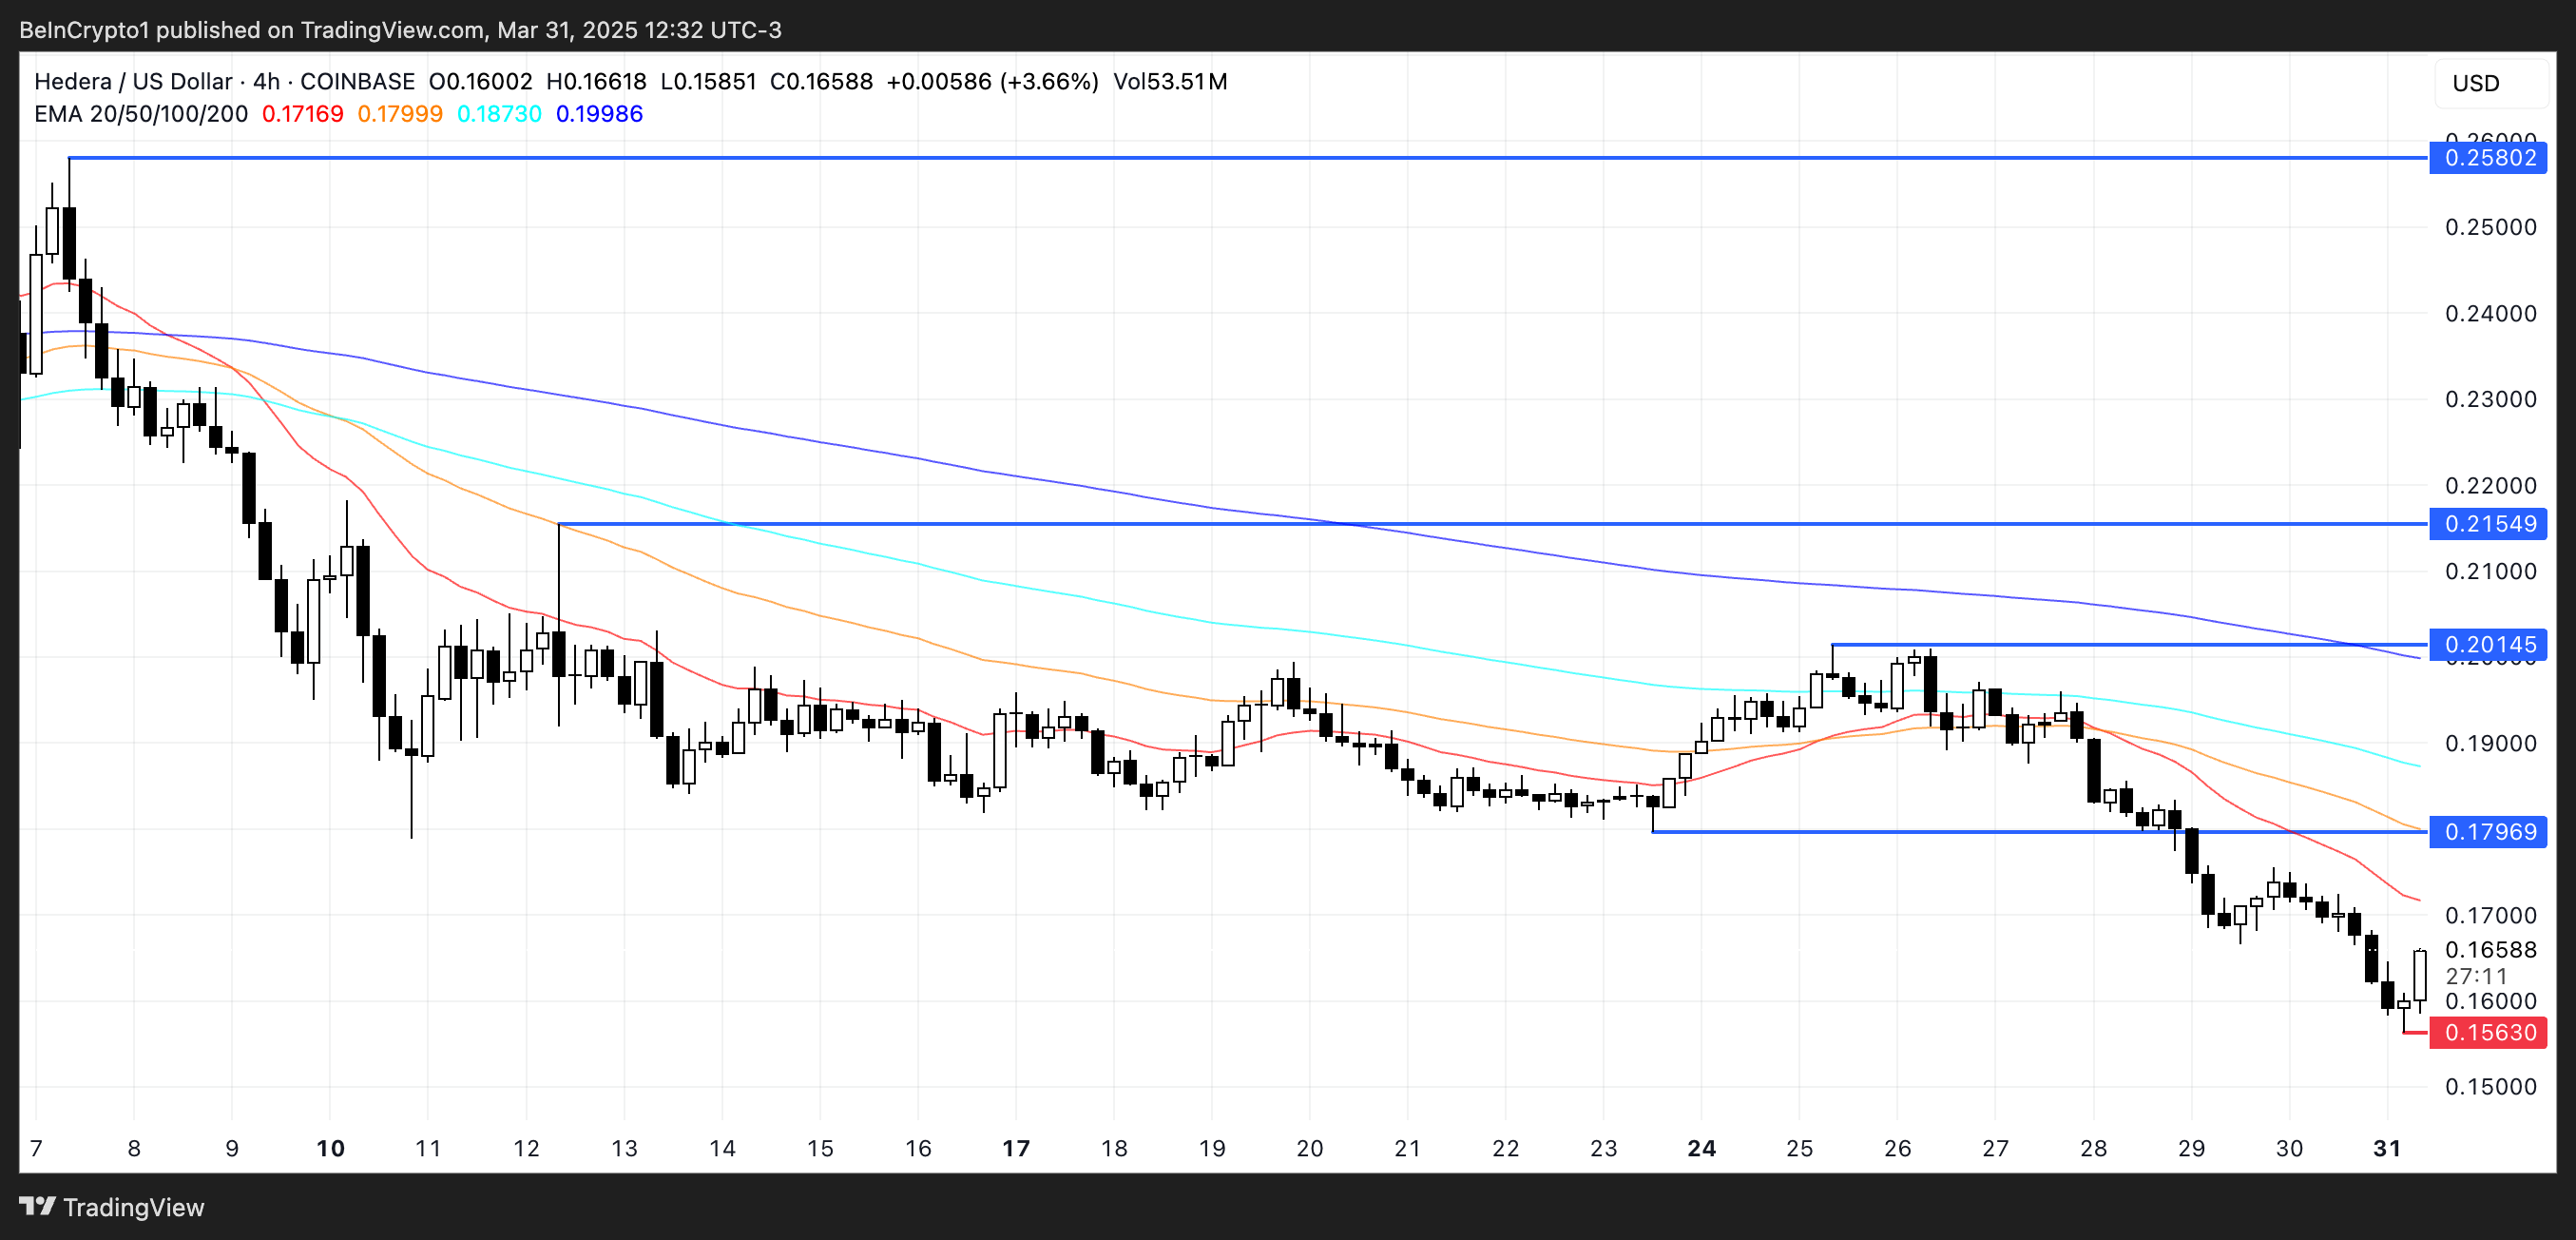
However, if HBAR manages to reverse its current trajectory and regain bullish momentum, the first target to watch is the resistance at $0.179.
A breakout above that level could lead to a stronger rally toward $0.20 and, if momentum continues, even reach $0.215. In a more extended bullish scenario, HBAR could climb to $0.25, signaling a full recovery and trend reversal.
Disclaimer
In line with the Trust Project guidelines, this price analysis article is for informational purposes only and should not be considered financial or investment advice. BeInCrypto is committed to accurate, unbiased reporting, but market conditions are subject to change without notice. Always conduct your own research and consult with a professional before making any financial decisions. Please note that our Terms and Conditions, Privacy Policy, and Disclaimers have been updated.

Cardano (ADA) Whales Hit 2-Year Low as Key Support Retested

This is Why PumpSwap Brings Pump.fun To the Next Level

Hedera (HBAR) Bears Dominate, HBAR Eyes Key $0.15 Level

Charles Hoskinson Reveals How Cardano Will Boost Bitcoin’s Adoption

Coinbase Tries to Resume Lawsuit Against the FDIC

Ethereum Bitcoin Ratio Drops to Record Low, What Next for ETH?

2.52 Million Altcoins Are Ruining Crypto’s Future

Animoca Brands Valuation Tanks 75% In Two Years, Here’s Why

Crypto exchange BingX hacked for $43 million

Are The Big Players Losing Interest?

Hong Kong’s Securities Association Tips Authorities On Crypto Self-Regulation

Coinbase cbBTC Set to go Live on Solana
2.52 Million Altcoins Are Ruining Crypto’s Future
Animoca Brands Valuation Tanks 75% In Two Years, Here’s Why
Crypto exchange BingX hacked for $43 million
Are The Big Players Losing Interest?
Hong Kong’s Securities Association Tips Authorities On Crypto Self-Regulation
Coinbase cbBTC Set to go Live on Solana
-

 Market21 hours ago
Bitcoin Bears Tighten Grip—Where’s the Next Support?
-

 Market20 hours ago
Ethereum Price Weakens—Can Bulls Prevent a Major Breakdown?
-

 Market15 hours ago
Don’t Fall for These Common Crypto Scams
-

 Ethereum9 hours ago
Ethereum Price Confirms Breakout From Ascending Triangle, Target Set At $7,800
-
 Bitcoin14 hours ago
Marathon Digital to Sell $2 Billion in Stock to Buy Bitcoin
-
 Bitcoin8 hours ago
Strategy Adds 22,048 BTC for Nearly $2 Billion
-
 Market13 hours ago
Strategic Move for Trump Family in Crypto
-

 Market8 hours ago
BNB Breaks Below $605 As Bullish Momentum Fades – What’s Next?