
Bitcoin
Is The Bitcoin Cycle Top In? What 13 On-Chain Indicators Say
In the latest edition of Capriole Investments’ “Bitcoin Update,” Charles Edwards, founder and CEO, examines the current state of Bitcoin through a detailed analysis of thirteen on-chain indicators to address the critical question: Is the Bitcoin cycle top in?
A month after a promising technical breakout above $65.5K, which briefly touched $70K, Bitcoin experienced a sharp reversal, suggesting a possible cycle top. Edwards notes, “Never before has Bitcoin broken a new all-time high and had two retests instead of printing new highs.” This pattern, according to him, indicates a potential size-related consolidation but is generally a sign of market weakness.
Bitcoin On-Chain Data Analysis
#1 Supply Delta + 90 Day CDD: These metrics provide a strong indication of cycle tops by displaying supply movements and coin destruction days. The recent data formed a rounded top after a vertical increase in both metrics, which historically corresponds with market peaks. Edwards rates this as bearish, implying that the supply dynamics are signaling a downturn.
#2 Long-term Holder Inflation Rate: Historically, a threshold of 2.0 in this metric has been a reliable predictor of cycle tops. The rate has escalated from 0.5 in April to 1.9, now teetering close to this critical level. This proximity suggests that long-term holders are becoming increasingly likely to sell, marking another bearish indicator.
#3 Hodler Growth Rate (HGR): This measures the net growth of long-term holders. A decline or plateau in this rate often precedes market tops, as it indicates long-term investors cashing out. Currently, the HGR has not made new highs in over six months, aligning with historical precedents of cycle tops and thus is scored bearish.
#4 Bitcoin Heater: Analyzing extreme readings in funding, basis, and options, this metric stands neutral in the current cycle, indicating no significant market exuberance that typically precedes market tops. Furthermore, the absence of new leverage in the market contributes to this neutral stance.
#5 Dynamic Range NVT: This valuation metric compares on-chain transaction volume to market cap, recently moving out of the value zone due to increased on-chain activity from innovations like Ordinals and Runes. Despite this increase, it remains neutral, suggesting a balanced market valuation.
#6 On-chain Transaction Fees: Elevated transaction fees typically indicate high network demand, which can point to cycle peaks when followed by a sharp decline. Current fees have shown some spikes but largely mirror the decline noted in April. This metric remains neutral but is something Edwards advises to watch closely.
#7 Net Unrealized Profit/Loss (NUPL): Positioned just below the euphoria zone at 74%, the NUPL suggests that most market participants are in profit, but not excessively so. This delicate balance leaves the metric in a neutral state, reflecting potential caution but not outright exuberance.
#8 Spent Volume 7-10 years: A significant increase in spent volume from older coins typically suggests selling by long-term holders or “whales,” which can precede a market top. The massive transaction on May 28, involving 138,000 Bitcoin, primarily from Mt. Gox distributions, marks this as bearish, indicating potential market pressure from large-scale sell-offs.
#9 SLRV Ribbons: This metric, which looks at short and long revert ribbons, shows a bearish crossover for the first time this year. While it hasn’t reached an elevated point suggesting a cycle top, the recent trend is concerning and contributes to the bearish outlook.
#10 Dormancy Flow: With dormancy flow peaking significantly this year, the average age of spent coins is higher, similar to peaks seen in 2017 and 2021. This continuation of a high dormancy flow rate is bearish, suggesting a potential cycle top is near.
#11 Percent Addresses in Profit: Over 95% of addresses being in profit usually precedes a cycle top. With the recent high and subsequent decline, this indicator turns bearish, signaling that many investors might be taking profits, which could lead to a price drop.
#12 Mayer Multiple: Despite a peak at 1.9 in March, the Mayer Multiple remains below the 2.5 threshold that has historically indicated major cycle tops. Currently at 1.0, this metric is neutral, indicating that while the market is heated, it hasn’t reached the extremes of previous cycle peaks.
#13 US Liquidity: The correlation between liquidity and Bitcoin’s price is strong, and recent trends show a persistent downtrend in liquidity, which Edwards finds concerning. This negative liquidity growth aligns with a bearish outlook for Bitcoin.
What Does This Mean For The Bitcoin Cycle?
Out of thirteen metrics analyzed, eight are currently bearish, five remain neutral, and none are bullish. This predominance of bearish indicators suggests that the cycle top could very well be in, marking a potential pivot point for Bitcoin. “I won’t lie, I find this on-chain data hard to believe. I am surprised by the count of Bearish signals for being just two months post halving,” Edwards noted.
Despite the bearish lean in on-chain metrics, he highlights the importance of considering technical patterns and broader market behavior. Bitcoin’s price is currently above the $58K support level, and the potential formation of a Wyckoff Accumulation pattern on the daily chart suggests that the market could still hold bullish potential.
However, the mixed signals necessitate cautious optimism and vigilant risk management. “Fundamentals look bearish, but technicals are still bullishly skewed. That leaves ambiguity here. All of the bearish Top Signals could be the result of typical summer months inactivity. Or perhaps this cycle will be a bit more like 2013 with a double top, or some hybrid mid-cycle grind that we must go through now given we are playing in the big league with the TradFi today,” Edwards remarked.
However, he also concluded, “My gut tells me this is just an exceptionally bad summer period for Bitcoin on-chain activity, and we will see what is usually the best 12 month window for Bitcoin risk-adjusted returns post-Halving resume in Q4 and beyond.”
At press time, BTC traded at $62,747.

Featured image created with DALL·E, chart from TradingView.com


Crypto markets will witness $3.42 billion in Bitcoin and Ethereum options contracts expire today. The massive expiration could cause a short-term price impact, particularly as markets wait expectantly for Bitcoin to tag $100,000.
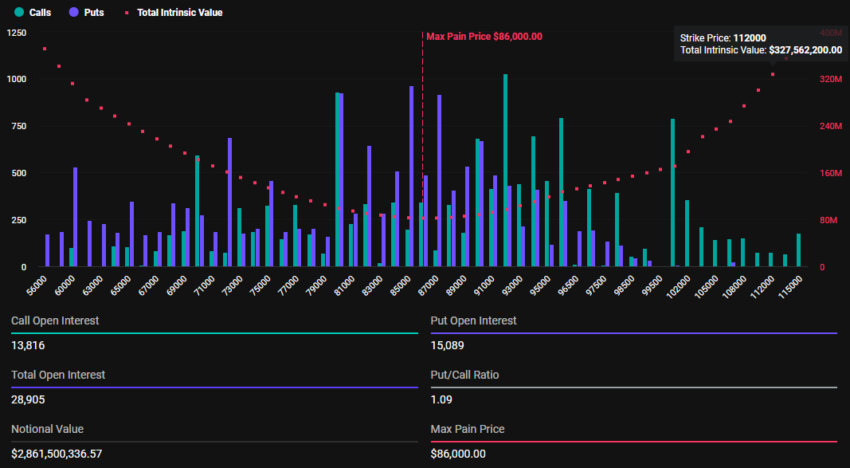
With Bitcoin options valued at $2.86 billion and Ethereum at $561.66 million, traders are bracing for potential volatility.
Unlike Ethereum, Traders Bet On Bitcoin Price Pullback
There has been a significant increase in Bitcoin (BTC) and Ethereum (ETH) contracts due for expiry today compared to last week. According to Deribit data, 28,905 Bitcoin options contracts will expire on Friday with a put-to-call ratio of 1.09 and a maximum pain point of $86,000.
On the other hand, 164,687 Ethereum contracts are due for expiry today, with a put-to-call ratio of 0.66 and a maximum pain point of $3,050.
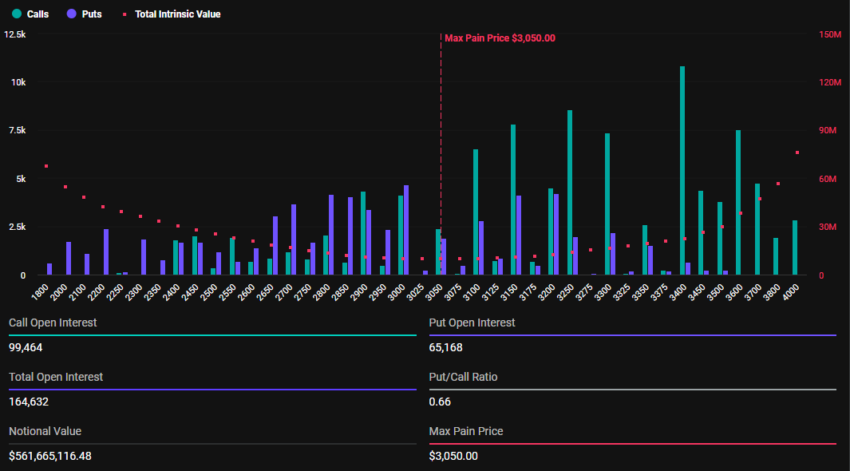
Bitcoin’s Put-to-call ratio stands above 1, indicating a generally bearish sentiment despite BTC’s whales and long-term holders fueling its recent growth. In comparison, Ethereum counterparts have a put-to-call ratio of 0.66, reflecting a generally bullish market outlook.
The put-to-call ratio gauges market sentiment. Put options represent bets on price declines, whereas call options point to bets on price increases.
When this ratio is above 1, it suggests a lack of optimism in the market, with more traders betting on price decreases. On the other hand, a put-to-call ratio below 1 suggests optimism in the market, and more traders are betting on price increases.
Bitcoin’s Put-to-Call Ratio, Implications for BTC
As options near expiration, traders are betting on BTC prices dropping and ETH prices rising. According to the Max Pain Theory in options trading, BTC and ETH could each pull toward their maximum pain points (strike prices) of $86,000 and $3,050, respectively. Here, the largest number of contracts — both calls and puts — would expire worthless.
Notably, price pressure for both assets will ease after Deribit settles contracts at 08:00 UTC today. At the time of writing, however, BTC was trading for $98,876, whereas ETH was exchanging hands for $3,389. Meanwhile, in line with put-to-call ratios, analysts at Greeks.live anticipate an extended move north for ETH and say BTC is at the cusp of a correction.
“With about 8% of positions expiring this week, the big rally in Ethereum has led to a significant increase in ETH major term options IV [implied volatility], while BTC major term options IV has remained relatively stable. The market sentiment remains extremely optimistic at this point,” Greeks.live analysts said.
The analysts also note that while Bitcoin risks a correction, the generalized market rally keeps this potential pullback at bay. They ascribe the positive sentiment in the market to significant capital inflows into ETFs (exchange-traded funds), specifically BlackRock’s IBIT options, which started to trade only recently alongside a strongly driven spot bull market.
Nevertheless, with today’s high-volume expiration, traders should anticipate fluctuations in Bitcoin and Ethereum prices that could shape their short-term trends.
Disclaimer
In adherence to the Trust Project guidelines, BeInCrypto is committed to unbiased, transparent reporting. This news article aims to provide accurate, timely information. However, readers are advised to verify facts independently and consult with a professional before making any decisions based on this content. Please note that our Terms and Conditions, Privacy Policy, and Disclaimers have been updated.
Marathon Digital Holdings, one of the largest Bitcoin miners, has completed a record $1 billion offering of 0% convertible senior notes due 2030. The net proceeds from the sale were approximately $980 million.
According to the firm’s statement, the net proceeds will be primarily used to buy Bitcoin.
Marathon Digital Holds over $2.5 Billion Worth of Bitcoin
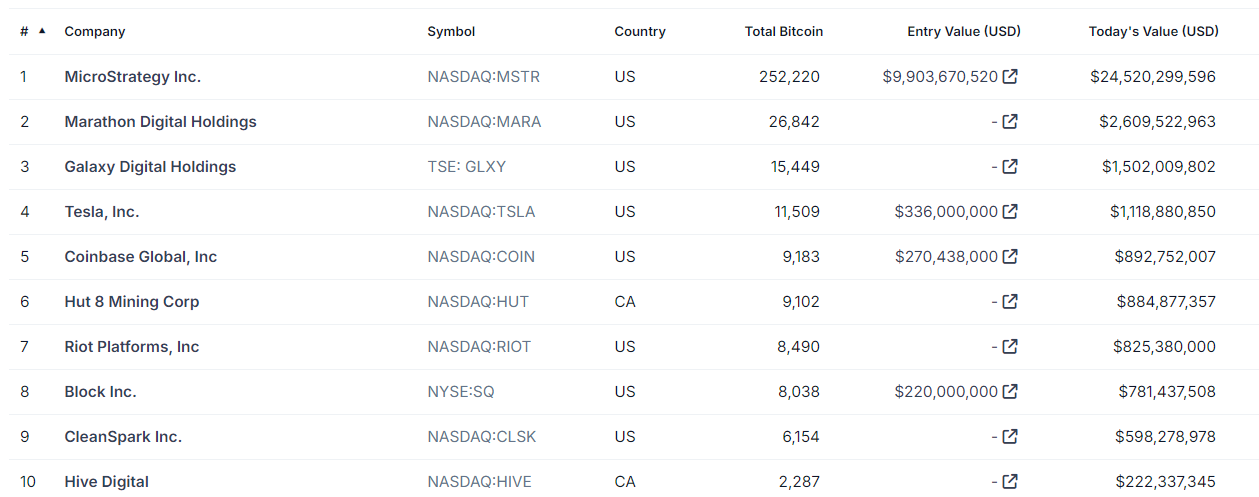
After its last purchase in September, Marathon Digital’s Bitcoin holdings stand at 25,945 BTC. This is currently worth approximately $2.52 billion, as Bitcoin reached an all-time high of $98,000 earlier today.
However, the company’s decision to expand its holdings potentially points to a larger bullish cycle for the token in the long term. According to its press release, Marathon Digital plans to use $199 million of the net proceeds to repurchase existing convertible notes due 2026.
The remainder will be used to acquire additional Bitcoin and for general corporate purposes. Marathon Digital is currently the second largest Bitcoin holder among publicly traded companies.
The notes offer flexibility, with options for conversion into cash, shares of Marathon’s common stock, or a combination of both. Redemption terms include the ability for the company to redeem the notes at full principal value plus accrued interest.
“$1 Billion. 0% interest. MARA has completed the largest convertible notes offering ever amongst BTC miners. The mission, as always: Provide value. Acquire #bitcoin,” the company wrote on X (formerly Twitter).
Increasing Bitcoin Acquisition Among Public Firms
Marathon Digital is following an ongoing trend of public companies increasing their Bitcoin holdings in this bull market. Earlier this week, MicroStrategy announced plans to issue $1.75 billion in convertible notes maturing in 2029. The proceeds will be used to fund additional Bitcoin purchases.
On the same day, the company secured $4.6 billion worth of Bitcoin, building on a $2 billion acquisition from the prior week.
Bitcoin’s all-time high and these aggressive purchases propelled MicroStrategy’s stock price by nearly 120% in a single month. The largest Bitcoin holder also entered the list of top 100 public companies in the US.
Meanwhile, Marathon Digital has faced challenges despite its growing Bitcoin reserves. The company reported a $125 million net loss in Q3. This was driven by a $92 million year-over-year increase in operating costs.
However, its operational capacity has strengthened. Earlier this month, its energized hash rate surged by 93%, signaling increased mining efficiency. Marathon Digital also signed an $80 million agreement with the Keynan government to expand its Bitcoin mining capabilities.
Disclaimer
In adherence to the Trust Project guidelines, BeInCrypto is committed to unbiased, transparent reporting. This news article aims to provide accurate, timely information. However, readers are advised to verify facts independently and consult with a professional before making any decisions based on this content. Please note that our Terms and Conditions, Privacy Policy, and Disclaimers have been updated.

Coinbase, the largest US-based crypto exchange, has announced it will suspend trading for Wrapped Bitcoin (WBTC) on December 19, 2024, at approximately 12 p.m. ET.
The decision, revealed in a post on X (formerly Twitter), cites a routine review of its listed assets to ensure compliance with listing standards.
Coinbase Sidesteps WBTC Amid cbBTC Boom
The suspension will apply to both Coinbase Exchange and Coinbase Prime. Although trading will cease, WBTC holders will retain full access to their funds and the ability to withdraw them at any time. In preparation for the transition, Coinbase has moved WBTC trading to a limit-only mode, where users can place and cancel limit orders while matches may still occur.
“Coinbase will suspend trading for WBTC (WBTC) on December 19, 2024, at or around 12 pm ET. Your WBTC funds will remain accessible to you, and you will continue to have the ability to withdraw your funds at any time. We have moved our WBTC order books to limit-only mode. Limit orders can be placed and canceled, and matches may occur,” Coinbase detailed.
Coinbase’s move to suspend WBTC comes amid the rapid success of its wrapped Bitcoin token, cbBTC. Recently, cbBTC surpassed a $1 billion market capitalization, reflecting growing adoption and trust within the crypto community. This milestone has further cemented cbBTC’s position as a strong competitor to WBTC in the decentralized finance (DeFi) space.

As of this writing, data on Dune shows that cbBTC market capitalization has increased to $1.44 billion. CBTC’s native availability on networks like Solana, Ethereum, and Base has significantly expanded its accessibility, with Arbitrum being the latest addition.
“cbBTC is live on Arbitrum. cbBTC is an ERC-20 token that is backed 1:1 by Bitcoin (BTC) held by Coinbase. It is natively available on Arbitrum and securely accessible to more users across the Ethereum ecosystem,” Coinbase shared on Tuesday.
Additionally, prominent DeFi protocol Aave is targeting cbBTC for its Version 3 (V3) platform, enhancing its utility within the ecosystem. This growing momentum may have played a key role in Coinbase’s decision to phase out WBTC trading.
WBTC Core Team Urge Coinbase to Reconsider
The team behind Wrapped Bitcoin expressed regret and surprise at Coinbase’s decision. In a statement on X, WBTC’s core team emphasized its commitment to compliance, transparency, and decentralization.
“We regret and are surprised by Coinbase’s decision to delist WBTC…We urge Coinbase to reconsider this decision and continue supporting WBTC trading,” the team said.
The statement outlined WBTC’s longstanding reputation for novel mechanisms, regulatory compliance, and decentralized governance. Highlighting its seamless integration with DeFi protocols, WBTC described itself as an essential liquidity solution for Bitcoin users. Urging Coinbase to reconsider, WBTC reaffirmed its readiness to address any concerns or provide additional information to support its case.
Meanwhile, Coinbase’s announcement has sparked mixed reactions across the crypto community. Some users criticized the exchange, suggesting the decision reflects an inability to handle competition.
“Coinbase can’t handle fair competition?? WBTC superior to cbBTC” said Gally Sama in a post.
Nevertheless, others support the move, citing concerns over WBTC’s custody model, with one user referencing BitGo’s recent adoption of a multi-jurisdictional custody system.
“You put custody in the hands of a fraud. What did you think was gonna happen?” the user expressed.
This critique aligns with growing fears about Justin Sun’s involvement in WBTC’s custody processes, as BeInCrypto reported recently. Some users have acted preemptively to avoid potential risks, with one commenter sharing their reservations.
“When Sun got on the multisig for WBTC, I sent all my WBTC on OP to Coinbase and exchanged for true BTC that I withdrew to my hardware wallet… You gave me confirmation just now that I made the right move,” they wrote.
The decision to suspend WBTC trading could mark a pivotal moment in the competition between wrapped Bitcoin solutions. While cbBTC’s integration across multiple blockchain networks has gained momentum, skepticism surrounding WBTC’s custody model and leadership has intensified.
Justin Sun has voiced criticism of Coinbase’s cbBTC strategy, labeling it a setback for Bitcoin’s broader adoption. As the debate continues, the industry watches closely to see whether Coinbase’s cbBTC will solidify its dominance or if WBTC can regain its position as a leading wrapped Bitcoin solution. Regardless, the shifting dynamics reflect the importance of transparency, governance, and community trust in shaping the future of DeFi.
Disclaimer
In adherence to the Trust Project guidelines, BeInCrypto is committed to unbiased, transparent reporting. This news article aims to provide accurate, timely information. However, readers are advised to verify facts independently and consult with a professional before making any decisions based on this content. Please note that our Terms and Conditions, Privacy Policy, and Disclaimers have been updated.

Hidden Bullish Divergence Appears On Dogecoin Price Chart, Here’s What To Expect Next

Dogecoin (DOGE) Shows Renewed Energy: Rally Incoming?

XRP Price Rally to $2 As Paul Atkins Leads to Replace US SEC Chair Gary Gensler

Solana Hits New All-Time High After 3 Years

Bitcoin’s Put-to-Call Ratio Tops 1.0: Bearish Signs Ahead?

Solana Hits New ATH On Huge Whale Accumulation, More Gains Ahead?

2.52 Million Altcoins Are Ruining Crypto’s Future

Animoca Brands Valuation Tanks 75% In Two Years, Here’s Why

Crypto exchange BingX hacked for $43 million

Are The Big Players Losing Interest?

Hong Kong’s Securities Association Tips Authorities On Crypto Self-Regulation

Coinbase cbBTC Set to go Live on Solana
2.52 Million Altcoins Are Ruining Crypto’s Future
Animoca Brands Valuation Tanks 75% In Two Years, Here’s Why
Crypto exchange BingX hacked for $43 million
Are The Big Players Losing Interest?
Hong Kong’s Securities Association Tips Authorities On Crypto Self-Regulation
Coinbase cbBTC Set to go Live on Solana
-

 Market22 hours ago
South Korea Unveils North Korea’s Role in Upbit Hack
-

 Bitcoin17 hours ago
Marathon Digital Raises $1B to Expand Bitcoin Holdings
-

 Regulation12 hours ago
UK to unveil crypto and stablecoin regulatory framework early next year
-
 Market17 hours ago
ETH/BTC Ratio Plummets to 42-Month Low Amid Bitcoin Surge
-
 Altcoin20 hours ago
Sui Network Back Online After 2-Hour Outage, Price Slips
-
 Altcoin19 hours ago
Dogecoin Whale Accumulation Sparks Optimism, DOGE To Rally 9000% Ahead?
-
 Altcoin22 hours ago
Vitalik Buterin, Coinbase’s Jesse Pollack Buy Super Anon (ANON) Tokens On Base
-
 Altcoin17 hours ago
5 Key Indicators To Watch For Ethereum Price Rally To $10K