Market
This Is Next for Worldcoin (WLD) Price as Overselling Peaks

Despite the massive drawdown, Worldcoin’s (WLD) price could be looking at recovery should the investors opt to accumulate.
Since the altcoin is observing the most intense overselling noted in the altcoin’s history, a revival could be at hand.
Worldcoin Investors Could Accumulate
Worldcoin’s price decline has created a solid opportunity for its investors to capitalize on the low price and add WLD to their wallets. This would also mean recovery for the altcoin, as noticed on the Relative Strength Index (RSI).
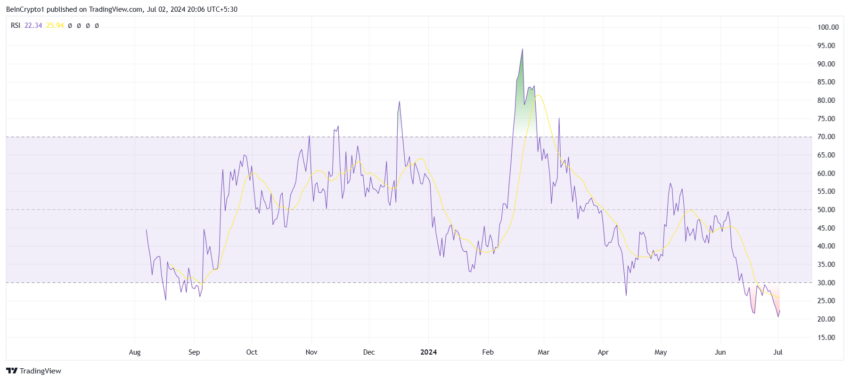
Worldcoin’s RSI has entered the oversold zone, indicating a significant surge of bearish cues. This has led to a drop in its price momentum, suggesting that the altcoin is currently undervalued and may be due for a rebound.
This dip is notable as it marks the largest decline and the highest overselling since the launch of Worldcoin. Generally, this area, below the 30.0 mark, is synonymous with recoveries, making it a bullish case for WLD.
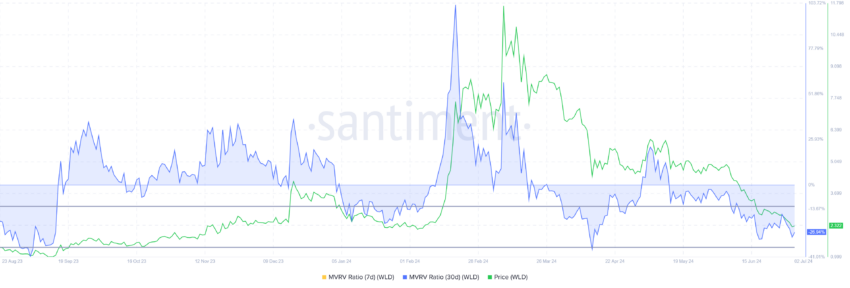
Secondly, the Market Value to Realized Value (MVRV) ratio is also in the opportunity zone right now. The MVRV ratio evaluates investor profit and loss. At present, Worldcoin’s 30-day MVRV is -28%, signifying losses, which could trigger buying pressure.
Historically, WLD MVRV between -15% and -30% typically indicates the beginning of recoveries and rallies, representing an opportunity zone for accumulation.
Read More: How to Buy Worldcoin (WLD) and Everything You Need to Know
This could translate to gains for Worldcoin’s price.
WLD Price Prediction: A Rise After a Long Time
Worldcoin’s price has noted a 58% decline since the beginning of June until yesterday. At the time of writing, the altcoin can be seen changing hands at $2.3. It is hovering above the critical resistance of $2.0.
This level has remained unbroken since November 2023, and a dip to the same would mark an eight-month low for the altcoin. But considering the bullish cues, a bounce back is possible, sending WLD to $3.0. Breaching it would enable further rise for the altcoin.
Read More: Worldcoin (WLD) Price Prediction 2024/2025/2030
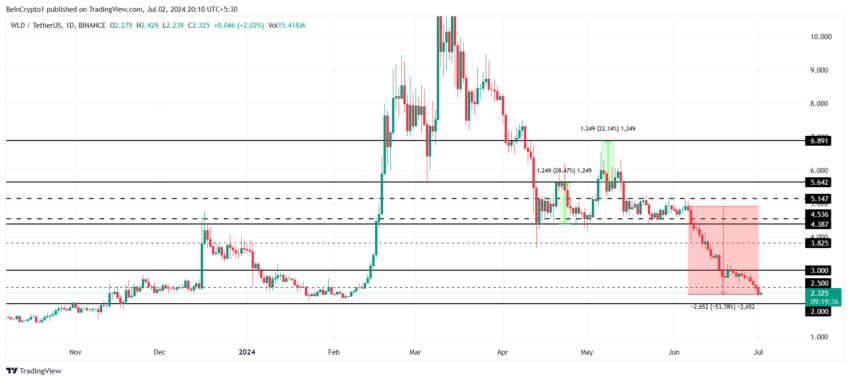
However, a drop below $2.0 will invalidate the bullish thesis, as a drawdown from here will send WLD to $1.0. Recovery from this point would be significantly difficult.
Disclaimer
In line with the Trust Project guidelines, this price analysis article is for informational purposes only and should not be considered financial or investment advice. BeInCrypto is committed to accurate, unbiased reporting, but market conditions are subject to change without notice. Always conduct your own research and consult with a professional before making any financial decisions. Please note that our Terms and Conditions, Privacy Policy, and Disclaimers have been updated.
Market
XRP Battle Heats Up—Can Bulls Turn the Tide?

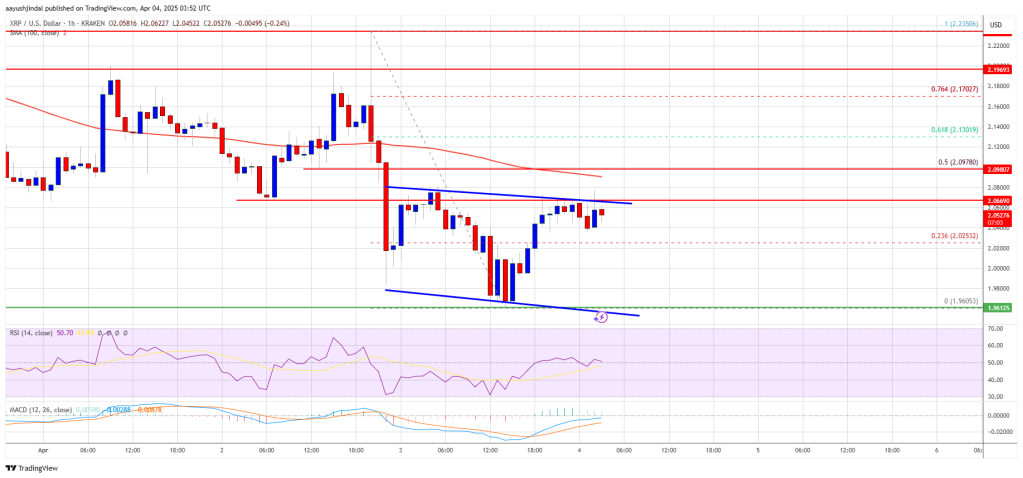
XRP price started a fresh decline below the $2.050 zone. The price is now consolidating and might face hurdles near the $2.10 level.
- XRP price started a fresh decline below the $2.120 and $2.050 levels.
- The price is now trading below $2.10 and the 100-hourly Simple Moving Average.
- There is a short-term declining channel forming with resistance at $2.0680 on the hourly chart of the XRP/USD pair (data source from Kraken).
- The pair might extend losses if it fails to clear the $2.10 resistance zone.
XRP Price Attempts Recovery
XRP price extended losses below the $2.050 support level, like Bitcoin and Ethereum. The price declined below the $2.00 and $1.980 support levels. A low was formed at $1.960 and the price is attempting a recovery wave.
There was a move above the $2.00 and $2.020 levels. The price surpassed the 23.6% Fib retracement level of the downward move from the $2.235 swing high to the $1.960 low. However, the bears are active below the $2.10 resistance zone.
The price is now trading below $2.10 and the 100-hourly Simple Moving Average. On the upside, the price might face resistance near the $2.070 level. There is also a short-term declining channel forming with resistance at $2.0680 on the hourly chart of the XRP/USD pair.
The first major resistance is near the $2.10 level. It is near the 50% Fib retracement level of the downward move from the $2.235 swing high to the $1.960 low. The next resistance is $2.120.
A clear move above the $2.120 resistance might send the price toward the $2.180 resistance. Any more gains might send the price toward the $2.2350 resistance or even $2.40 in the near term. The next major hurdle for the bulls might be $2.50.
Another Decline?
If XRP fails to clear the $2.10 resistance zone, it could start another decline. Initial support on the downside is near the $2.00 level. The next major support is near the $1.960 level.
If there is a downside break and a close below the $1.960 level, the price might continue to decline toward the $1.920 support. The next major support sits near the $1.90 zone.
Technical Indicators
Hourly MACD – The MACD for XRP/USD is now losing pace in the bearish zone.
Hourly RSI (Relative Strength Index) – The RSI for XRP/USD is now above the 50 level.
Major Support Levels – $2.00 and $1.960.
Major Resistance Levels – $2.10 and $2.120.
Market
Ethereum Price Losing Ground—Is a Drop to $1,550 Inevitable?

Reason to trust

Strict editorial policy that focuses on accuracy, relevance, and impartiality
Created by industry experts and meticulously reviewed
The highest standards in reporting and publishing
Strict editorial policy that focuses on accuracy, relevance, and impartiality
Morbi pretium leo et nisl aliquam mollis. Quisque arcu lorem, ultricies quis pellentesque nec, ullamcorper eu odio.
Ethereum price attempted a recovery wave above the $1,820 level but failed. ETH is now consolidating losses and might face resistance near the $1,840 zone.
- Ethereum failed to stay above the $1,850 and $1,840 levels.
- The price is trading below $1,840 and the 100-hourly Simple Moving Average.
- There is a short-term bearish trend line forming with resistance at $1,810 on the hourly chart of ETH/USD (data feed via Kraken).
- The pair must clear the $1,820 and $1,840 resistance levels to start a decent increase.
Ethereum Price Dips Further
Ethereum price failed to stay above the $1,800 support zone and extended losses, like Bitcoin. ETH traded as low as $1,751 and recently corrected some gains. There was a move above the $1,780 and $1,800 resistance levels.
The bulls even pushed the price above the 23.6% Fib retracement level of the downward move from the $1,955 swing high to the $1,751 low. However, the bears are active near the $1,820 zone. The price is now consolidating and facing many hurdles.
Ethereum price is now trading below $1,820 and the 100-hourly Simple Moving Average. On the upside, the price seems to be facing hurdles near the $1,810 level. There is also a short-term bearish trend line forming with resistance at $1,810 on the hourly chart of ETH/USD.
The next key resistance is near the $1,840 level or the 50% Fib retracement level of the downward move from the $1,955 swing high to the $1,751 low at $1,850. The first major resistance is near the $1,880 level.
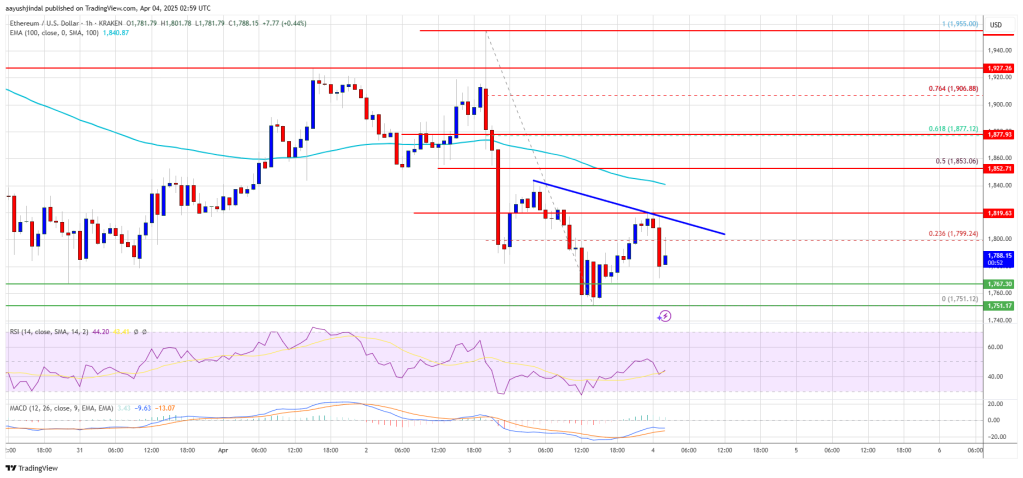
A clear move above the $1,880 resistance might send the price toward the $1,920 resistance. An upside break above the $1,920 resistance might call for more gains in the coming sessions. In the stated case, Ether could rise toward the $2,000 resistance zone or even $2,050 in the near term.
Another Decline In ETH?
If Ethereum fails to clear the $1,850 resistance, it could start another decline. Initial support on the downside is near the $1,765 level. The first major support sits near the $1,750 zone.
A clear move below the $1,750 support might push the price toward the $1,720 support. Any more losses might send the price toward the $1,680 support level in the near term. The next key support sits at $1,620.
Technical Indicators
Hourly MACD – The MACD for ETH/USD is gaining momentum in the bearish zone.
Hourly RSI – The RSI for ETH/USD is now below the 50 zone.
Major Support Level – $1,750
Major Resistance Level – $1,850
Market
Bitcoin Price Still In Trouble—Why Recovery Remains Elusive

Reason to trust

Strict editorial policy that focuses on accuracy, relevance, and impartiality
Created by industry experts and meticulously reviewed
The highest standards in reporting and publishing
Strict editorial policy that focuses on accuracy, relevance, and impartiality
Morbi pretium leo et nisl aliquam mollis. Quisque arcu lorem, ultricies quis pellentesque nec, ullamcorper eu odio.
Bitcoin price started a recovery wave from the $81,200 zone. BTC is consolidating losses and facing hurdles near the $83,500 resistance level.
- Bitcoin started a decent recovery wave above the $82,200 zone.
- The price is trading below $83,200 and the 100 hourly Simple moving average.
- There is a connecting bearish trend line forming with resistance at $83,500 on the hourly chart of the BTC/USD pair (data feed from Kraken).
- The pair could start another increase if it clears the $83,500 zone.
Bitcoin Price Faces Resistance
Bitcoin price extended losses below the $82,500 support zone and tested the $81,200 zone. BTC formed a base and recently started a decent recovery wave above the $82,200 resistance zone.
The bulls were able to push the price above the $82,500 and $83,000 resistance levels. The price even tested the 23.6% Fib retracement level of the recent decline from the $89,042 swing high to the $81,177 low. However, the price is struggling to continue higher.
Bitcoin price is now trading below $83,500 and the 100 hourly Simple moving average. On the upside, immediate resistance is near the $83,200 level. The first key resistance is near the $83,500 level. There is also a connecting bearish trend line forming with resistance at $83,500 on the hourly chart of the BTC/USD pair.
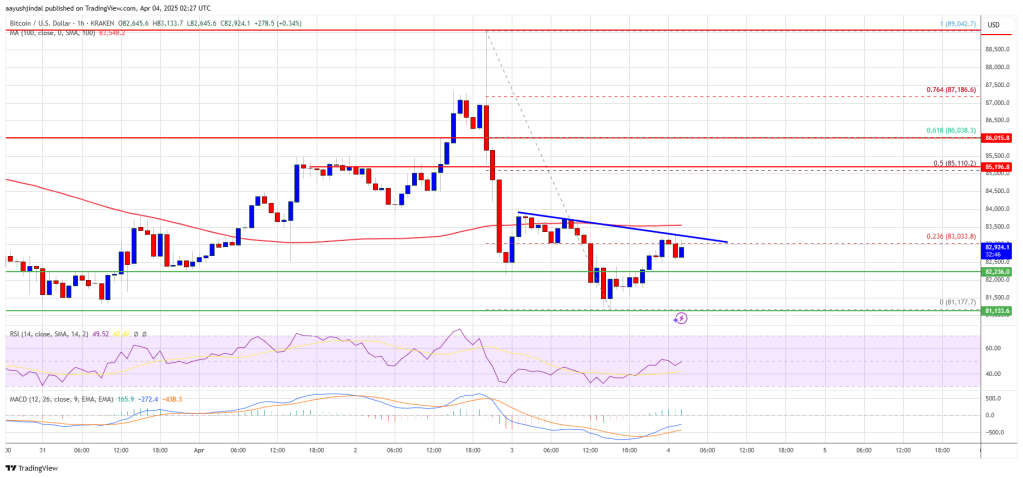
The next key resistance could be $84,500. A close above the $84,500 resistance might send the price further higher. In the stated case, the price could rise and test the $85,500 resistance level. Any more gains might send the price toward the $86,000 level or 61.8% Fib retracement level of the recent decline from the $89,042 swing high to the $81,177 low.
Another Decline In BTC?
If Bitcoin fails to rise above the $83,500 resistance zone, it could start a fresh decline. Immediate support on the downside is near the $82,200 level. The first major support is near the $81,200 level.
The next support is now near the $80,500 zone. Any more losses might send the price toward the $80,000 support in the near term. The main support sits at $78,800.
Technical indicators:
Hourly MACD – The MACD is now losing pace in the bearish zone.
Hourly RSI (Relative Strength Index) – The RSI for BTC/USD is now below the 50 level.
Major Support Levels – $82,200, followed by $81,200.
Major Resistance Levels – $83,500 and $85,000.
-

 Market20 hours ago
IP Token Price Surges, but Weak Demand Hints at Reversal
-

 Market23 hours ago
Ethereum Price Recovery Stalls—Bears Keep Price Below $2K
-

 Altcoin20 hours ago
Movimiento millonario de Solana, SOLX es la mejor opción
-

 Ethereum20 hours ago
Ethereum Trading In ‘No Man’s Land’, Breakout A ‘Matter Of Time’?
-

 Altcoin22 hours ago
VanEck Seeks BNB ETF Approval—Big Win For Binance?
-

 Market16 hours ago
Bitcoin’s Future After Trump Tariffs
-

 Altcoin21 hours ago
Binance Issues Key Announcement On StakeStone TGE; Here’s All
-

 Bitcoin20 hours ago
What It Means for Bitcoin


