
Market
Bitcoin Price Challenge: Can It Break Through and Resume Climbing?

Bitcoin price recovered and tested the $63,650 resistance zone. BTC is now consolidating gains and might make another attempt to surpass $63,650.
- Bitcoin started a decent increase above the $62,500 and $63,000 levels.
- The price is trading above $62,250 and the 100 hourly Simple moving average.
- There is a connecting bullish trend line forming with support at $62,800 on the hourly chart of the BTC/USD pair (data feed from Kraken).
- The pair might gain bullish momentum if it clears the $63,650 resistance zone.
Bitcoin Price Holds Ground
Bitcoin price started a decent upward move above the $61,200 zone. BTC was able to clear the $62,000 and $63,000 resistance levels to move into a short-term positive zone.
However, the bears took a stand near the $63,650 zone. A high was formed at $63,798 and the price recently corrected some gains. There was a move below the $63,200 level. The price tested the 23.6% Fib retracement level of the upward move from the $59,950 swing low to the $63,798 high.
Bitcoin price is now trading above $62,250 and the 100 hourly Simple moving average. There is also a connecting bullish trend line forming with support at $62,800 on the hourly chart of the BTC/USD pair.
If there is another increase, the price could face resistance near the $63,250 level. The first key resistance is near the $63,650 level. The next key resistance could be $64,000. A clear move above the $64,000 resistance might start a steady increase and send the price higher.
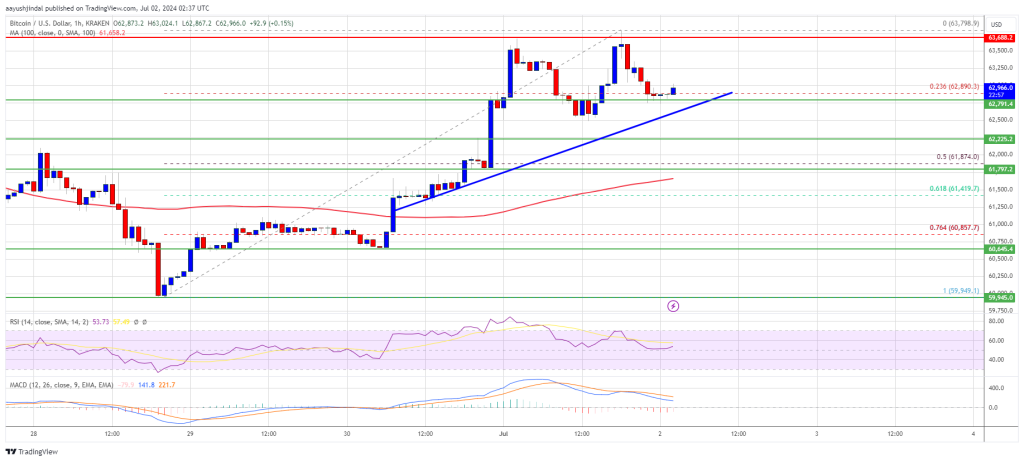
In the stated case, the price could rise and test the $65,000 resistance. Any more gains might send BTC toward the $66,500 resistance in the near term.
Are Dips Supported In BTC?
If Bitcoin fails to climb above the $63,650 resistance zone, it could slowly move down. Immediate support on the downside is near the $62,800 level and the trend line.
The first major support is $62,200. The next support is now forming near $61,800 and the 100 hourly Simple moving average. It is close to the 50% Fib retracement level of the upward move from the $59,950 swing low to the $63,798 high. Any more losses might send the price toward the $60,500 support zone in the near term.
Technical indicators:
Hourly MACD – The MACD is now losing pace in the bullish zone.
Hourly RSI (Relative Strength Index) – The RSI for BTC/USD is now above the 50 level.
Major Support Levels – $62,800, followed by $61,800.
Major Resistance Levels – $63,650, and $64,000.


Some altcoins are setting themselves up to profit from the positive wave as the crypto market prepares for Bitcoin’s possible breakout above the $120,000 mark. Rexas Finance (RXS), SUI, and Solana (SOL) are being hailed by some industry insiders as particularly outstanding performers and ready to go ballistic during the anticipated Bitcoin rally.
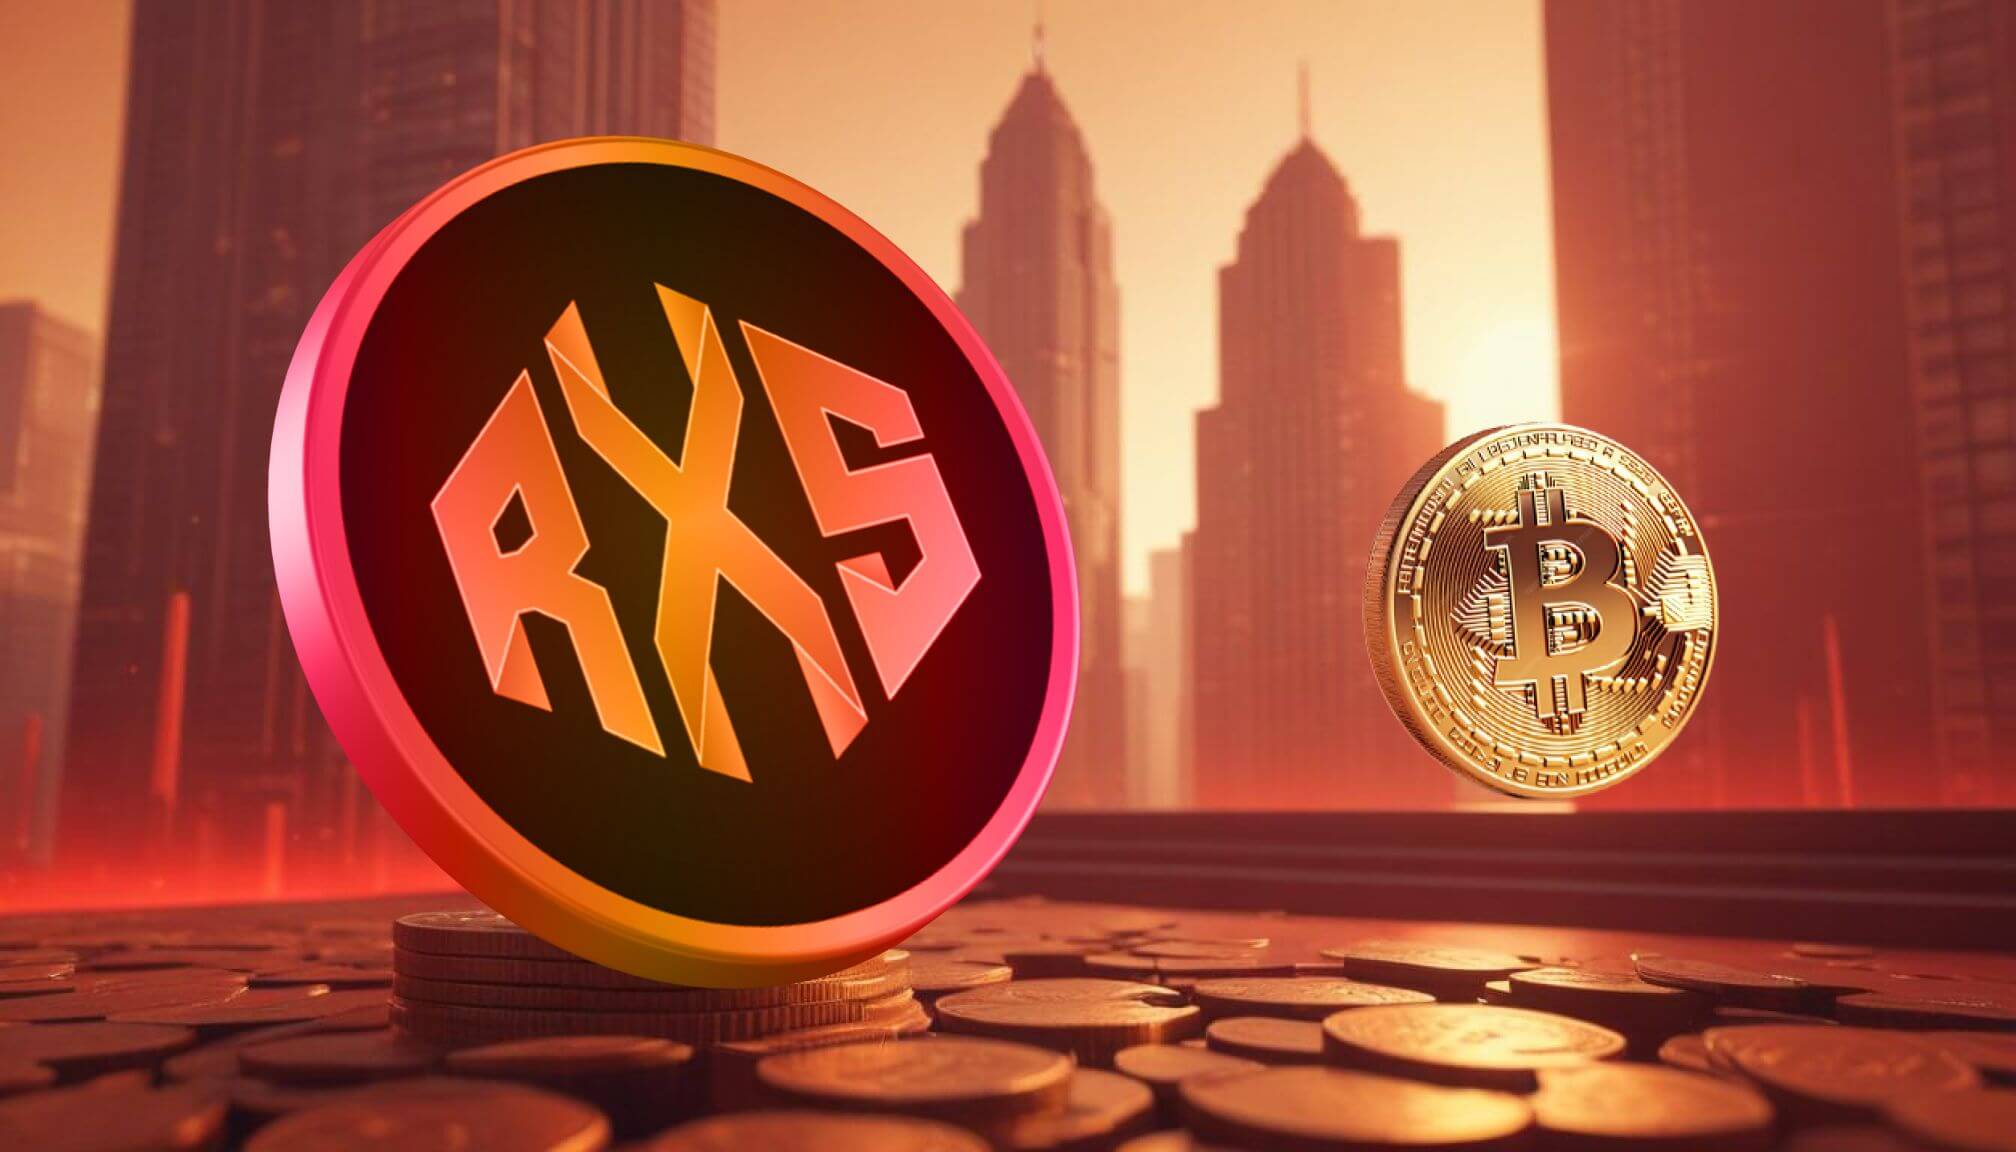
Rexas Finance (RXS): The future of real-world asset tokenization
Rexas Finance provides creative ideas for real-world asset (RWA) tokenization. By letting users tokenize real estate, artwork, and other highly valuable assets, Rexas Finance is changing the crypto scene. The initiative has enormous market potential since the real estate sector alone is valued at around $379.7 trillion.
Rexas Finance attracts retail and institutional investors by lowering transaction costs, improving liquidity, and raising transparency. Rexas Finance, in Stage 6 of its presale, has raised $9.5 million with 166 million tokens sold as of writing, indicating 81.74% completion. In this stage, the token price is $0.080; from its initial $0.03 price two months ago, this shows an impressive 166% increase.
It will list on three tier-1 exchanges at $0.20 post-presale, providing a wider global reach and more potential for gains. Rexas Finance recently received a Certik audit, which is a sign of security and trustworthiness in blockchain initiatives, improving investor confidence. Furthermore, its inclusion on CoinGecko and CoinMarketCap improves visibility and accessibility.
The ongoing $1 million giveaway, which offers 20 winners $50,000 in RXS apiece, has piqued investor interest. Based on projections for RXS, price appreciation seems to be strong as adoption rises. Some analysts believe Rexas Finance, with features such as AI integration, DeFi utilities, and yield optimization, could be poised to go ballistic if Bitcoin rallies above $120,000.
SUI: Consistently Hitting new all-time highs
Rising 105% in the past two weeks, SUI is among the top-performing altcoins in the current bull run. As of writing, SUI trades at $3.72, just below its all-time high of $3.94, which it attained last weekend.
Reflecting increased investor demand and confidence, its Open Interest (OI) has lately topped $826 million. The Chaikin Money Flow (CMF) indicator of the token indicates significant inflows, highlighting its positive trend. With a constant tendency to new all-time highs, SUI’s upward trajectory exactly matches market expectations of a possible surge. Driven by its excellent foundations and growing market visibility, SUI is expected to rise sharply if Bitcoin crosses $120,000.
Solana (SOL): Poised for a new all-time high?
Riding a surge of positive momentum, Solana broke past the $240 barrier twice in the current bull run. SOL trading at $246.89 as of writing has increased 59.9% over the past month. With analysts predicting a surge to $600 or more, its market capitalization of $115 billion ranks it among the top four leading cryptocurrencies, recently flipping Binance Coin.
Technical indicators supporting this optimistic view include a declining triangle breakout and a cup-and-handle pattern. Solana-based decentralized exchanges (DEXs), which account for 33.59% of DEX trade activity as of November, support its bullishness even more. So, Solana might see significant inflows if Bitcoin crosses the $120,000 mark, increasing its price to new highs.
Conclusion
Rexas Finance, SUI, and Solana could be ready to go ballistic if Bitcoin surges past $120,000. Each altcoin has unique qualities and solid foundations that guarantee a place of strength in the next positive market phase. Although SUI and Solana present interesting development chances, Rexas Finance distinguishes itself with its innovative RWA tokenizing, unparalleled presale expansion, and rich possibilities.
For more information about Rexas Finance (RXS) visit the links below:
Website: https://rexas.com
Win $1 Million Giveaway: https://bit.ly/Rexas1M
Whitepaper: https://rexas.com/rexas-whitepaper.pdf
Twitter/X: https://x.com/rexasfinance
Telegram: https://t.me/rexasfinance

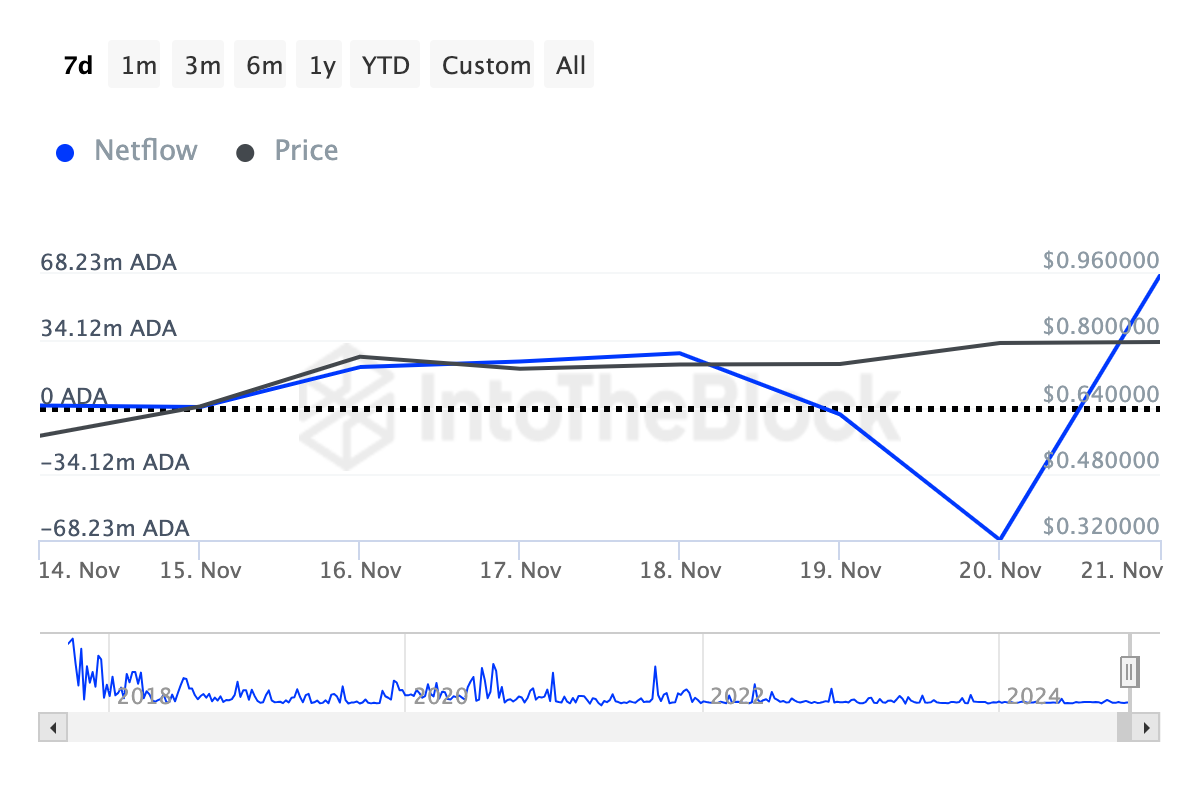
On November 20, crypto whales offloaded significant amounts of Cardano (ADA), disrupting its bullish momentum. However, the narrative shifted today as the Cardano whales’ accumulation has taken center stage.
This renewed buying activity suggests that ADA’s price might regain its bullish momentum toward $1. But does the data support this bullish outlook?
Cardano Key Investors Change Their Stance
According to IntoTheBlock, Cardano’s large holders’ netflow has surged to 67.51 million ADA, signaling a significant shift in sentiment among crypto whales. The netflow represents the difference between the amount of ADA purchased and sold by large holders over a specific period.
When netflow increases, it indicates that whales are buying more than they are selling. Typically, this is a bullish signal. Conversely, a drop in netflow suggests more selling by whales, which is generally regarded as bearish.
In this case, the recent netflow increase, valued at approximately $55 million, aligns with ADA’s 11% price surge over the last 24 hours. Thus, this Cardano whales accumulation suggests that ADA may be poised for further gains, with the recent uptick serving as a potential foundation for a higher value.
Furthermore, the In/Out of Money Around Price (IOMAP) indicator provides further support for this bullish outlook. For context, the IOMAP analyzes token clusters based on three groups: holders who purchased below the current price (in the money), above the current price (out of the money), and those at breakeven.
This metric is essential for identifying potential support and resistance zones. Specifically, if there is a higher number of tokens “in the money, ” it signifies solid support, as many holders are at a profit and less likely to sell, potentially driving the price higher.
On the other hand, a higher “out of the money,” volume points to resistance, as holders might sell to recover losses, putting downward pressure on the price.
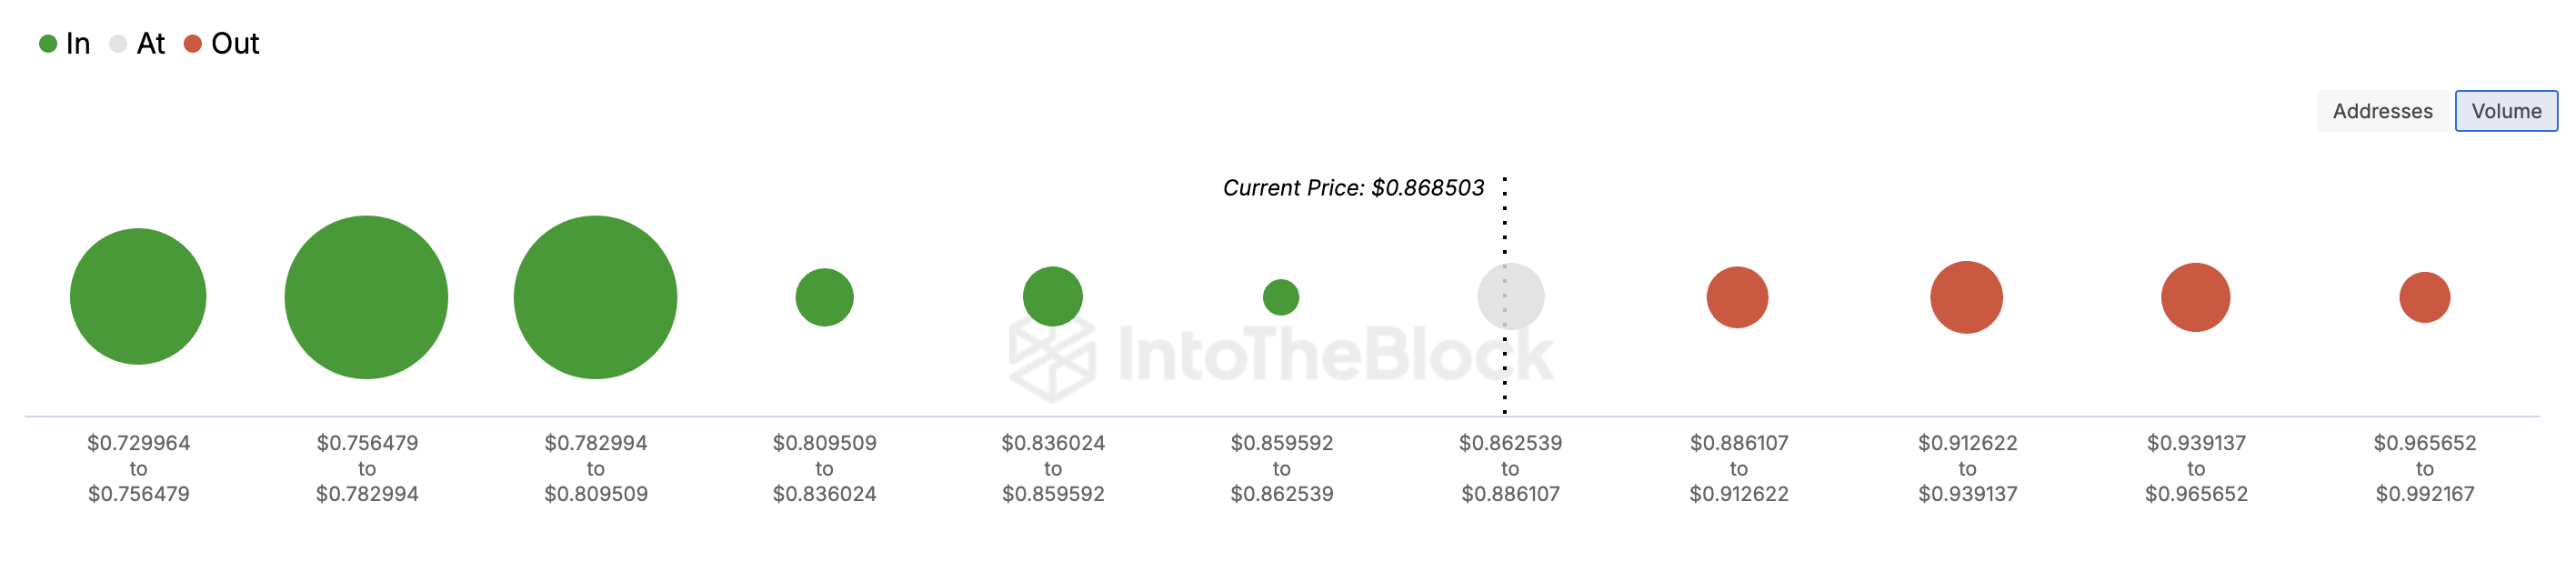
Currently, ADA’s IOMAP shows strong support levels outweighing resistance zones, reinforcing the potential for its price to climb further.
ADA Price Prediction: Move Toward $1 Almost Valid
On the daily chart, ADA’s price has risen above the key Exponential Moving Averages (EMAs). Specifically, the 20-day EMA (blue) and 50 EMA (yellow) are below Cardano’s price. When the price is above the indicator, the trend is bullish.
On the other hand, if the price is below the indicator, the trend is bearish. Therefore, it appears that, with the current trend, ADA could rise higher than $0.87. If this happens, the altcoin might rally toward the $1 mark.
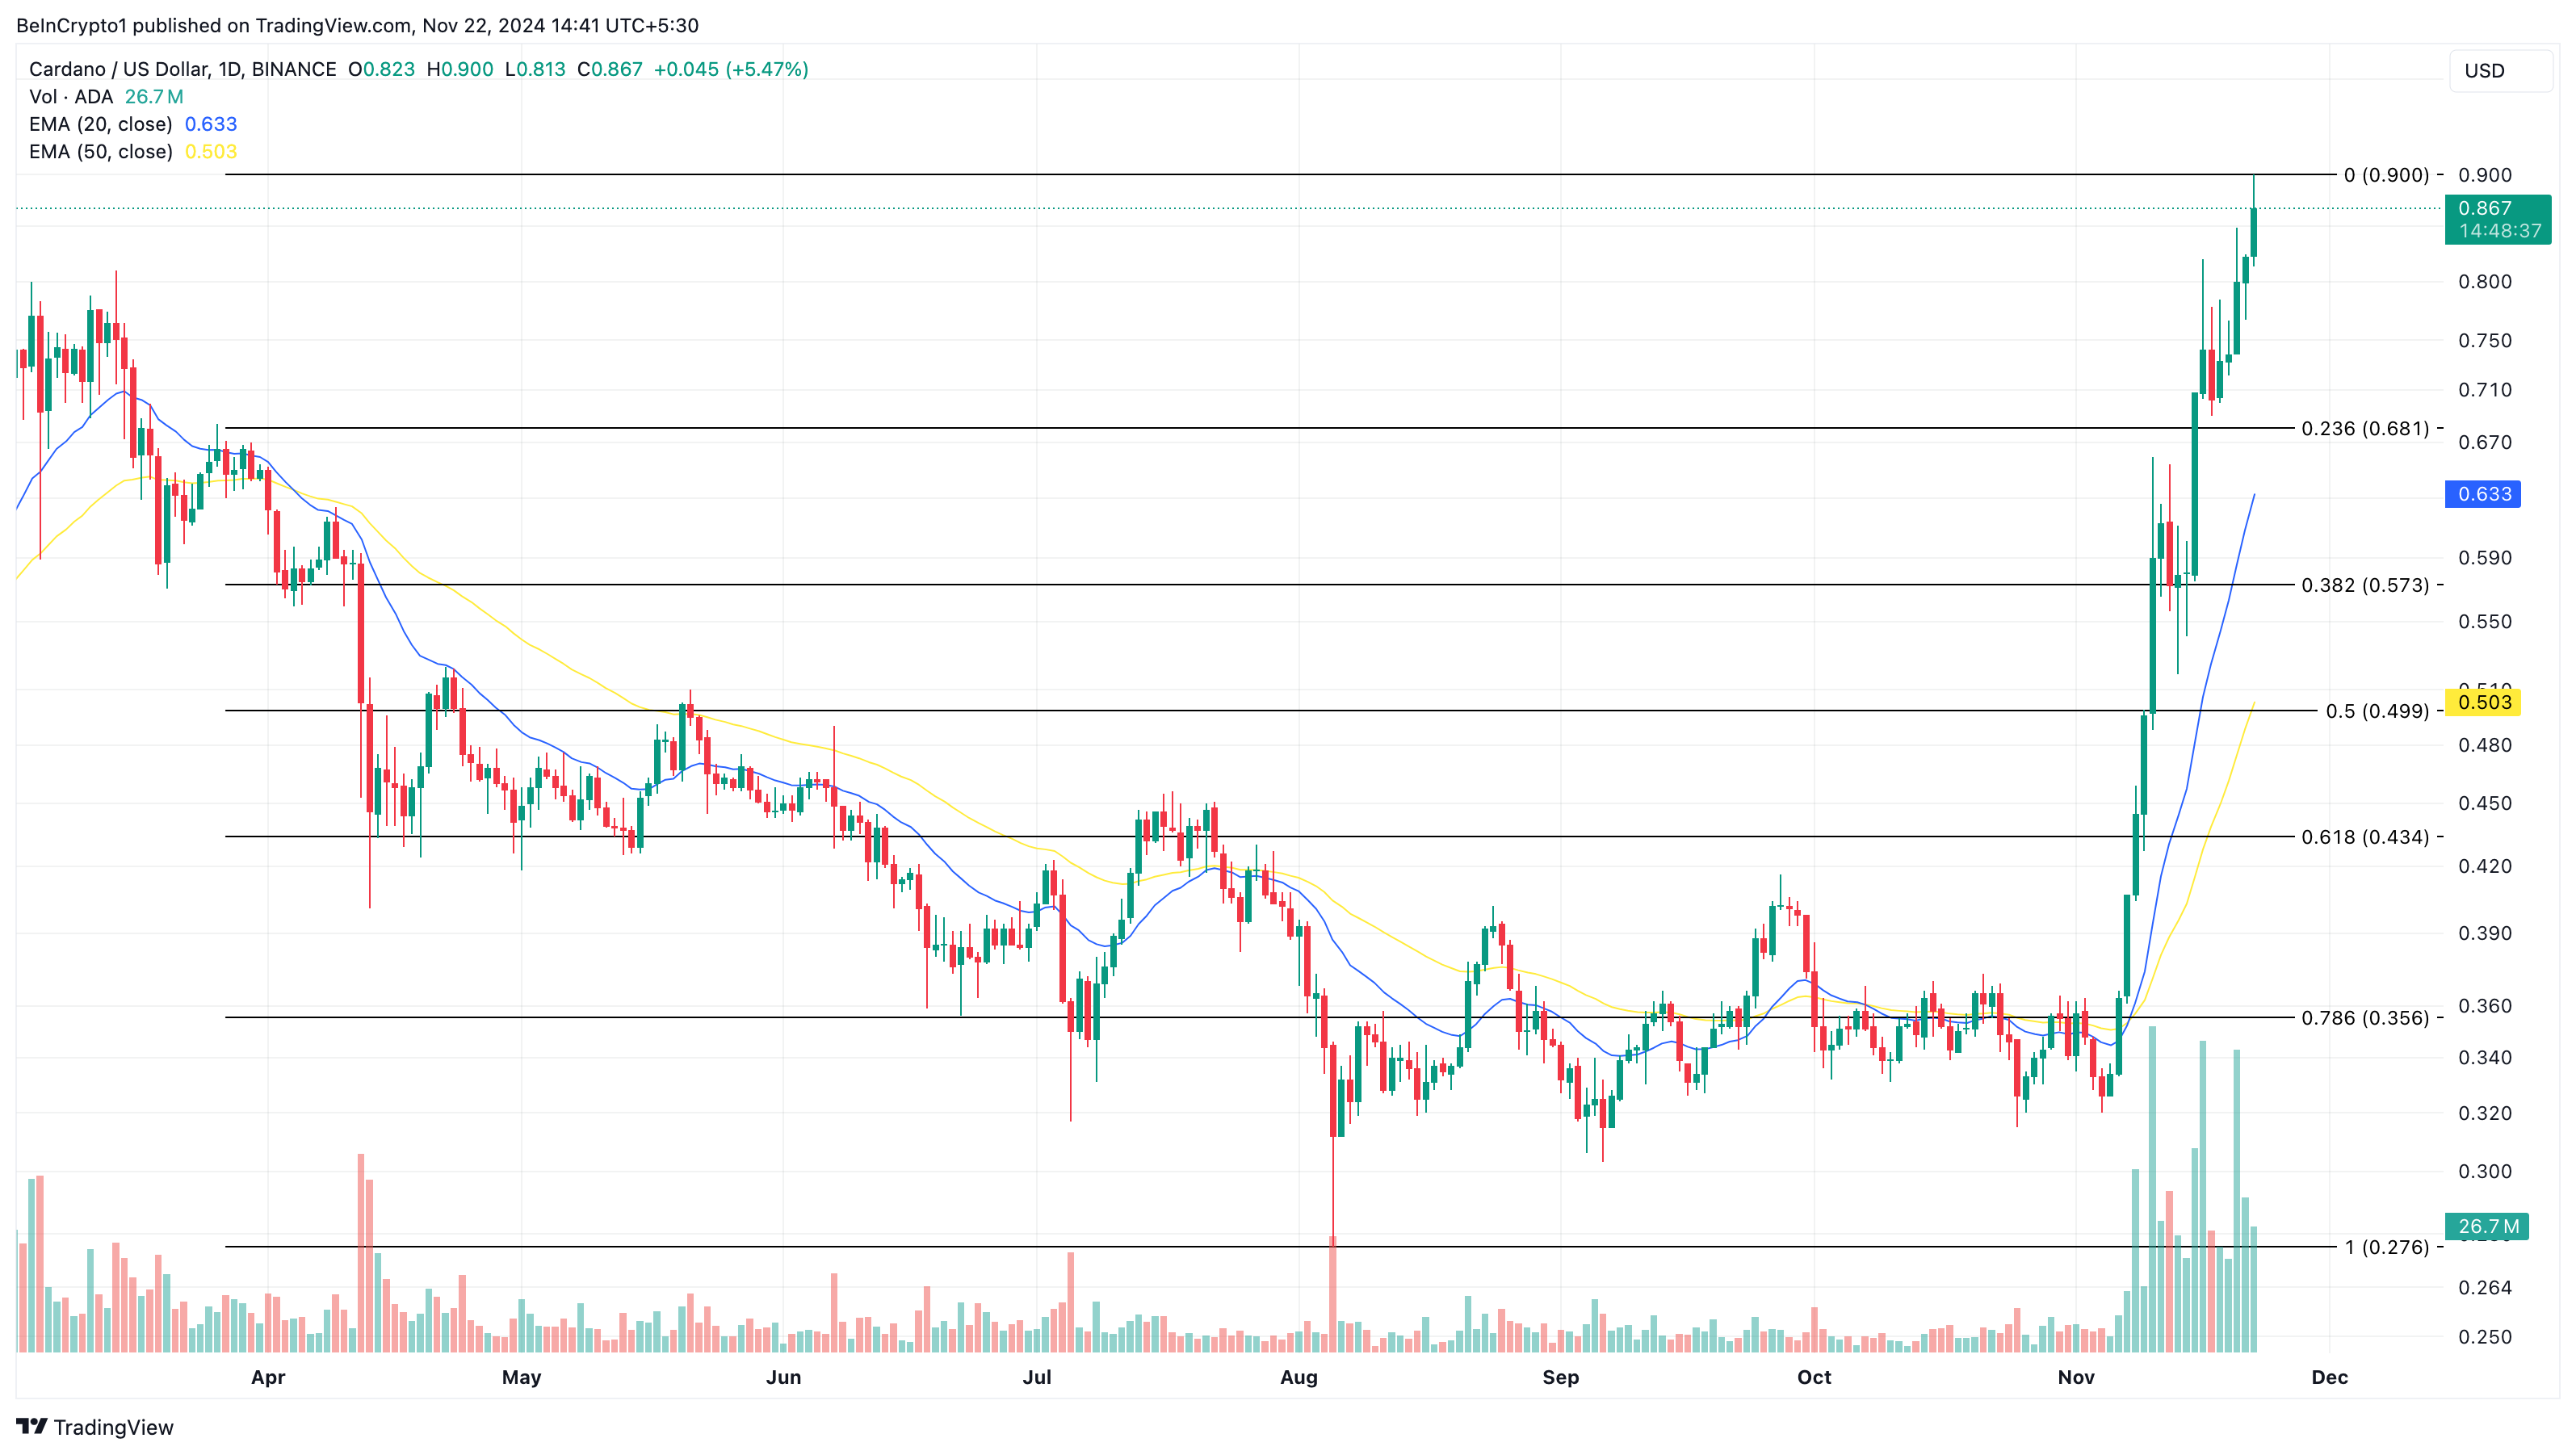
However, if Cardano whales decide to sell and book profits, this prediction might not come to pass. Instead, the price could drop to $0.68.
Disclaimer
In line with the Trust Project guidelines, this price analysis article is for informational purposes only and should not be considered financial or investment advice. BeInCrypto is committed to accurate, unbiased reporting, but market conditions are subject to change without notice. Always conduct your own research and consult with a professional before making any financial decisions. Please note that our Terms and Conditions, Privacy Policy, and Disclaimers have been updated.

Bitcoin price is rising steadily above the $95,000 zone. BTC is showing positive signs and might soon hit the $100,000 milestone level.
- Bitcoin started a fresh increase above the $95,000 zone.
- The price is trading above $95,000 and the 100 hourly Simple moving average.
- There is a key bullish trend line forming with support at $95,200 on the hourly chart of the BTC/USD pair (data feed from Kraken).
- The pair could continue to rise if it clears the $100,000 resistance zone.
Bitcoin Price Sets Another ATH
Bitcoin price remained supported above the $92,000 level. BTC formed a base and started a fresh increase above the $95,000 level. It cleared the $96,500 level and traded to a new high at $98,999 before there was a pullback.
There was a move below the $98,000 level. However, the price remained stable above the 23.6% Fib retracement level of the upward move from the $91,500 swing low to the $98,990 high. There is also a key bullish trend line forming with support at $95,200 on the hourly chart of the BTC/USD pair.
The trend line is close to the 50% Fib retracement level of the upward move from the $91,500 swing low to the $98,990 high. Bitcoin price is now trading above $96,000 and the 100 hourly Simple moving average.
On the upside, the price could face resistance near the $98,880 level. The first key resistance is near the $99,000 level. A clear move above the $99,000 resistance might send the price higher. The next key resistance could be $100,000.

A close above the $100,000 resistance might initiate more gains. In the stated case, the price could rise and test the $102,000 resistance level. Any more gains might send the price toward the $104,500 resistance level.
Downside Correction In BTC?
If Bitcoin fails to rise above the $100,000 resistance zone, it could start a downside correction. Immediate support on the downside is near the $98,000 level.
The first major support is near the $96,800 level. The next support is now near the $95,500 zone and the trend line. Any more losses might send the price toward the $92,000 support in the near term.
Technical indicators:
Hourly MACD – The MACD is now gaining pace in the bullish zone.
Hourly RSI (Relative Strength Index) – The RSI for BTC/USD is now above the 50 level.
Major Support Levels – $96,800, followed by $95,500.
Major Resistance Levels – $99,000, and $100,000.

Dormant Ethereum Whale Dumps $224M Tokens, Has ETH Price Topped?

3 altcoins that could go ballistic if Bitcoin (BTC) crosses $120,000 mark

Cardano Whales Accumulation Hits $55 Million: $1 Target Soon?

Ethereum Attempts Key Breakout: Analysts Set $3,700 Target

Bitcoin Price Approaches $100K: The Countdown Is On
Top Neiro Ethereum Holder Dumps $3M NEIRO Sparking Price Dip Concerns

2.52 Million Altcoins Are Ruining Crypto’s Future

Animoca Brands Valuation Tanks 75% In Two Years, Here’s Why

Crypto exchange BingX hacked for $43 million

Are The Big Players Losing Interest?

Hong Kong’s Securities Association Tips Authorities On Crypto Self-Regulation

Coinbase cbBTC Set to go Live on Solana
2.52 Million Altcoins Are Ruining Crypto’s Future
Animoca Brands Valuation Tanks 75% In Two Years, Here’s Why
Crypto exchange BingX hacked for $43 million
Are The Big Players Losing Interest?
Hong Kong’s Securities Association Tips Authorities On Crypto Self-Regulation
Coinbase cbBTC Set to go Live on Solana
-
 Altcoin23 hours ago
Dogecoin Whale Accumulation Sparks Optimism, DOGE To Rally 9000% Ahead?
-

 Bitcoin21 hours ago
Marathon Digital Raises $1B to Expand Bitcoin Holdings
-

 Regulation15 hours ago
UK to unveil crypto and stablecoin regulatory framework early next year
-
 Market21 hours ago
ETH/BTC Ratio Plummets to 42-Month Low Amid Bitcoin Surge
-
 Altcoin21 hours ago
5 Key Indicators To Watch For Ethereum Price Rally To $10K
-

 Market20 hours ago
SEC Moves Toward Solana ETF Approval Amid Pro-Crypto Shift
-

 Market13 hours ago
GOAT Price Sees Slower Growth After Reaching $1B Market Cap
-

 Market19 hours ago
Aptos Partners with Circle and Stripe to Revitalize Network