
Market
Limited To 24 Months Before Exhaustion

The recent report released by the Polkadot Treasury for the first half of 2024 has raised concerns over an impending funding crisis. The report indicates that the Treasury’s assets, spread across multiple chains, have become increasingly complex and challenging to manage effectively.
Decentralized finance (DeFi) researcher DeFi Ignas has analyzed the report, highlighting the Treasury’s limited runway of approximately two years at the current burn rate of $87 million every six months.
Funding Concerns Mount For Polkadot
Polkadot’s expenditure during the first half of 2024 paints a worrying picture. An extensive outreach program accounted for $37 million, aiming to attract new users, developers, and businesses.
Additional expenses included $10 million on ads/sponsorships, $4.4 million on influencers, and $4 million on digital ads. Surprisingly, despite such expenditures, Polkadot’s visibility on social media platforms, including “Platform X,” remained notably low.
Related Reading
The Treasury spent a total of $86 million in the past six months, managing $245 million (38 million DOT) in assets, with $188 million (29 million DOT) in liquid form. The burn rate indicates that the Treasury may face bankruptcy in less than two years.
Polkadot’s token supply experiences a 10% annual growth, primarily fueling staking rewards. With a $10 billion market cap, stakers receive $1 billion per year, which significantly affects network security costs.
However, a proposal to reduce inflation was rejected by 57% of the stakeholders, further compounding the Treasury’s financial challenges.
New Governance Model
The report reveals that direct fee revenue remains marginal for Polkadot. In 2023-H2, Polkadot generated 300,000 DOT through fees during a short-lived inscription campaign. Under regular conditions, fee revenue stabilizes at around 20,000 DOT per quarter.
On the expense side, the report highlights a 2.4x increase in DOT spending compared to 2023-H2. Ambitious proposals and larger ask sizes contributed to this significant spending surge.
Although the average DOT price rose, resulting in more value per DOT, concerns about the Treasury’s usage are mounting within the ecosystem.
Related Reading
To address these challenges, Polkadot is moving towards a more structured approach. Executive bodies, such as bounties and collectives, are emerging to assume departmental roles within the ecosystem.
These bodies are responsible for security, data research, core functionality development, network operation, marketing, and business development activities. The key question now is how to establish effective structures quickly to guide Polkadot toward success.
The solution, according to the blockchain’s treasury, is to delegate more responsibility to these executive bodies. These bodies are made up of competent individuals who evaluate new proposals and deliver value. Collectives, similar to subDAOs, have OpenGov capabilities and sub-treasuries to facilitate their work.
By leveraging these executive bodies, Polkadot can outsource operational issues and mundane tasks, allowing OpenGov stakeholders to focus on making critical decisions.
The effectiveness and performance of the executive bodies are evaluated, and budget allocations are negotiated with OpenGov based on the results.
At the time of writing, DOT is trading at $6.35, representing a price recovery of nearly 4% in the 24-hour time frame. However, the 17th largest cryptocurrency by market cap is still down 10% over the past month.
Featured image from DALL-E, chart from TradingView.com


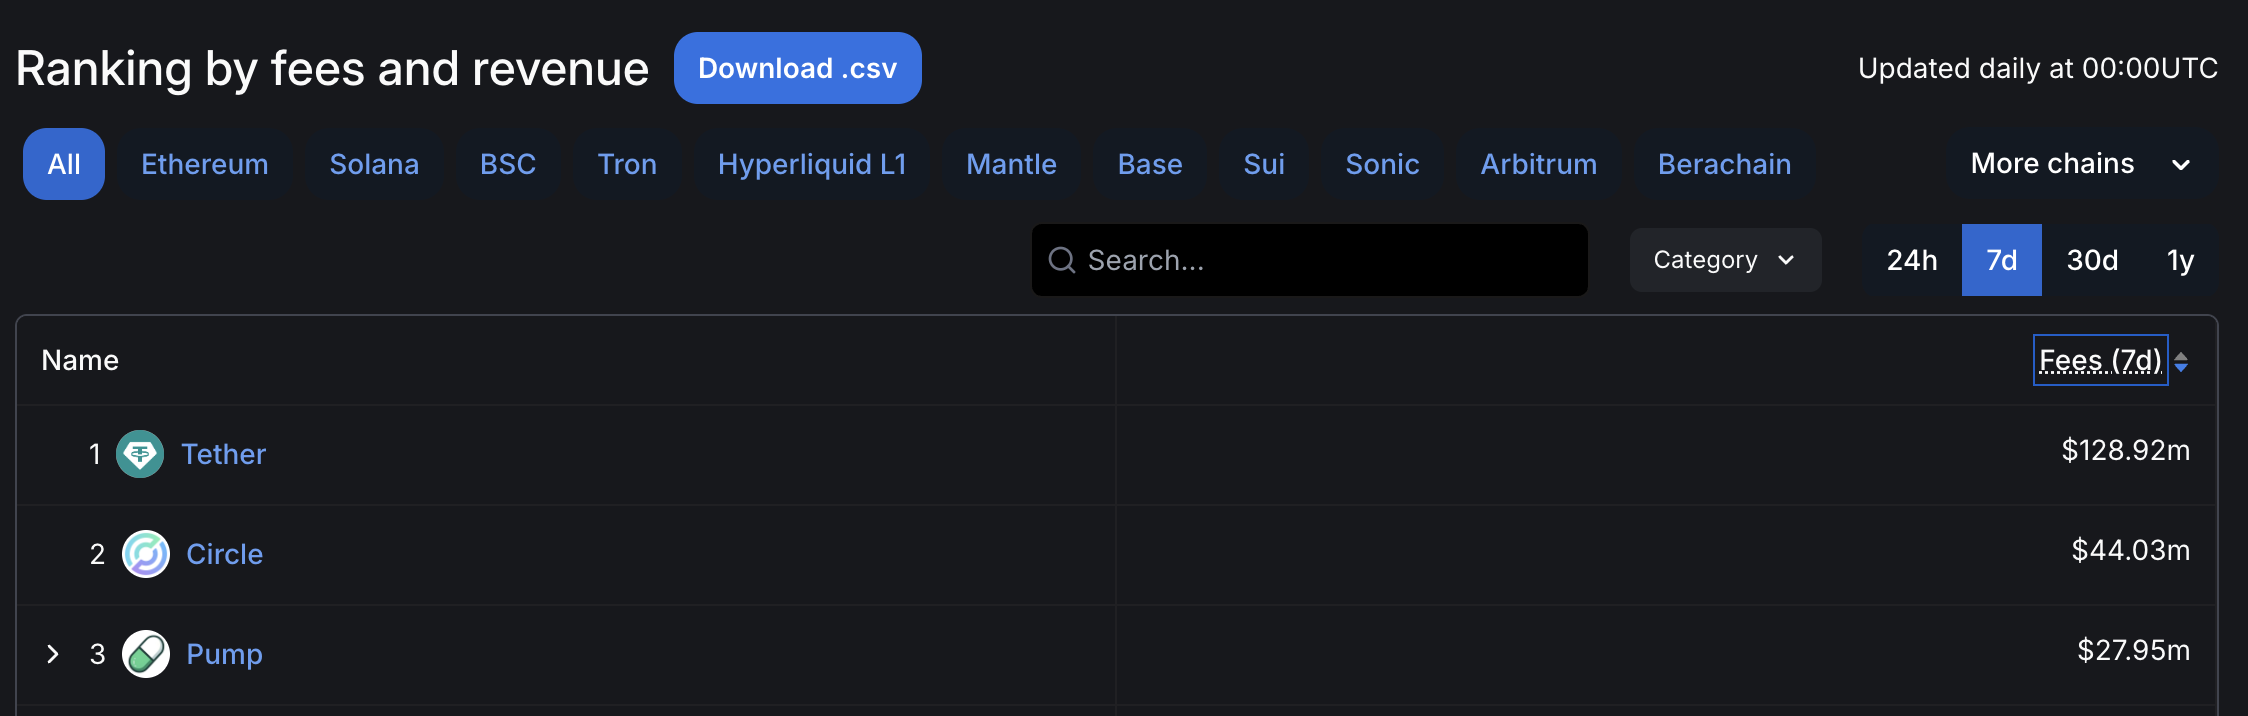
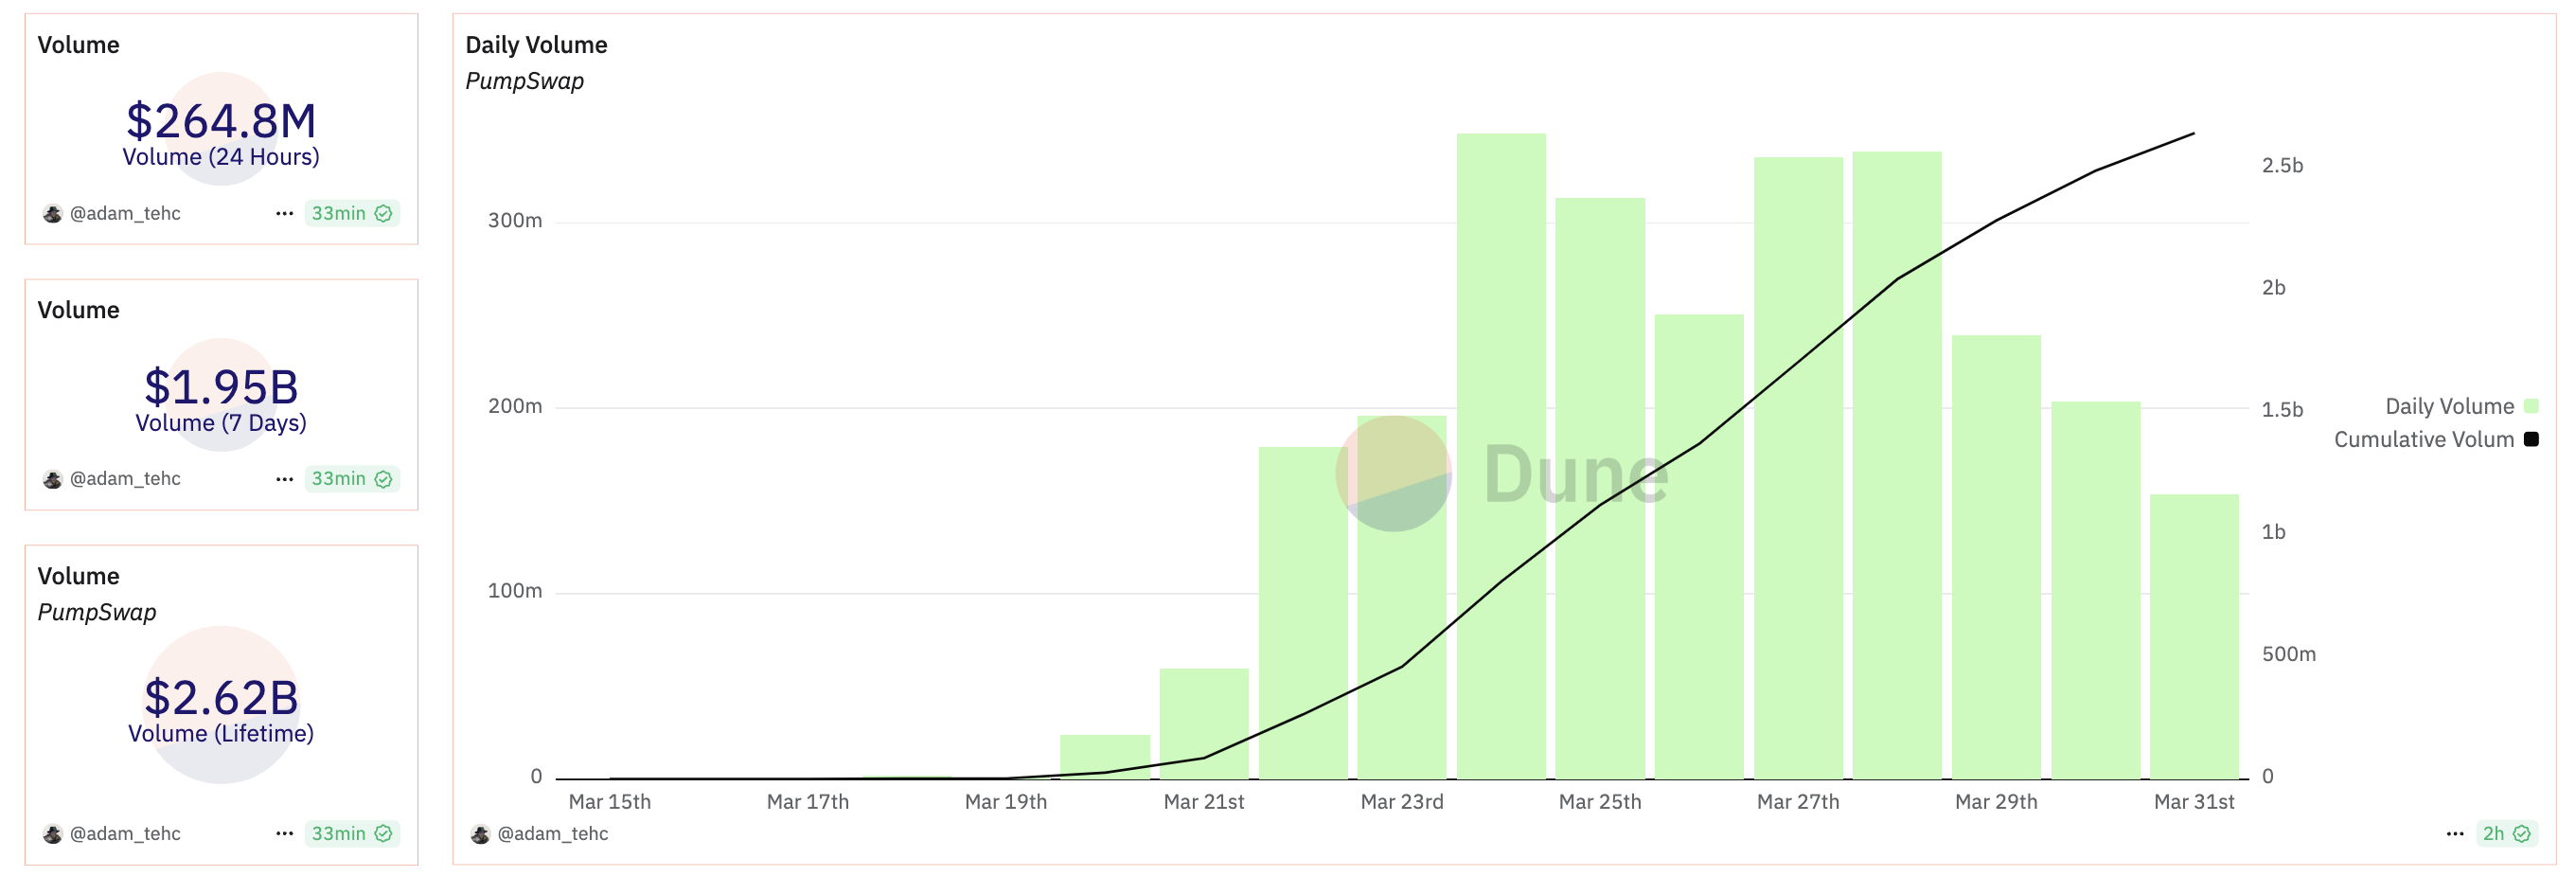
Since launching PumpSwap, token launchpad Pump.fun has resumed its position as a top-level protocol by fees and revenue. It saw over $2.62 billion in volume in less than two weeks, signifying high market interest.
Nonetheless, the meme coin sector as a whole has been more volatile than usual lately. PumpSwap is an attractive new option, but it still needs to stand the test of time.
Pump.fun Surges with PumpSwap
Pump.fun, a prominent meme coin creation platform, recently suffered some difficulties in the market. Facing lawsuits and criticism from the industry, the platform’s revenue had been declining in 2025. However, since launching PumpSwap, Pump.fun’s income has rebounded, making it one of the largest protocols by fees and revenue.
PumpSwap is a decentralized exchange on Solana’s blockchain, and it has grown very quickly since its launch less than two weeks ago. It has already managed over $2.62 billion in trade volume, although its daily volume fell over the weekend. Pump.fun’s cofounder spoke highly about PumpSwap, calling it a “crucial step that will help grow the ecosystem.”
Pump.fun’s overall revenues were declining before it launched PumpSwap, and they have since jumped back up. However, it’s important to not overstate the new exchange’s success. The exchange’s total fees collected have skyrocketed compared to Pump.fun, but the actual revenue growth has been comparatively small.
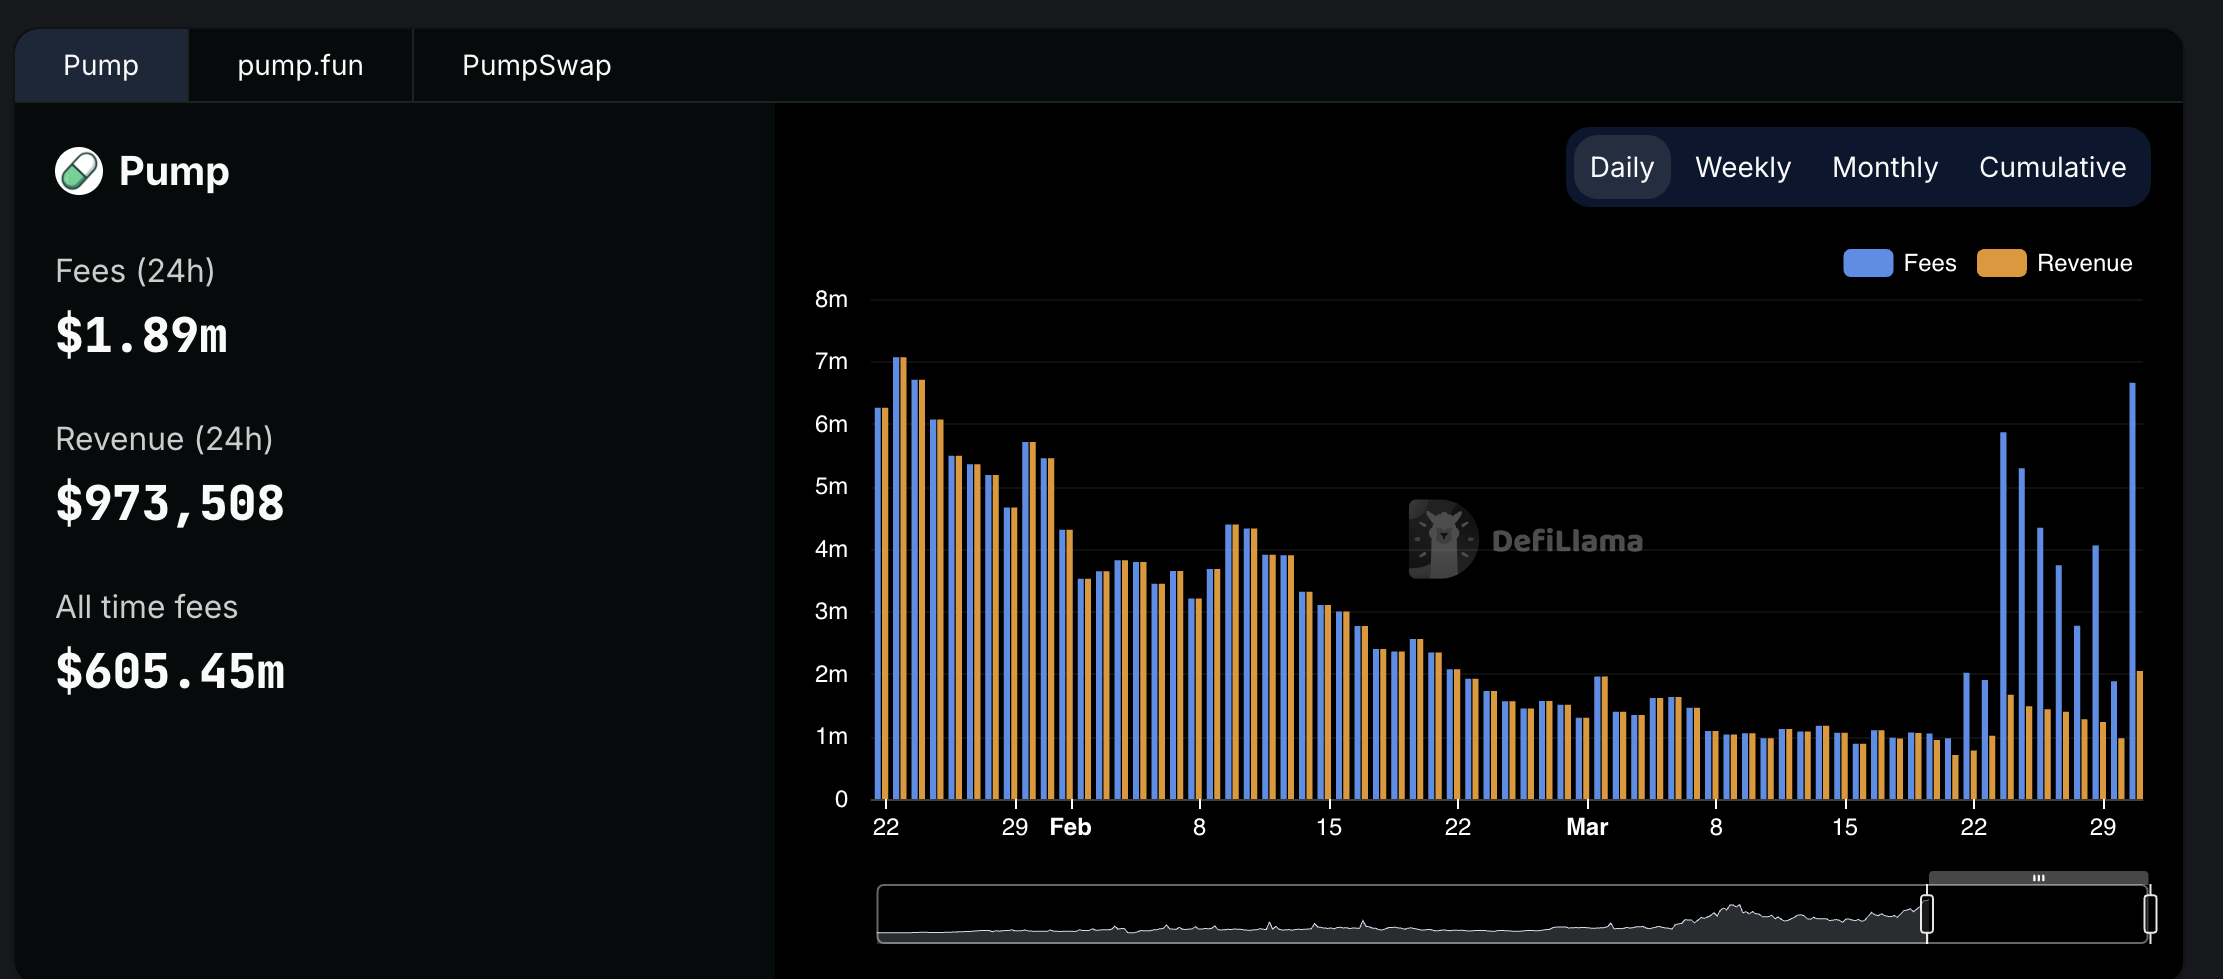
Still, these low fees also have significant advantages. Demand seems to be drying up in the meme coin sector, but Pump.fun faces stiff competition in the form of firms like Raydium, using low fees as a competitive edge. It has also promised things like revenue sharing with token creators to promote ecosystem growth.
Ultimately, the meme coin market as a whole is full of uncertainty. PumpSwap has been able to keep Pump.fun competitive as a top-level platform in this space, giving it a welcome reprieve. The real challenge will come in determining long-term viability.
Disclaimer
In adherence to the Trust Project guidelines, BeInCrypto is committed to unbiased, transparent reporting. This news article aims to provide accurate, timely information. However, readers are advised to verify facts independently and consult with a professional before making any decisions based on this content. Please note that our Terms and Conditions, Privacy Policy, and Disclaimers have been updated.

Hedera (HBAR) is under pressure, down roughly 13.5% over the past seven days, with its market cap holding at around $7 billion. Recent technical signals point to growing bearish momentum, with both trend and momentum indicators leaning heavily negative.
The price has been hovering near a critical support zone, raising the risk of a breakdown below $0.15 for the first time in months. Unless bulls regain control soon, HBAR could face further losses before any meaningful recovery attempt.
HBAR BBTrend Has Been Turning Heavily Down Since Yesterday
Hedera’s BBTrend indicator has dropped sharply to -10.1, falling from 2.59 just a day ago. This rapid decline signals a strong shift in momentum and suggests that HBAR is experiencing an aggressive downside move.
Such a steep drop often reflects a sudden increase in selling pressure, which can quickly change the asset’s short-term outlook.
The BBTrend, or Bollinger Band Trend, measures the strength and direction of a trend using the position of price relative to the Bollinger Bands. Positive values generally indicate bullish momentum, while negative values point to bearish momentum.
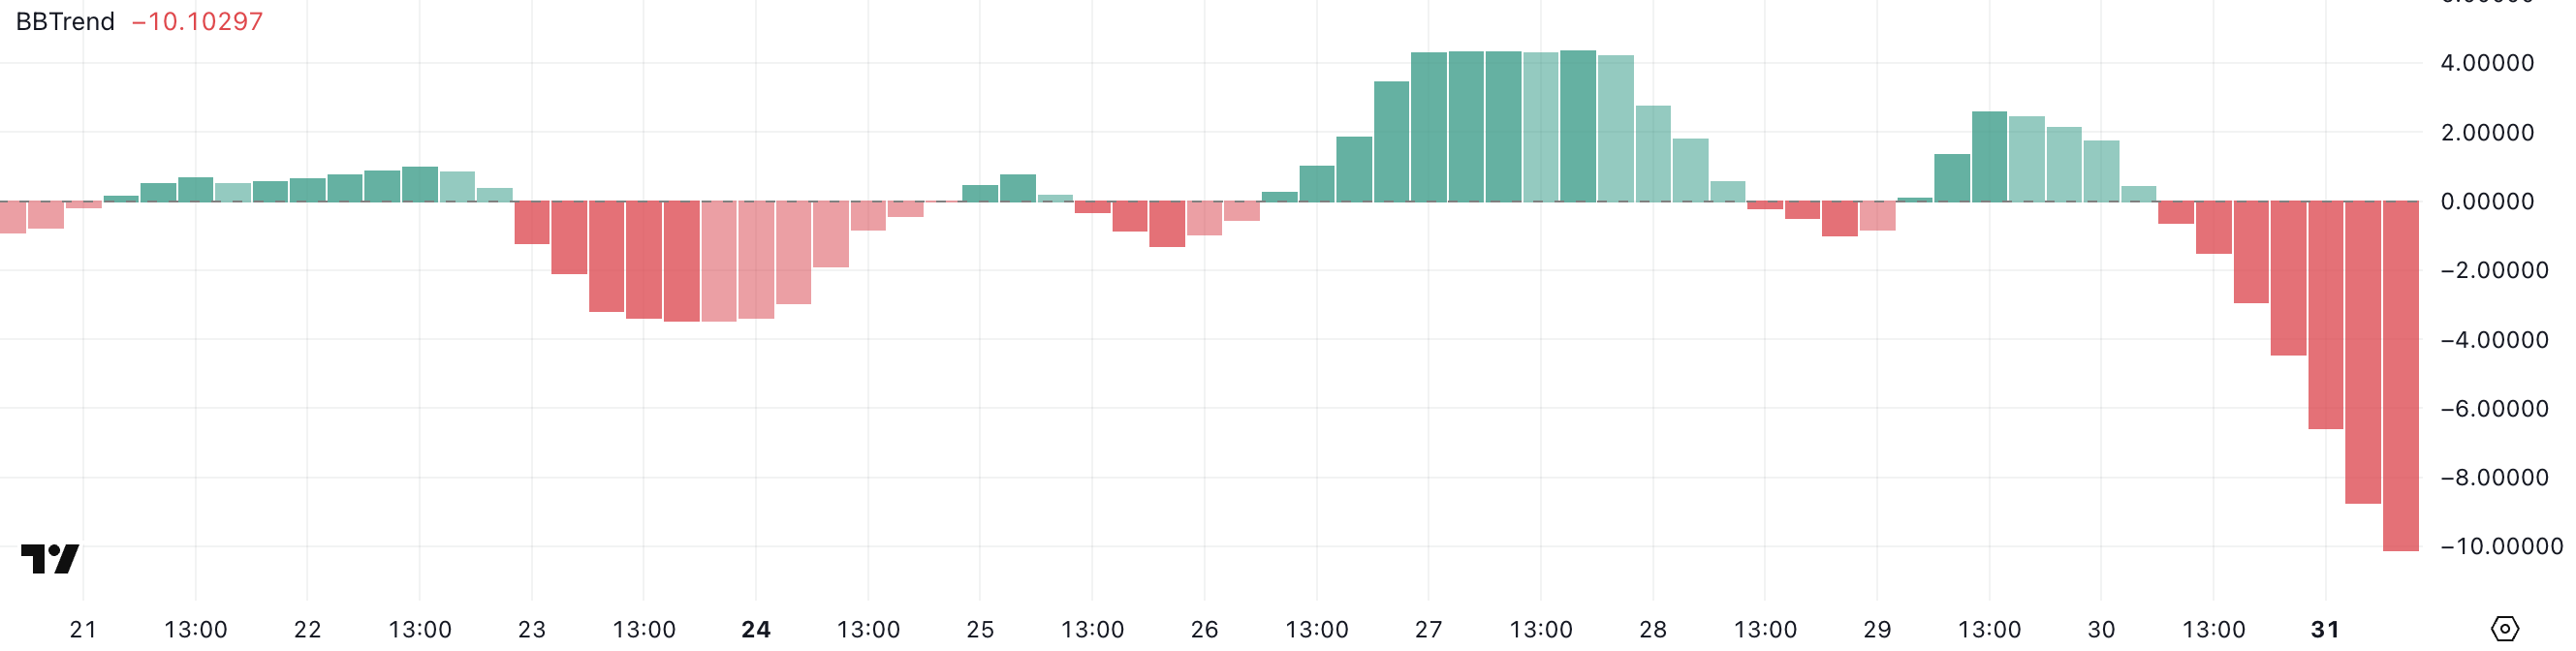
The further the value is from zero, the stronger the trend. HBAR’s BBTrend is now at -10.1, signaling strong bearish momentum.
This suggests that the price is trending lower and doing so with increasing strength, which could lead to further downside unless buyers step in to slow the momentum.
Hedera Ichimoku Cloud Paints a Bearish Picture
Hedera’s Ichimoku Cloud chart reflects a strong bearish structure, with the price action positioned well below both the blue conversion line (Tenkan-sen) and the red baseline (Kijun-sen).
This setup indicates that short-term momentum is clearly aligned with the longer-term downtrend.
The price has consistently failed to break above these dynamic resistance levels, signaling continued seller dominance.
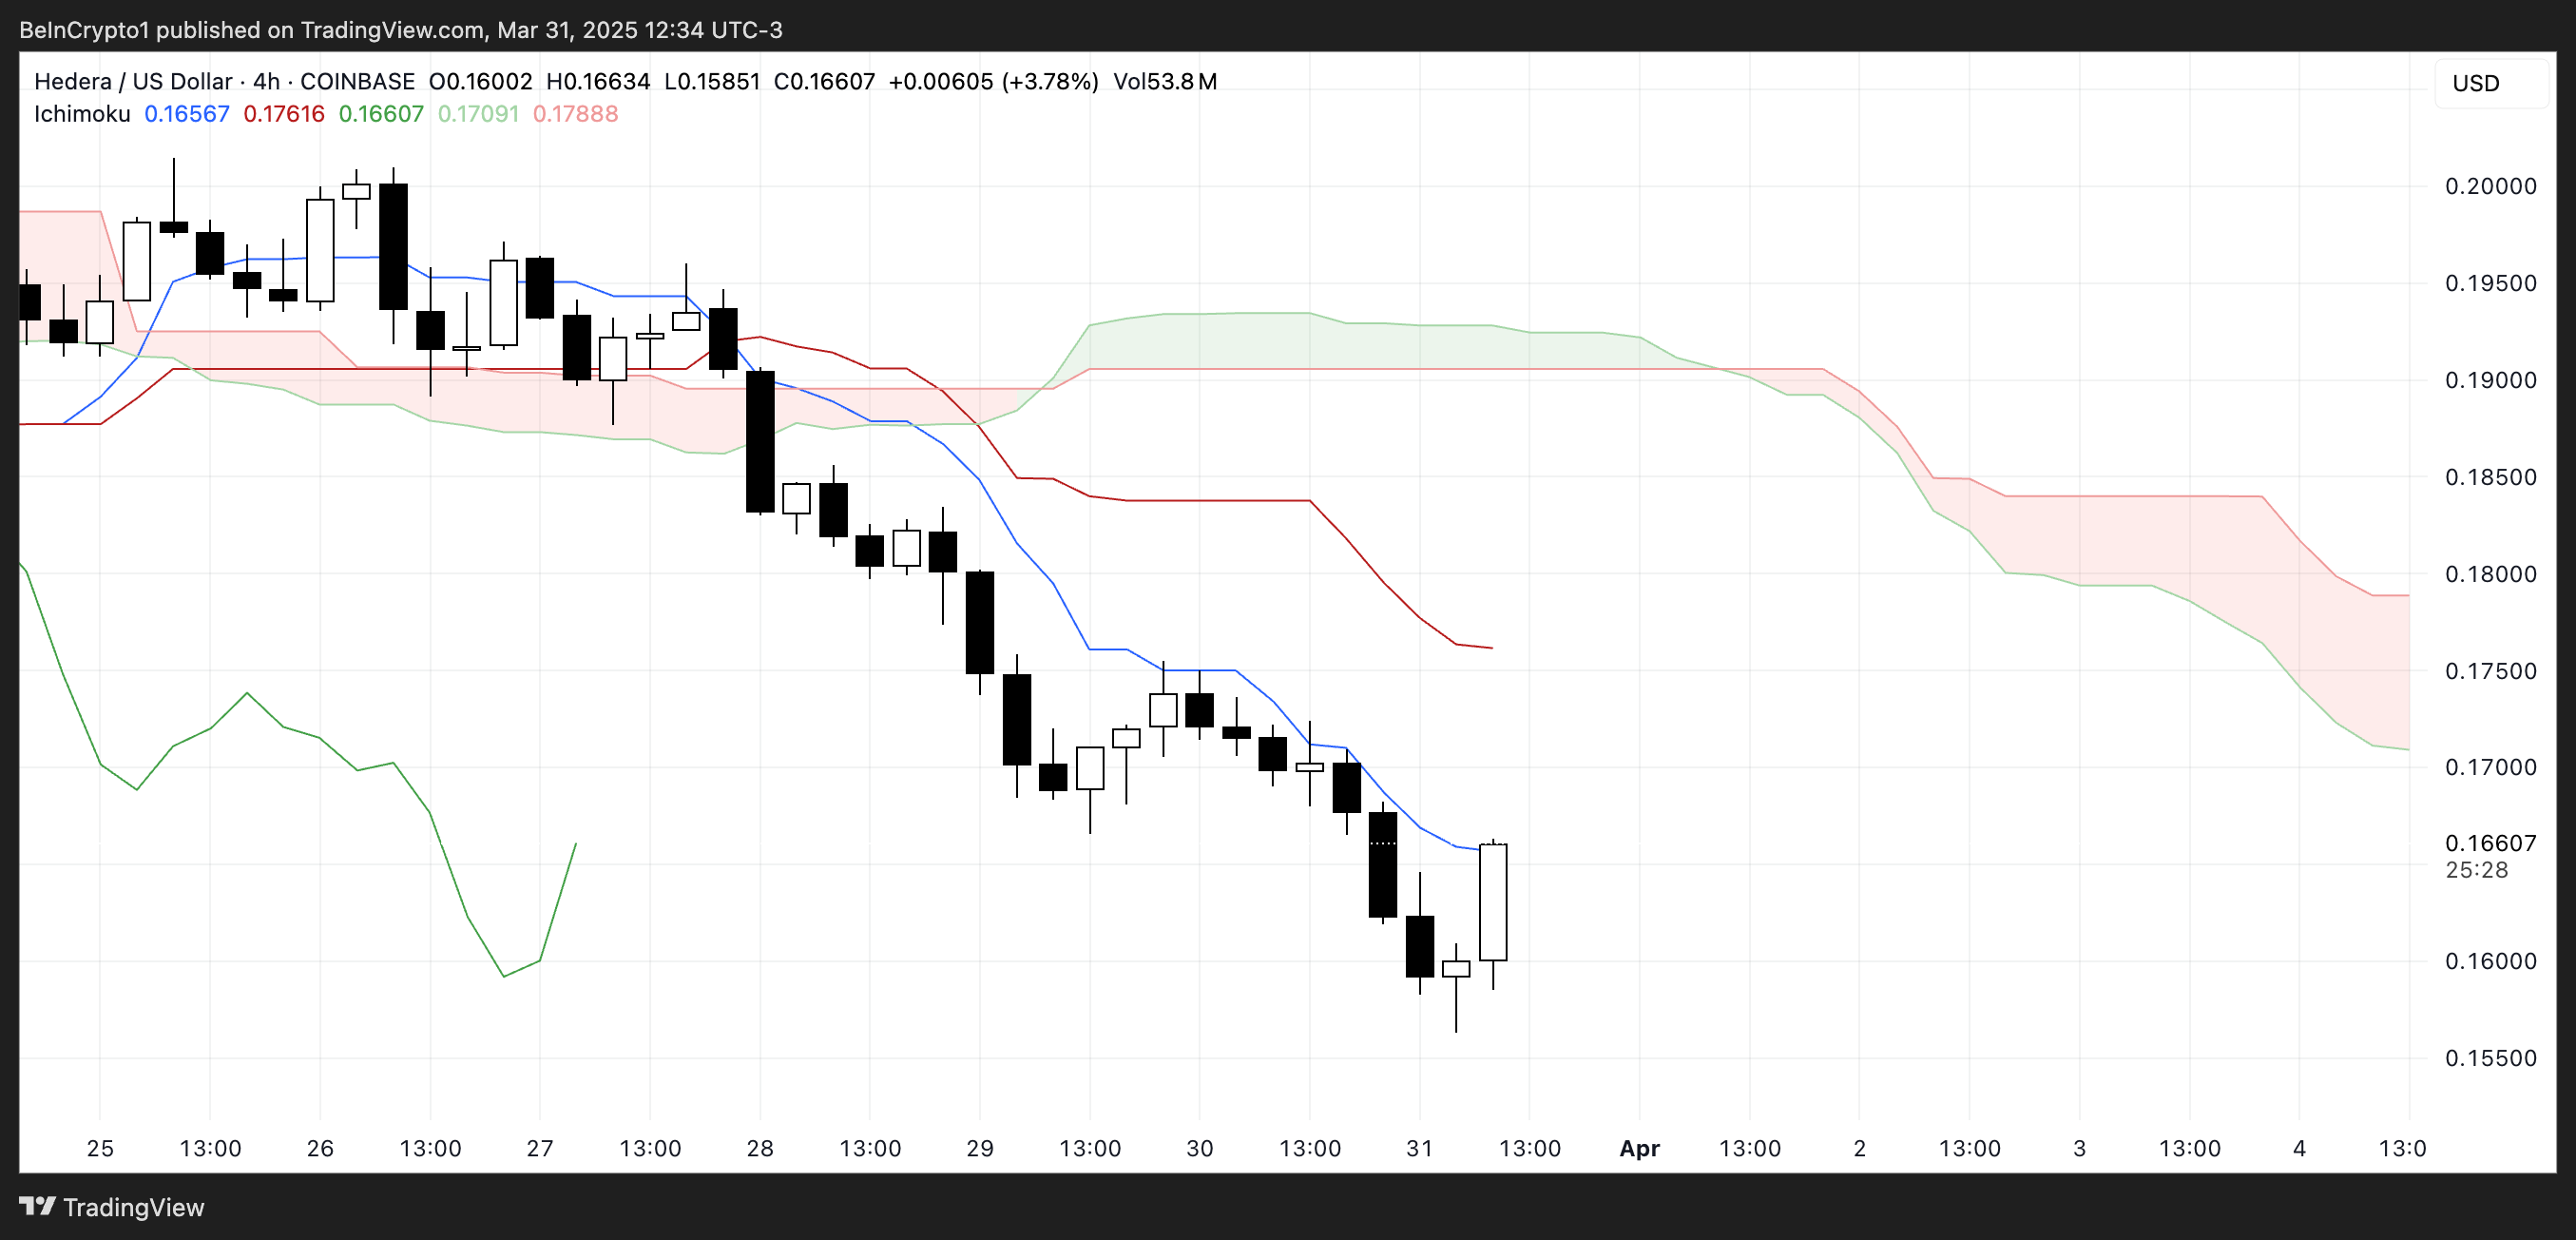
The future cloud is also red and trending downward, suggesting that bearish pressure is expected to persist in the near term.
The span between the Senkou Span A and B lines remains wide, reinforcing the strength of the downtrend. For any potential reversal to gain credibility, HBAR would first need to challenge and break above the Tenkan-sen and Kijun-sen, and eventually push into or above the cloud.
Until then, the current Ichimoku configuration supports a continuation of the bearish outlook.
Can Hedera Fall Below $0.15 Soon?
Hedera price has been hovering around the $0.16 level and is approaching a key support at $0.156.
If this support fails to hold, it could open the door for further downside, potentially pushing HBAR below the $0.15 mark for the first time since November 2024.
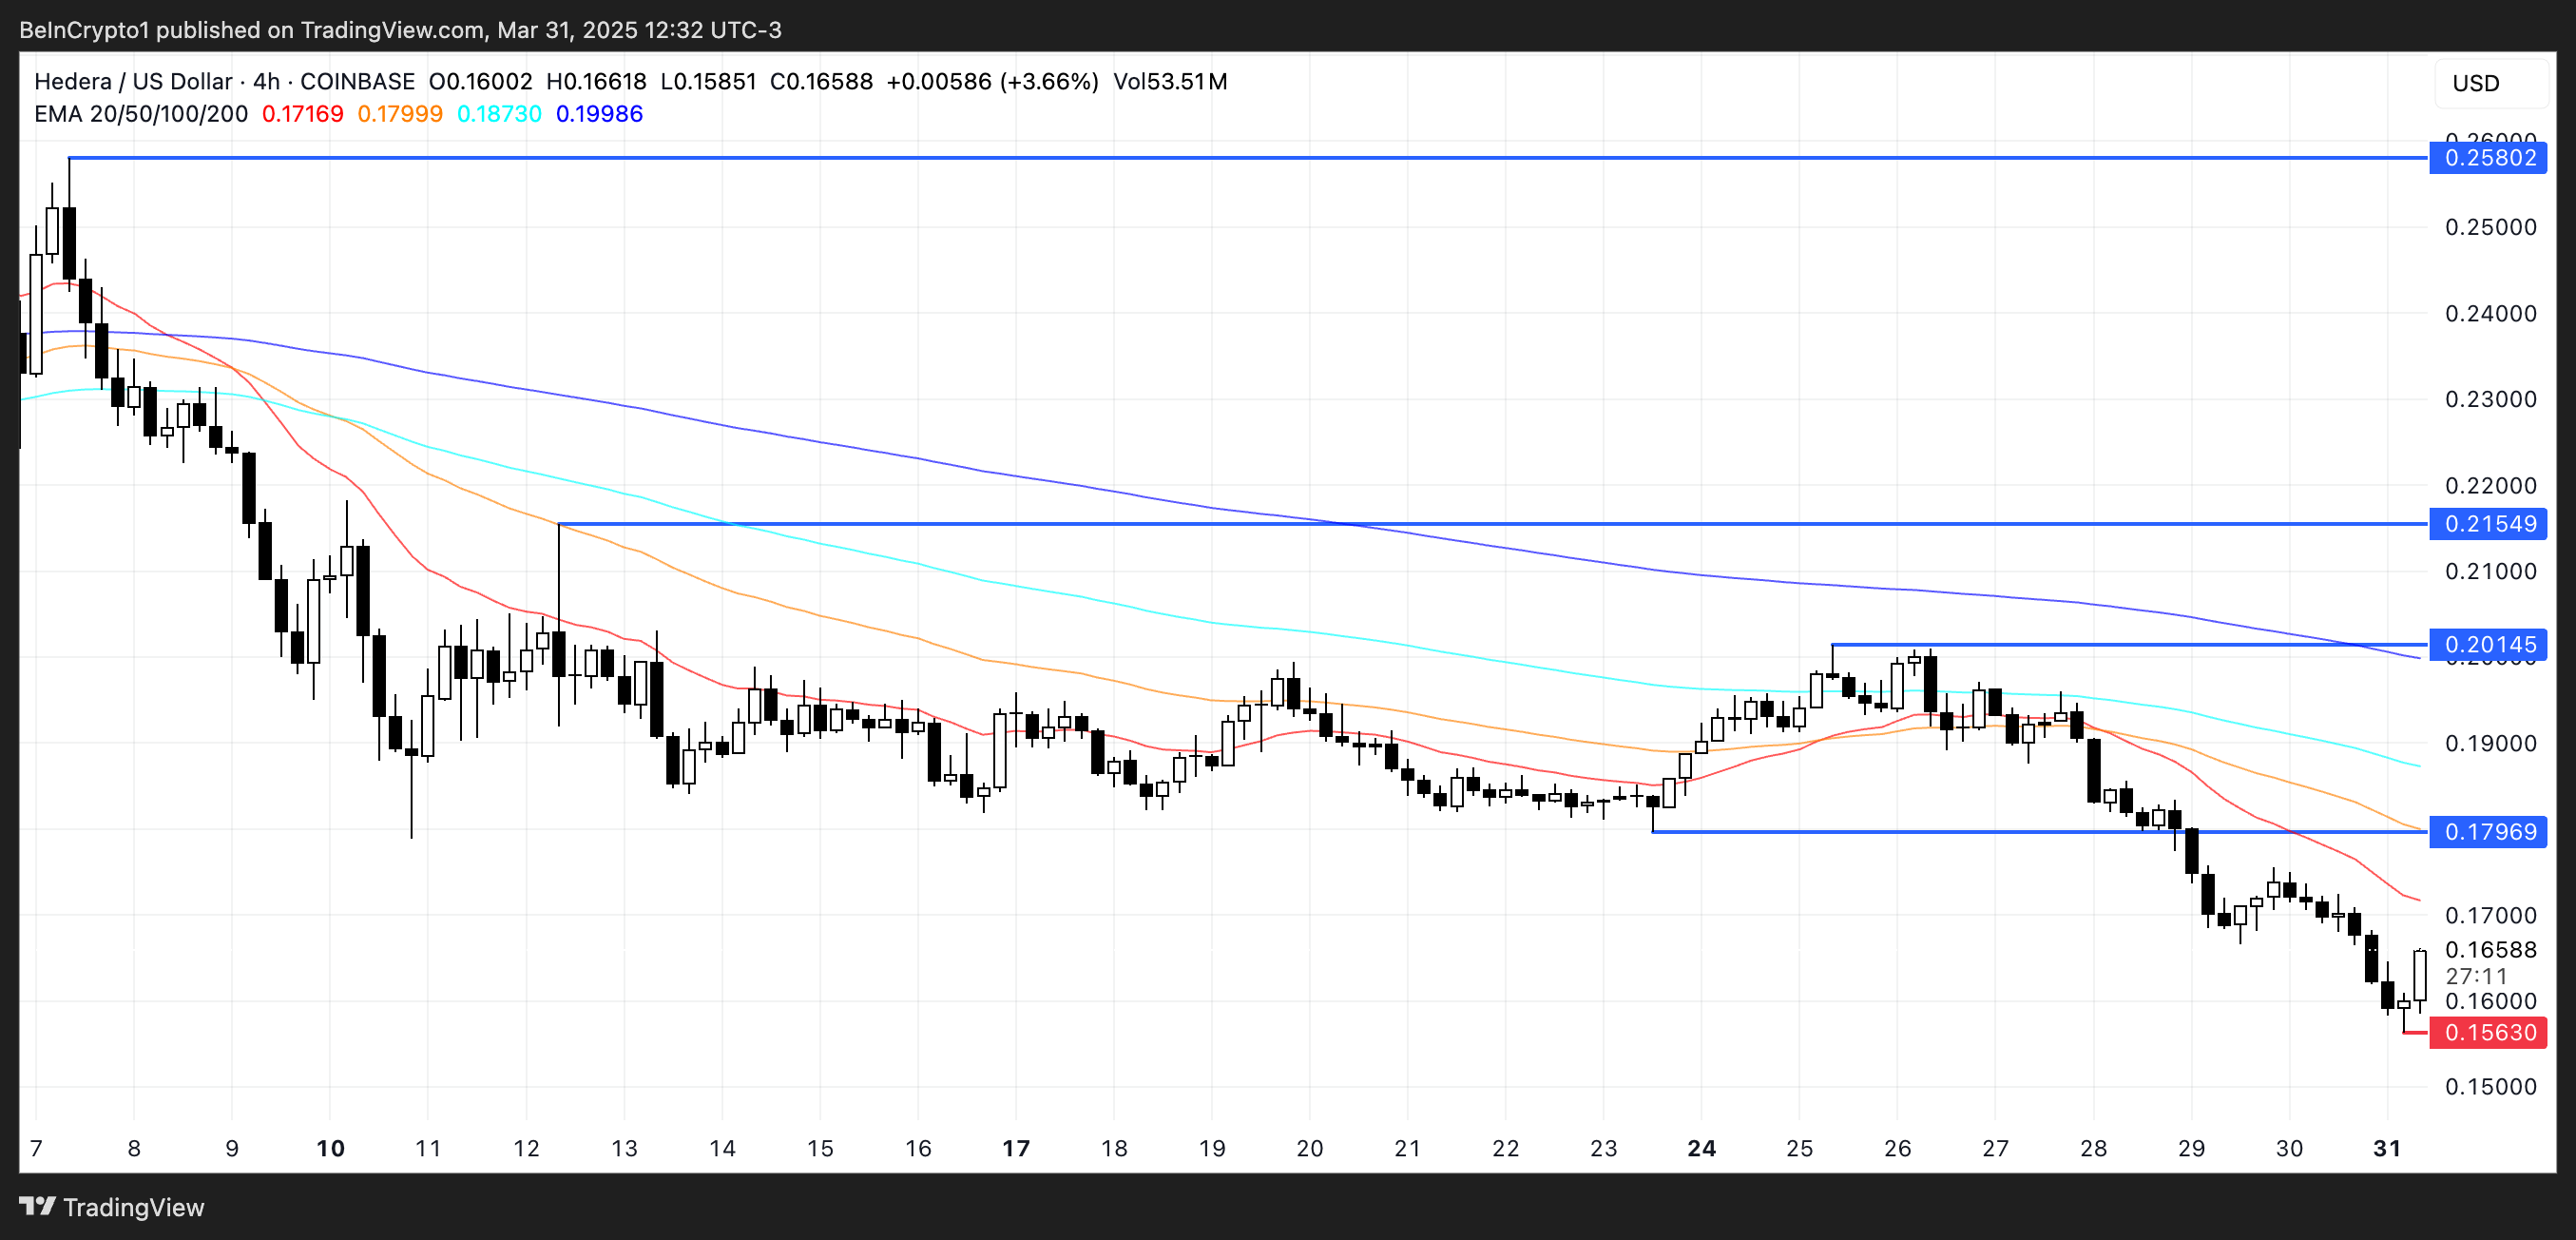
However, if HBAR manages to reverse its current trajectory and regain bullish momentum, the first target to watch is the resistance at $0.179.
A breakout above that level could lead to a stronger rally toward $0.20 and, if momentum continues, even reach $0.215. In a more extended bullish scenario, HBAR could climb to $0.25, signaling a full recovery and trend reversal.
Disclaimer
In line with the Trust Project guidelines, this price analysis article is for informational purposes only and should not be considered financial or investment advice. BeInCrypto is committed to accurate, unbiased reporting, but market conditions are subject to change without notice. Always conduct your own research and consult with a professional before making any financial decisions. Please note that our Terms and Conditions, Privacy Policy, and Disclaimers have been updated.


Coinbase asked a DC District Court if it could resume its old lawsuit against the FDIC. Coinbase sued this regulator over Operation Choke Point 2.0 and claimed that it’s still refusing to release relevant information.
Based on the information available so far, it’s difficult to draw definitive conclusions. The FDIC maintains that it responded to its opponents’ questions truthfully, though it has shown delays in the past.
Coinbase vs the FDIC
Coinbase, one of the world’s largest crypto exchanges, has been in a few fights with the FDIC. The firm has been pursuing the FDIC over Operation Choke Point 2.0 for months now, and has achieved impressive results. Despite this, however, Coinbase is asking the DC District Court to resume its litigation against the regulator:
“We’re asking the Court to resume our lawsuit because the FDIC has unfortunately stopped sharing information. While we would have loved to resolve this outside of the legal system – and we do appreciate the increased cooperation we’ve seen from the new FDIC leadership – we still have a ways to go,” claimed Paul Grewal, Coinbase’s Chief Legal Officer.
The FDIC has an important role in US financial regulation, primarily dealing with banks. This gave it a starring role in Operation Choke Point 2.0, hampering banks’ ability to deal with crypto businesses. However, it recently started a pro-crypto turn, releasing tranches of incriminating documents and revoking several of its anti-crypto statutes.
Grewal said that he “appreciated the increased cooperation” from the FDIC but that the cooperation stopped weeks ago. According to Coinbase’s filing, the FDIC hasn’t sent any new information since late February and claimed in early March that the exchange’s subsequent requests were “unreasonable and beyond the scope of discovery.”
On one hand, the FDIC has previously been slow to make relevant disclosures in the Coinbase lawsuit. On the other hand, Operation Choke Point 2.0 sparked significant tension within the industry, and a determined group is now aiming to significantly weaken the regulatory bodies involved.
Until the legal battle continues, it’ll be difficult to make any definitive statements. The FDIC will likely have two weeks to respond to Coinbase’s request.
Disclaimer
In adherence to the Trust Project guidelines, BeInCrypto is committed to unbiased, transparent reporting. This news article aims to provide accurate, timely information. However, readers are advised to verify facts independently and consult with a professional before making any decisions based on this content. Please note that our Terms and Conditions, Privacy Policy, and Disclaimers have been updated.

This is Why PumpSwap Brings Pump.fun To the Next Level

Hedera (HBAR) Bears Dominate, HBAR Eyes Key $0.15 Level

Charles Hoskinson Reveals How Cardano Will Boost Bitcoin’s Adoption

Coinbase Tries to Resume Lawsuit Against the FDIC

Ethereum Bitcoin Ratio Drops to Record Low, What Next for ETH?

BlackRock’s Larry Fink Thinks Crypto Could Harm The Dollar

2.52 Million Altcoins Are Ruining Crypto’s Future

Animoca Brands Valuation Tanks 75% In Two Years, Here’s Why

Crypto exchange BingX hacked for $43 million

Are The Big Players Losing Interest?

Hong Kong’s Securities Association Tips Authorities On Crypto Self-Regulation

Coinbase cbBTC Set to go Live on Solana
2.52 Million Altcoins Are Ruining Crypto’s Future
Animoca Brands Valuation Tanks 75% In Two Years, Here’s Why
Crypto exchange BingX hacked for $43 million
Are The Big Players Losing Interest?
Hong Kong’s Securities Association Tips Authorities On Crypto Self-Regulation
Coinbase cbBTC Set to go Live on Solana
-

 Market19 hours ago
Ethereum Price Weakens—Can Bulls Prevent a Major Breakdown?
-

 Market20 hours ago
Bitcoin Bears Tighten Grip—Where’s the Next Support?
-
 Altcoin11 hours ago
$33 Million Inflows Signal Market Bounce
-

 Market18 hours ago
XRP Price Fate Hangs on $2.00—Major Move Incoming?
-

 Ethereum11 hours ago
Ethereum To $20K? Investor Says Real-World Adoption Is The Key
-

 Market17 hours ago
Dogecoin (DOGE) Bulls In Trouble—Can They Prevent a Drop Below $0.15?
-
 Bitcoin11 hours ago
BTC Price Rebound Likely as Long-Term Holders Reenter Market
-
 Market16 hours ago
Bitcoin Price Nears $80,000; Fuels Death Cross Potential