
Market
Fantom (FTM) Price up 8% With Spiking Trading Volume

The surge in Fantom’s (FTM) price in the last 24 hours has caused most transactions involving the altcoin to end in profit.
With an 8% price uptick, Fantom ranks as the eighth cryptocurrency asset with the most gains during that period.
Fantom Rally Puts Holders in Gains
As of this writing, Fantom (FTM) trades at $0.59. The past 24 hours have also witnessed a spike in the coin’s trading volume. Totaling $116 million at press time, it has risen by 82% during the period in consideration.
The surge in FTM’s price has put many of its holders in gains in the last 24 hours. An assessment of FTM’s daily ratio of transaction volume in profit to loss shows that it has risen to 4.29, its highest level since April 8.
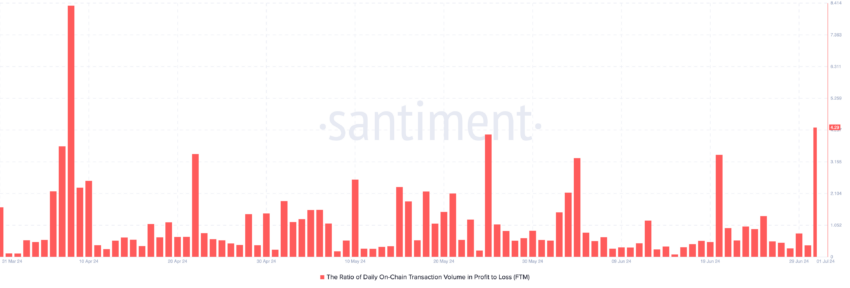
This metric measures the daily ratio of transaction volume in profit to loss. It compares the volume of transactions that result in a profit to those that end in a loss within a single day.
A high/positive ratio indicates that more transactions are being conducted at a profit, suggesting bullish sentiment. In comparison, a low/negative ratio implies more transactions end in a loss, indicating bearish sentiment.
A4 4.29, this metric implies that for every FTM transaction that returns a loss, 4.29 transactions end in a profit.
Despite this, most addresses holding FTM are “out of the money.” An address is said to be out of the money when the current price of an asset is lower than the average price at which it acquired the asset.
Currently, 52,600 addresses, representing 48% of all FTM holders, are currently in a loss position.
Read More: Top 5 Yield Farms on Fantom
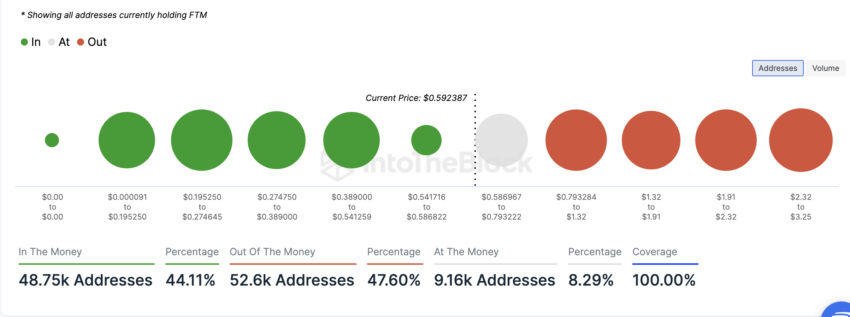
Conversely, 48,750 addresses, making up 44% of all coin holders, are “in the money,” meaning they are holding at a profit.
FTM Price Prediction: Buyers Propel Price Rally
Readings from the coin’s price movement on a one-day chart confirm the bullish bias toward FTM. Its Moving Average Convergence Divergence (MACD) initiated a bullish crossover on June 24, and the buyers have since been in control.
This indicator tracks an asset’s price momentum and identifies potential trend reversals. A bullish crossover occurs when the MACD line (blue) intersects the signal (orange) in an uptrend.
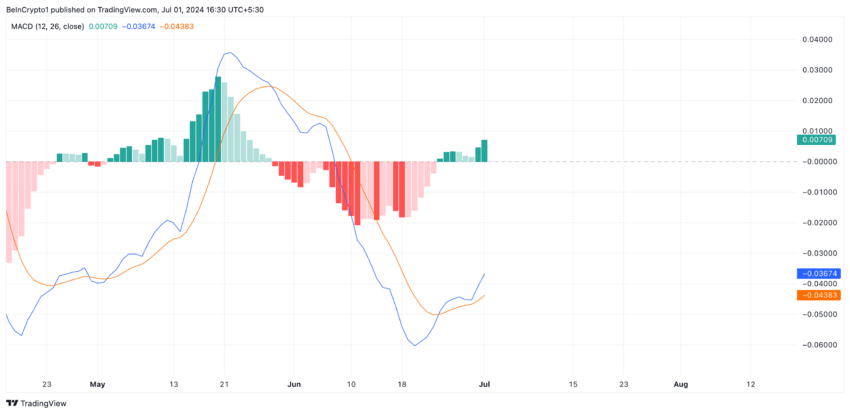
When the MACD line crosses above the signal line, it is considered bullish. Traders view it as an opportunity to enter long positions in anticipation of further price increases.
If FTM buying pressure is sustained, the altcoin’s price might rally to $0.60.
Read More: 9 Best Fantom (FTM) Wallets In 2024
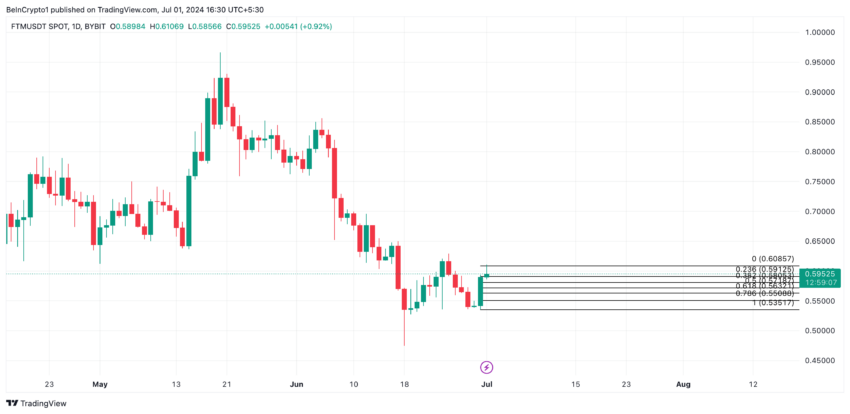
However, if FTM holders begin to sell more due to the high profits from daily transactions, this may put downward pressure on its price, causing it to fall to $0.58.
Disclaimer
In line with the Trust Project guidelines, this price analysis article is for informational purposes only and should not be considered financial or investment advice. BeInCrypto is committed to accurate, unbiased reporting, but market conditions are subject to change without notice. Always conduct your own research and consult with a professional before making any financial decisions. Please note that our Terms and Conditions, Privacy Policy, and Disclaimers have been updated.


A coalition of US Senators is raising serious concerns about a potential conflict of interest involving President Donald Trump and an upcoming stablecoin project called USD1.
The digital asset, backed by World Liberty Financial (WLF), has drawn scrutiny due to Trump’s reported ties to the company behind it.
Warren-Led Group Flags Risks of Presidential Involvement in USD1 Approval
On March 28, a group of lawmakers led by Senator Elizabeth Warren sent a letter to the Federal Reserve and the Office of the Comptroller of the Currency (OCC).
They asked both agencies to clarify how they plan to uphold regulatory integrity regarding the impending USD1 stablecoin.
The request comes as Congress considers the GENIUS Act, a bill that would grant the Fed and OCC broad authority over stablecoin regulation.
“The President of the United States could sign legislation that would facilitate his own product launch and then retain authority to regulate his own financial company,” they noted.
The Senators warned that allowing a sitting president to profit from a digital currency regulated by federal agencies under his influence poses a major threat to financial stability. They argue that such a situation is without precedent and could erode public trust in the regulatory process.
“The launch of a stablecoin directly tied to a sitting President who stands to benefit financially from the stablecoin’s success presents unprecedented risks to our financial system,” They argued.
The letter outlines scenarios where Trump could directly or indirectly influence decisions involving USD1.
For instance, the President could interfere with the OCC’s evaluation of the stablecoin’s application or discourage enforcement actions against WLF.
They also suggested that Trump could pressure the Federal Reserve to provide emergency financial support for USD1 during market volatility—support that may not extend to competing stablecoins.
“[Trump] could also attempt to direct the Fed to establish a master account at the central bank for WLF. He could intervene to deny such assistance to USD1’s competitors,” the lawmakers stressed.
In addition, the Senators noted that the GENIUS Act contains no conflict-of-interest provisions that would prevent Trump from using his office to benefit financially from the stablecoin’s success.
This absence of guardrails, they say, opens the door to regulatory favoritism and economic manipulation.
Considering this, the lawmakers demanded clarification on how the Fed and OCC would handle key issues. These include the approval process for USD1, the potential creation of liquidity support during crises, and WLF’s oversight of potentially unsafe business practices.
The agencies must submit their responses by April 11, 2025. The letter was signed by Senators Elizabeth Warren, Ron Wyden, Chris Van Hollen, Jack Reed, and Cory Booker.
Disclaimer
In adherence to the Trust Project guidelines, BeInCrypto is committed to unbiased, transparent reporting. This news article aims to provide accurate, timely information. However, readers are advised to verify facts independently and consult with a professional before making any decisions based on this content. Please note that our Terms and Conditions, Privacy Policy, and Disclaimers have been updated.

Ethereum (ETH) is under pressure once again, dropping around 3% in the last 24 hours and falling below the $1,800 level. This decline is putting several large leveraged positions at risk, including two massive whale vaults on Maker that collectively hold over $235 million worth of ETH.
With on-chain indicators flashing warning signs and technical levels being tested, the stakes are rising for both bulls and bears. As ETH hovers near critical support, the coming days could prove pivotal for its short-term price trajectory.
Ethereum Whales Could Get Liquidated
Ethereum has dropped around 3% in the past 24 hours, slipping below the $1,900 mark once again. This decline is putting pressure on large leveraged positions within the DeFi ecosystem.
According to on-chain data from Lookonchain, two major whale vaults on Maker—one of the leading decentralized lending protocols—are now approaching critical levels.
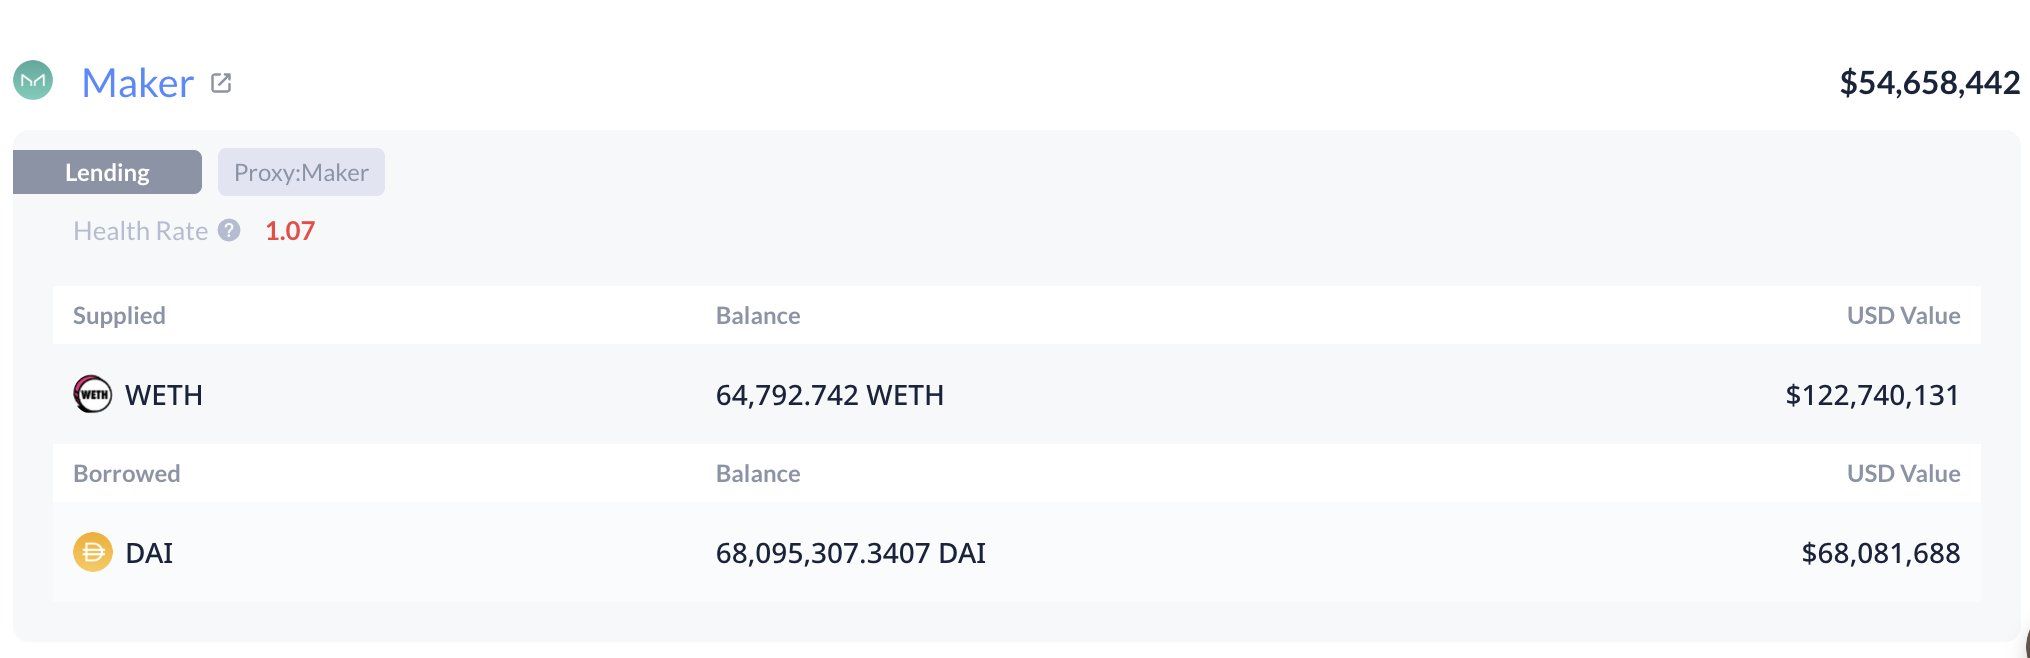
Together, these vaults hold 125,603 ETH, valued at approximately $235 million. With ETH’s price nearing their liquidation thresholds, both vaults are at risk of being forcibly closed if the downward trend continues.
In Maker’s system, users can deposit ETH into vaults as collateral to borrow the DAI stablecoin. To avoid liquidation, the collateral must stay above a certain health ratio—essentially a safety buffer.
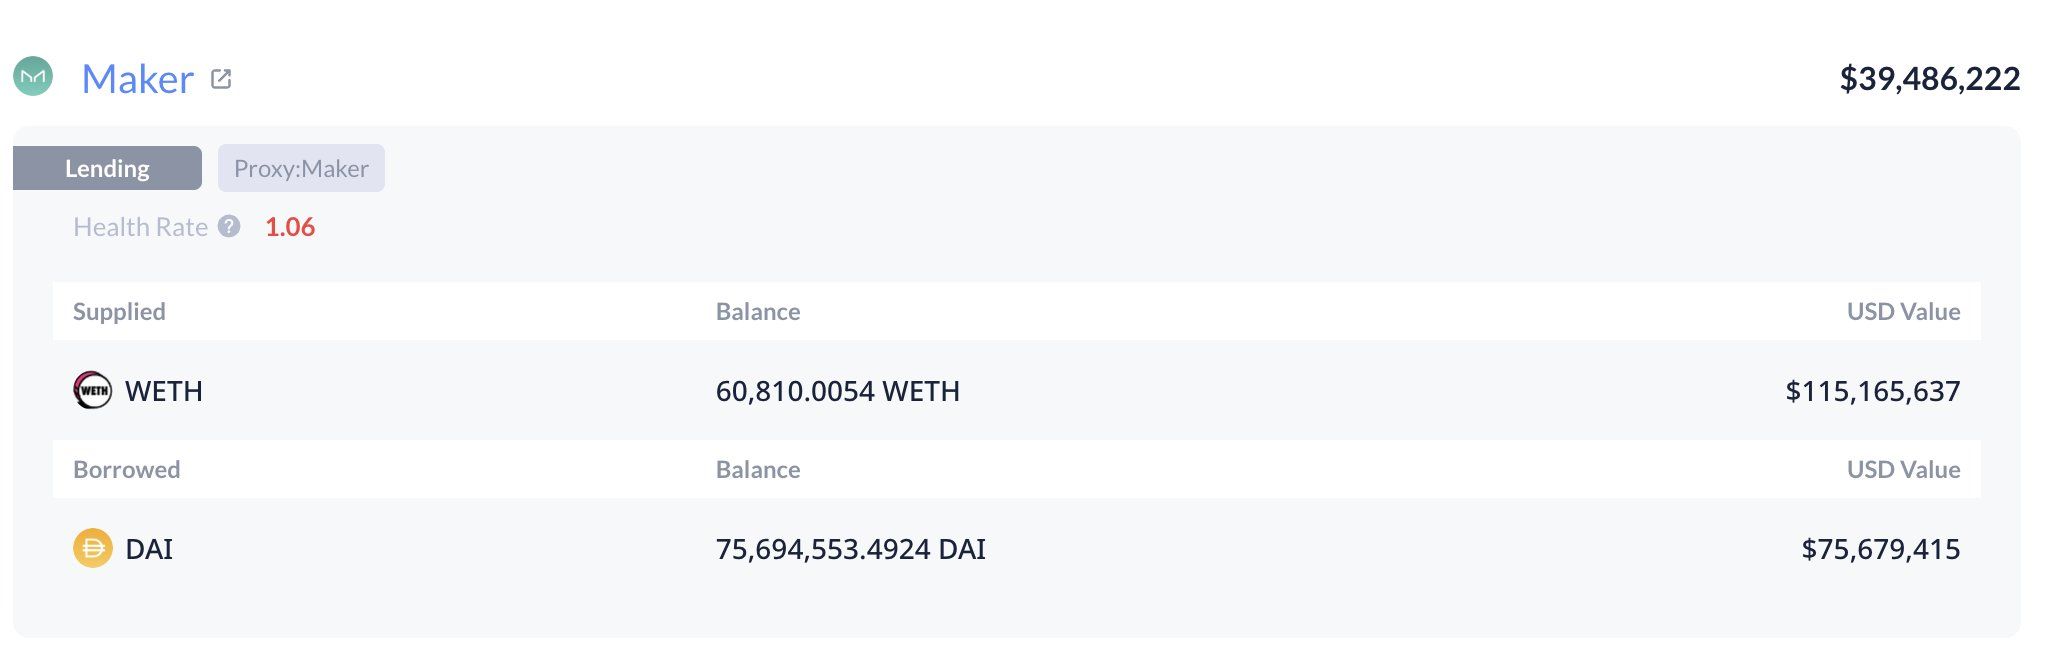
When that buffer gets too low, the protocol automatically sells off the collateral to cover the debt. In this case, the health ratio of the whale positions has fallen to just 1.07, dangerously close to the minimum threshold.
One vault faces liquidation at an ETH price of $1,805, and the other at $1,787. If ETH continues to dip, these vaults could trigger significant sell pressure, potentially accelerating the downward move.
Indicators Suggest The Downtrend Could Continue
Ethereum’s recent price drop has pushed its Relative Strength Index (RSI) back into oversold territory, currently sitting at 24.37. Just three days ago, the RSI was at 58.92, indicating how quickly sentiment has shifted.
The RSI is a momentum indicator that measures the speed and change of price movements, with readings below 30 typically signaling that an asset is oversold.
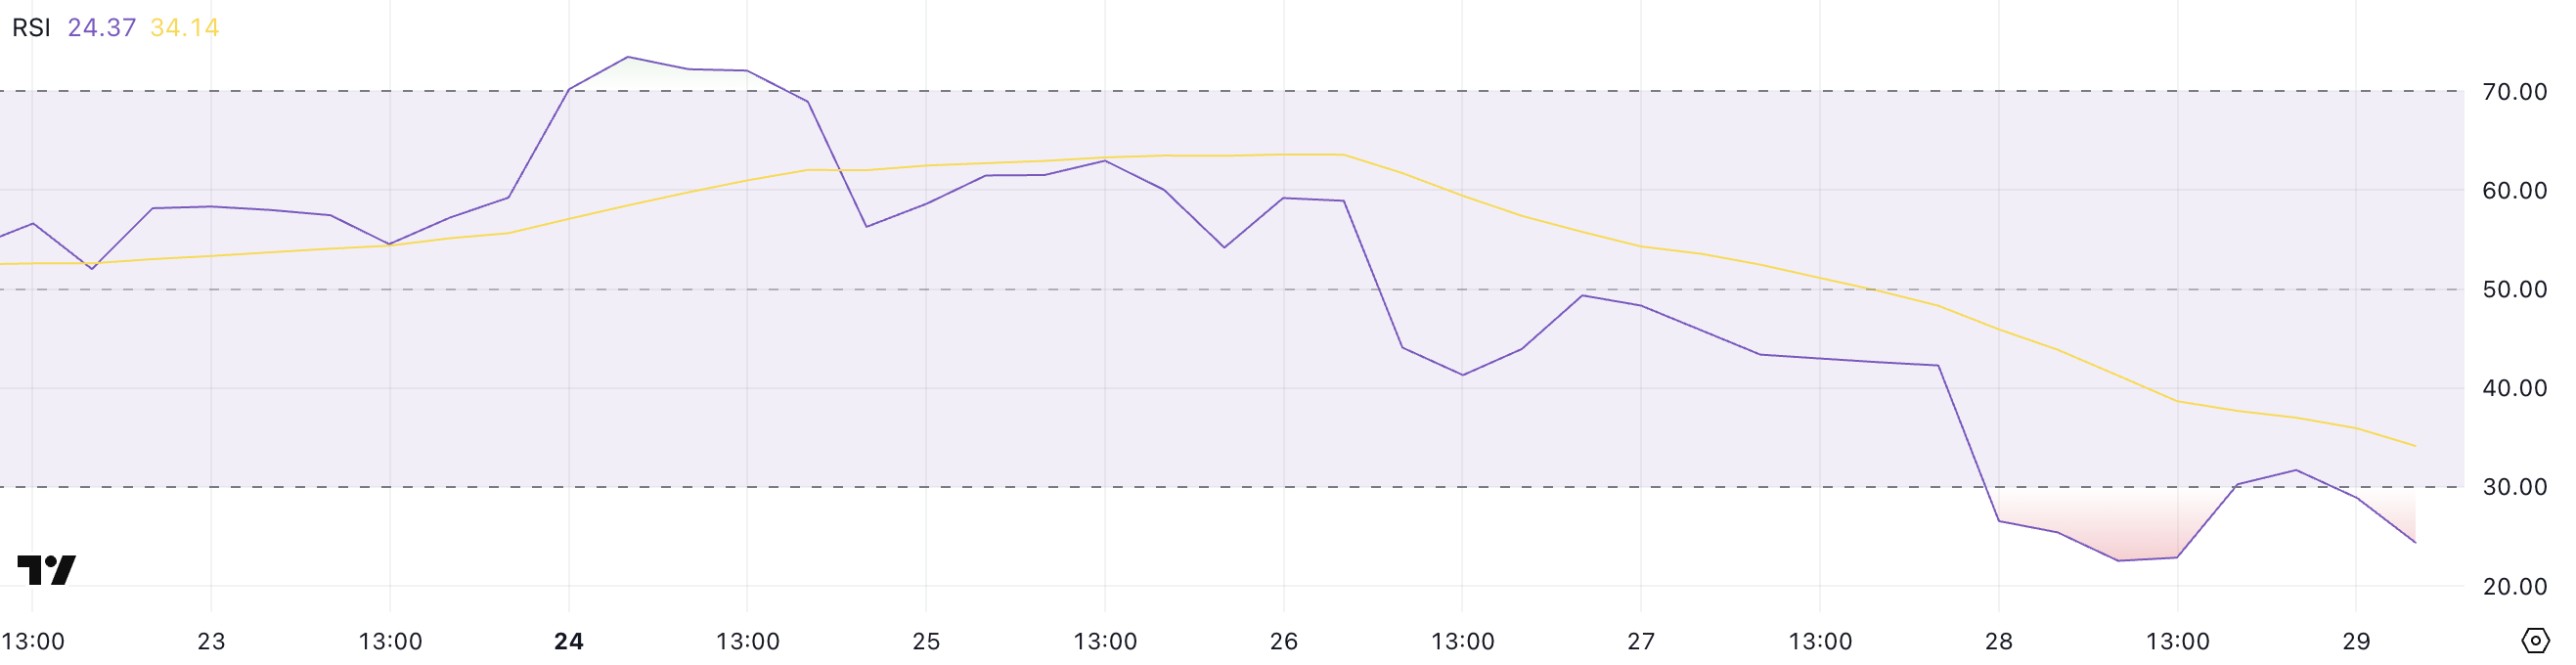
While this suggests that Ethereum may be due for a short-term bounce or relief rally, historical data shows that RSI can remain oversold for extended periods—or even drop further—if bearish momentum stays strong.
Ethereum’s Directional Movement Index (DMI), which signals a strong downtrend, adds to the bearish outlook. The Average Directional Index (ADX), which measures the strength of a trend, surged to 38.6 from 23.47 just a day ago, indicating growing momentum behind the current move.
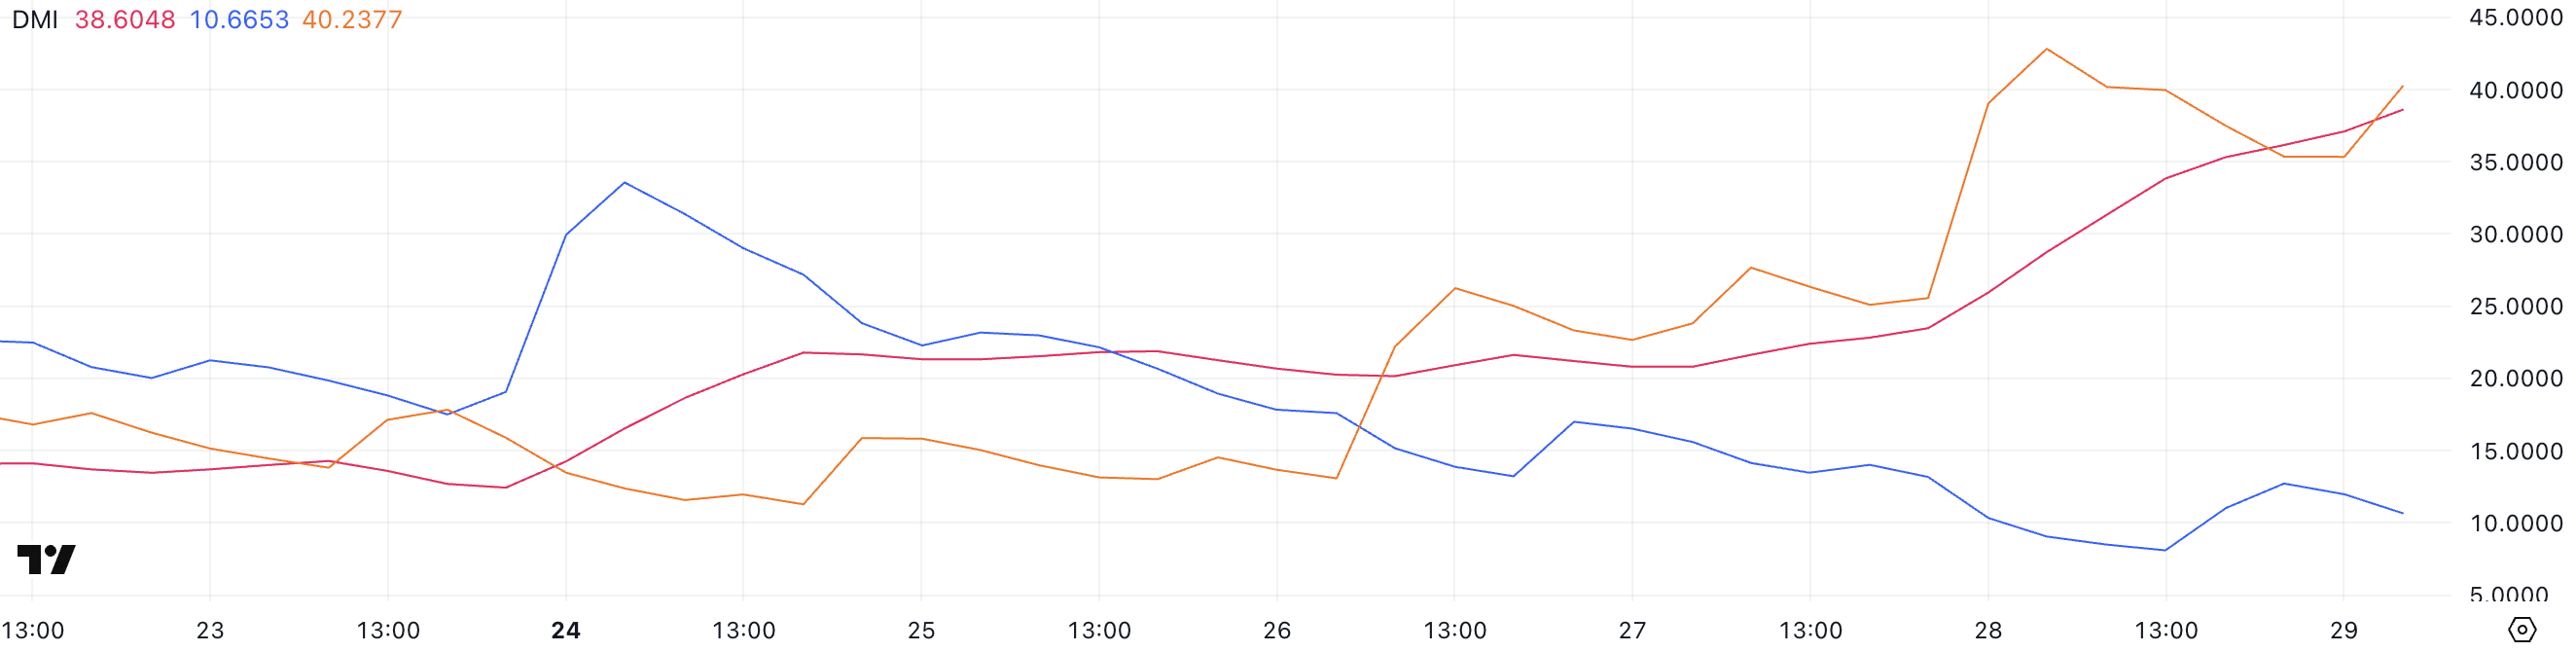
Meanwhile, the +DI (positive directional indicator) has fallen to 10.6, while the -DI (negative directional indicator) has spiked to 40.23, showing that sellers are firmly in control.
This combination—rising ADX, high -DI, and falling +DI—typically suggests an intensifying bearish trend, meaning Ethereum’s price could remain under pressure in the near term despite already being technically oversold.
Will Ethereum Fall Below $1,800 Soon?
If Ethereum’s downtrend continues, the next key level to watch is the support at $1,823. A break below this level could quickly push the price down toward $1,759—a move that would trigger the liquidation of two major whale vaults on Maker, which are already hovering near their thresholds.
These potential liquidations could amplify sell pressure, making it even harder for Ethereum price to stabilize in the short term. Given the current bearish momentum and weak technical indicators, this scenario remains a real risk if bulls fail to step in.
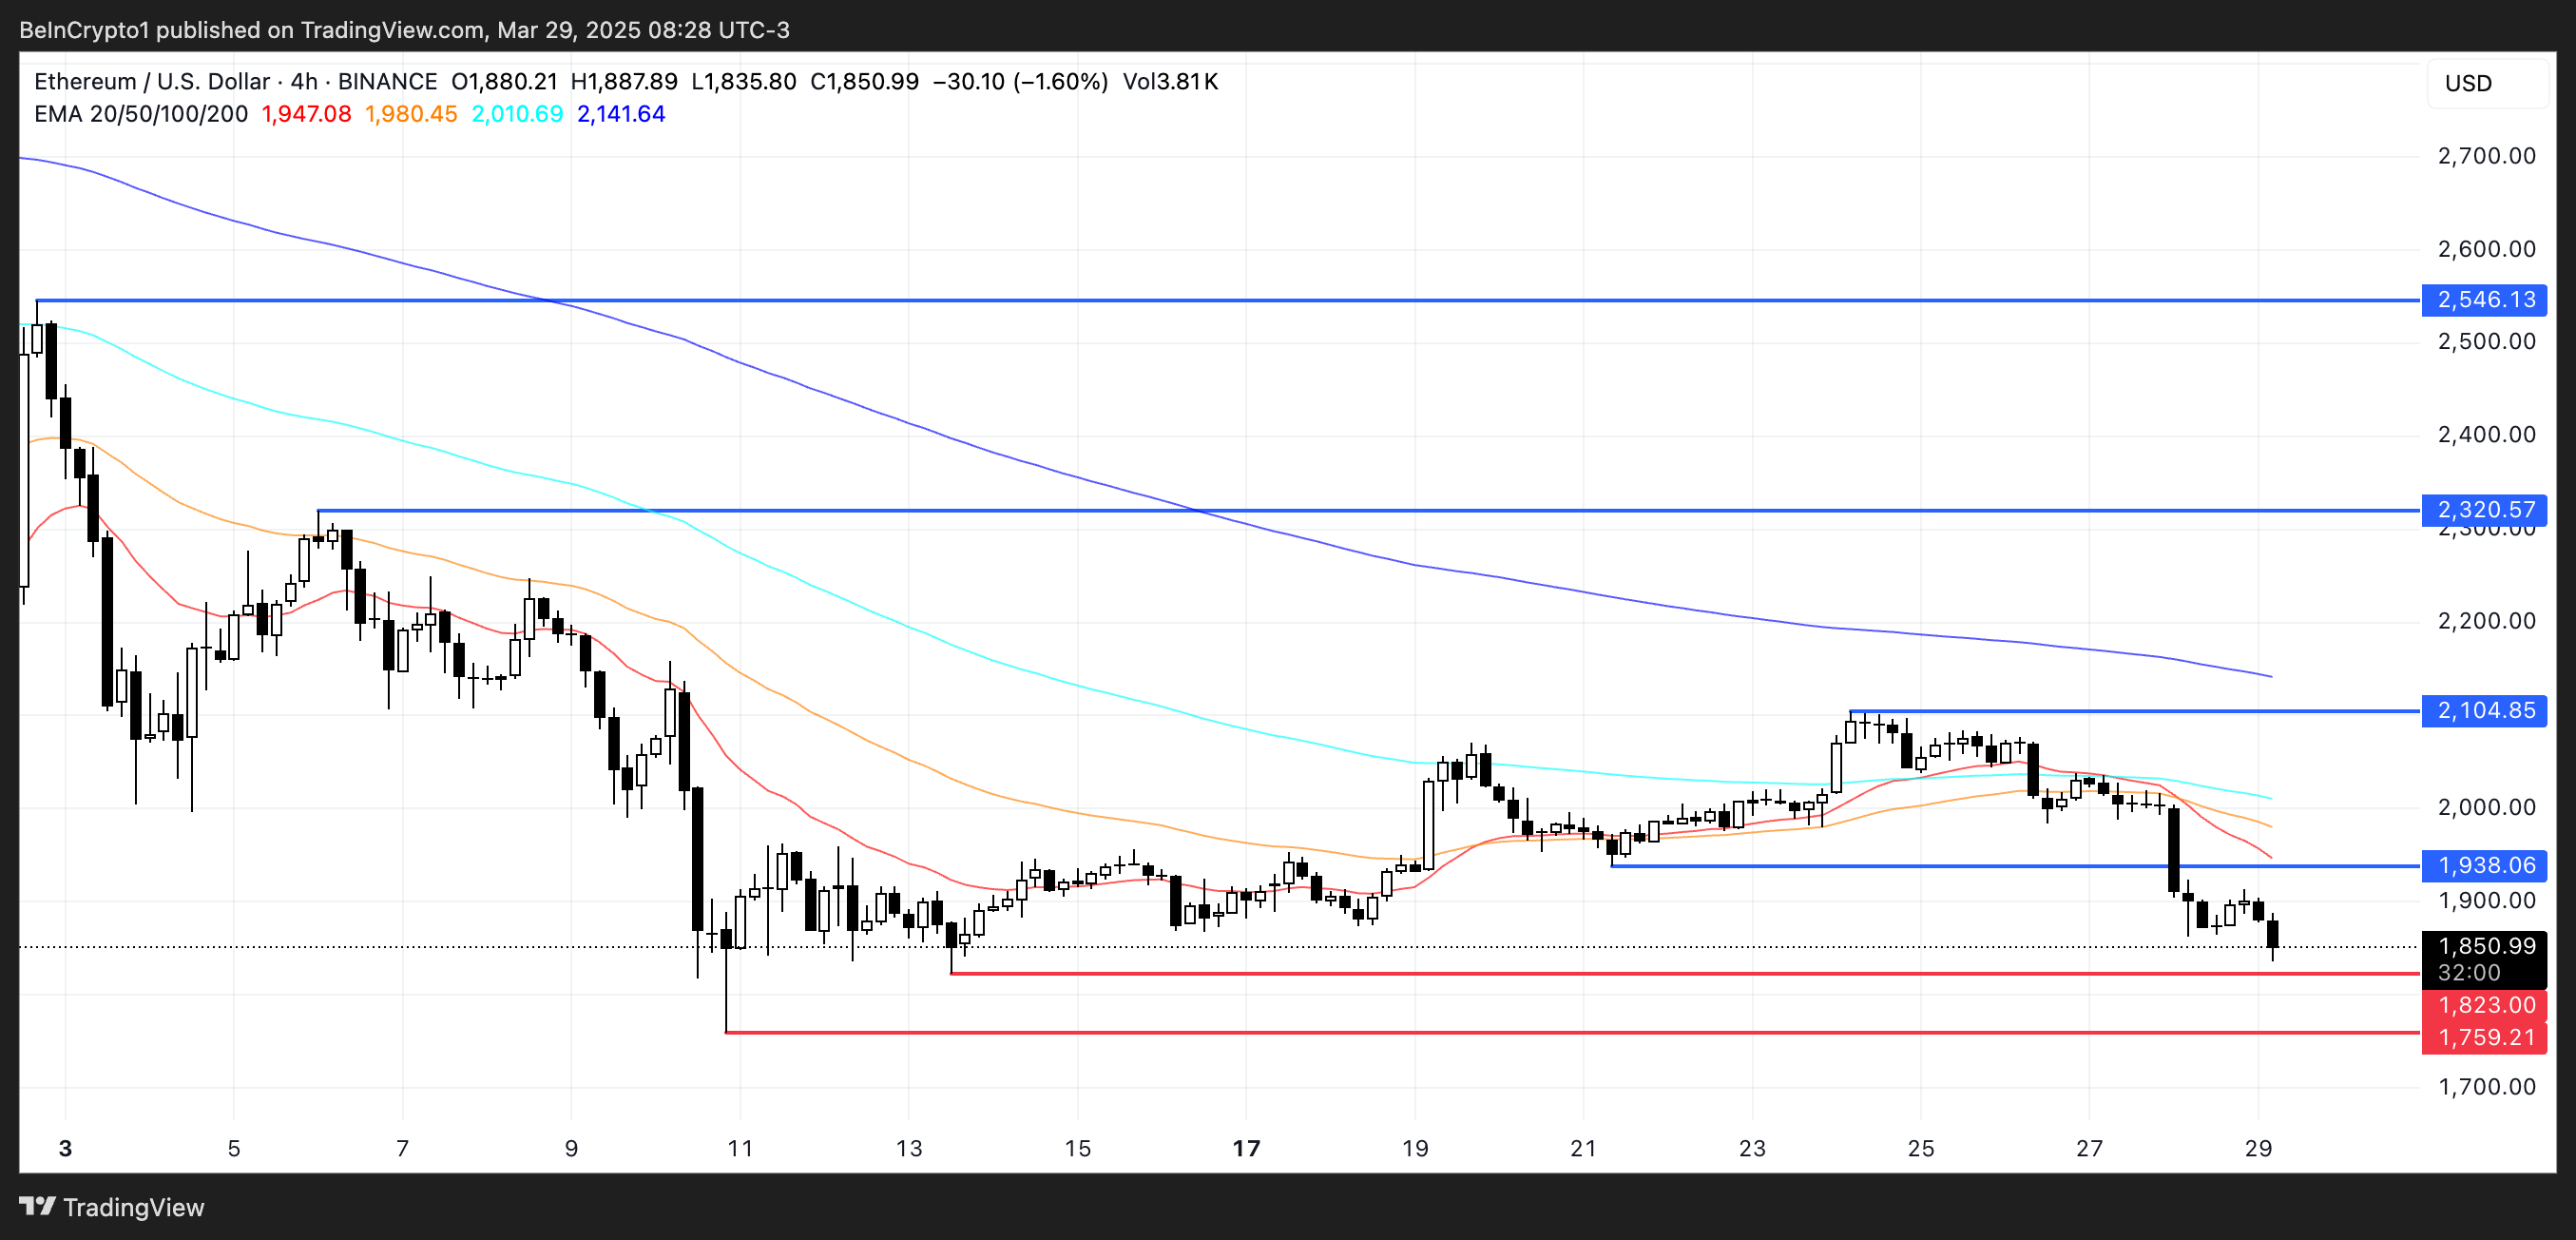
However, if sentiment shifts and the trend reverses, Ethereum could regain ground and test the resistance level at $1,938.
Breaking above that could open the path toward $2,104, a level that has previously acted as both resistance and support. Should buying momentum strengthen further, ETH might continue climbing toward $2,320 and potentially even $2,546.
Disclaimer
In line with the Trust Project guidelines, this price analysis article is for informational purposes only and should not be considered financial or investment advice. BeInCrypto is committed to accurate, unbiased reporting, but market conditions are subject to change without notice. Always conduct your own research and consult with a professional before making any financial decisions. Please note that our Terms and Conditions, Privacy Policy, and Disclaimers have been updated.

More than 100,000 users of popular crypto exchanges Binance and Gemini may be at risk after a trove of sensitive information appeared for sale on the dark web.
The leaked data reportedly includes full names, email addresses, phone numbers, and location details—raising alarms over growing cyber threats in the crypto sector.
Dark Web Actors Are Targeting Crypto Users
On March 27, a dark web user operating under the alias AKM69 listed a large database allegedly tied to Gemini, one of the largest crypto trading platforms in the US.
According to Dark Web Informer, the dataset mainly includes information about users from the United States, with a few entries from Singapore and the United Kingdom. The attacker claims the data could be used for marketing, fraud, or crypto recovery scams.
“The database for sale reportedly includes 100,000 records, each containing full names, emails, phone numbers, and location data of individuals from the United States and a few entries from Singapore and the UK,” the report stated.
It is unclear whether the leak resulted from a direct breach of Gemini’s systems or from other vulnerabilities, such as compromised user accounts or phishing campaigns.
Meanwhile, this incident followed another alarming listing on March 26.
According to the report, a separate dark web actor, kiki88888, allegedly offered a trove of Binance user data for sale. The database is said to hold over 132,000 entries, including the exchange users’ login information.
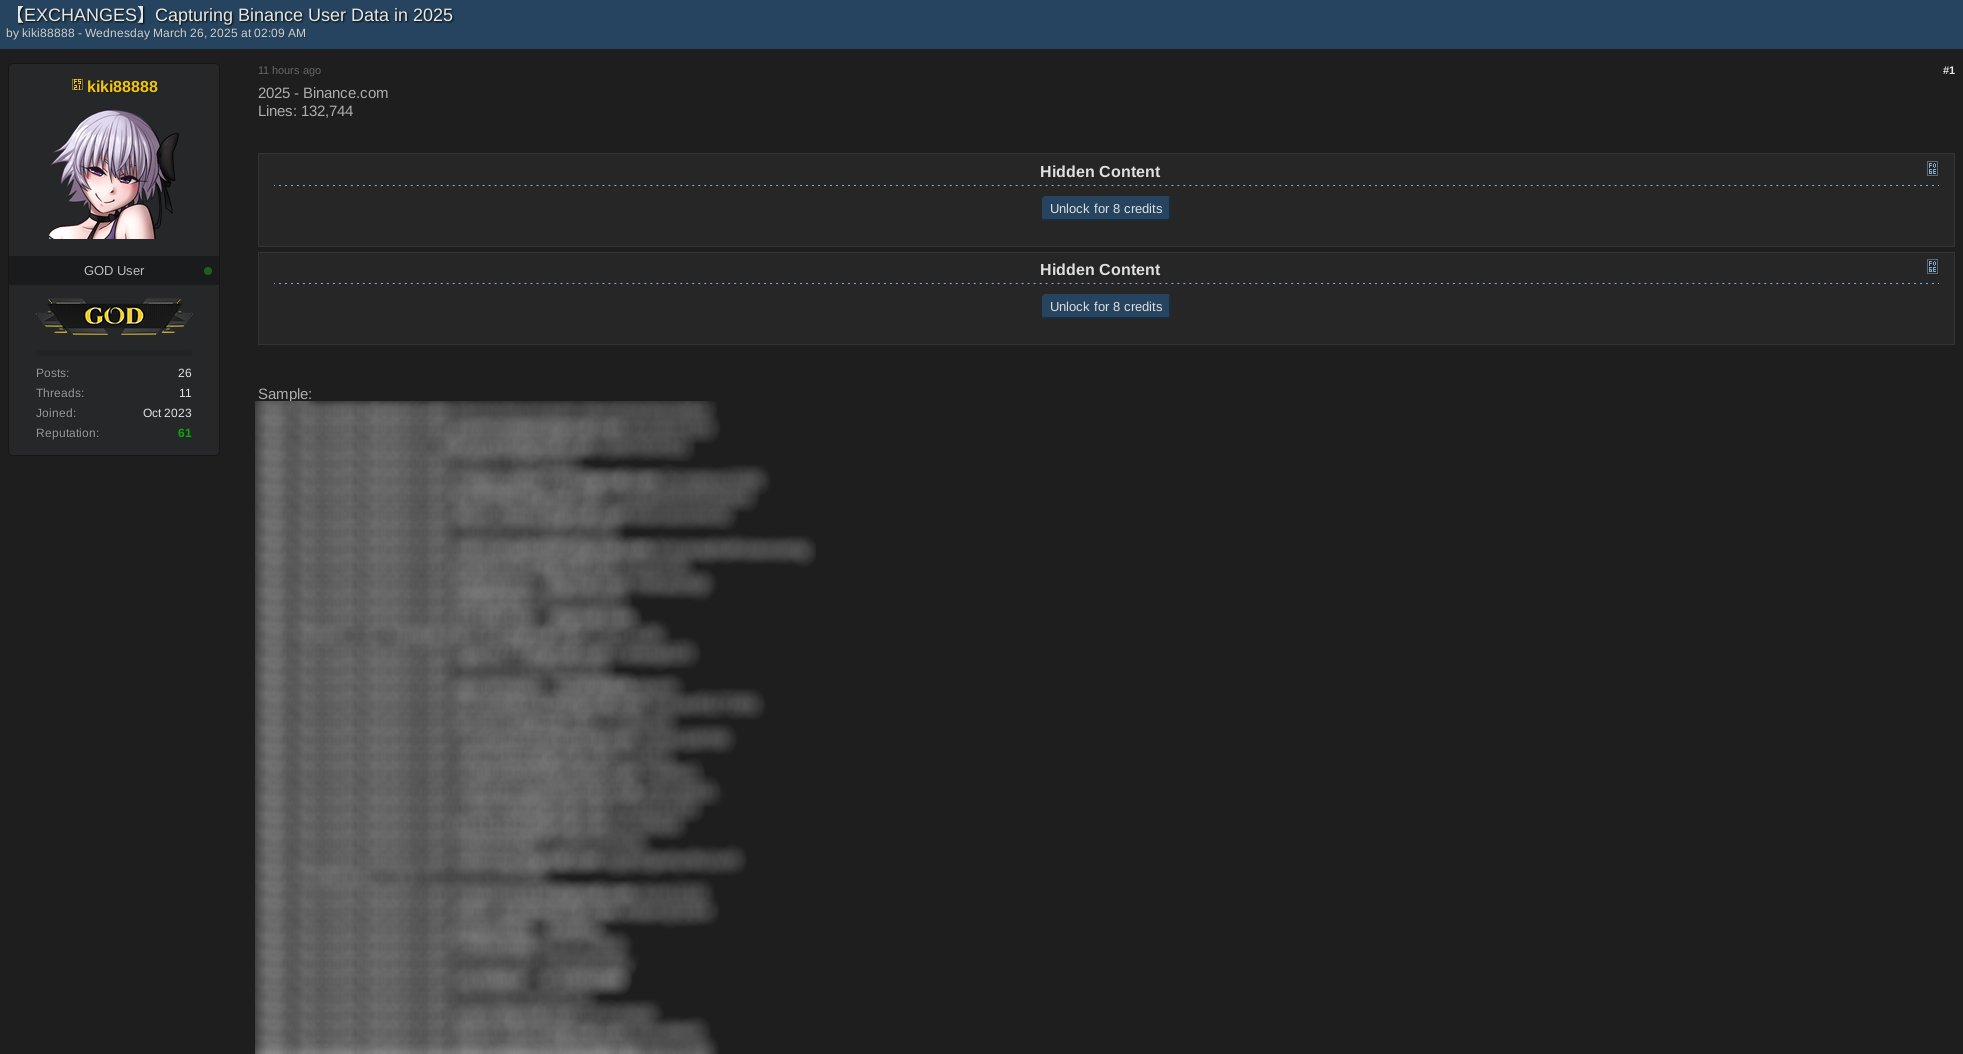
The Dark Web Informer suggests phishing attacks likely caused the breach rather than a compromise of the exchange’s systems.
“Some of you really need to stop clicking random stuff,” the Informer stated.
Binance and Gemini have yet to publicly comment on these incidents. However, phishing remains one of the most effective methods cybercriminals use to exploit crypto holders.
Scammers often impersonate official accounts or place misleading ads that redirect users to fake websites. Coinbase users are also being extensively targeted through phishing campaigns.
As BeInCrypto reported earlier, in March, Coinbase users lost over $46 million to social engineering scams.
Blockchain security firm Scam Sniffer revealed that phishing-related losses exceeded $15 million in the first two months of the year. This figure highlights the growing scale of the threat.
Given the rising threats, crypto users should stay vigilant and avoid unfamiliar links. They should also protect their accounts with two-factor authentication and hardware wallets whenever possible.
Disclaimer
In adherence to the Trust Project guidelines, BeInCrypto is committed to unbiased, transparent reporting. This news article aims to provide accurate, timely information. However, readers are advised to verify facts independently and consult with a professional before making any decisions based on this content. Please note that our Terms and Conditions, Privacy Policy, and Disclaimers have been updated.

US Senators Question Trump’s Involvement in USD1 Stablecoin

Ethereum Drops As Two Whales Face $235 Million Liquidation Risk

Dark Web Criminals Are Selling Binance and Gemini User Data

Bitcoin Price Could Surge To $95,000 — But Analyst Sounds ‘Bull Trap’ Alarm

Ethereum Breakdown, Analyst Eyes $1,130–$1,200 Price Target

Did XRP Price Just Hit $21K? Live TV Display Error Goes Viral

2.52 Million Altcoins Are Ruining Crypto’s Future

Animoca Brands Valuation Tanks 75% In Two Years, Here’s Why

Crypto exchange BingX hacked for $43 million

Are The Big Players Losing Interest?

Hong Kong’s Securities Association Tips Authorities On Crypto Self-Regulation

Coinbase cbBTC Set to go Live on Solana
2.52 Million Altcoins Are Ruining Crypto’s Future
Animoca Brands Valuation Tanks 75% In Two Years, Here’s Why
Crypto exchange BingX hacked for $43 million
Are The Big Players Losing Interest?
Hong Kong’s Securities Association Tips Authorities On Crypto Self-Regulation
Coinbase cbBTC Set to go Live on Solana
-

 Regulation21 hours ago
FDIC Revises Crypto Guidelines Allowing Banks To Enter Digital Assets
-

 Altcoin20 hours ago
PiDaoSwap, Trump Media, & Grayscale
-
 Regulation19 hours ago
US SEC Drops Charges Against Hawk Tuah Girl Hailey Welch
-
 Market24 hours ago
A Threat to Crypto’s Decentralized Future?
-
 Altcoin24 hours ago
TRUMP Crypto Whale Incurs Massive $15M Loss Amid Price Slump, Here’s How
-

 Market23 hours ago
Popular Analyst Peter Brandt Identifies XRP Head & Shoulder Pattern, Reveals Path To Take
-

 Market22 hours ago
What to Expect from XRP Price in April 2025
-

 Market17 hours ago
Why Did MUBARAK Drop 40% Despite Binance Listing?