
Market
PEPE Price May Fall If Profit-Taking Activity Commences

Activity in the meme coin market has gained momentum in the last week, leading to an uptick in demand for the frog-themed token Pepe (PEPE).
Exchanging hands at $0.000012, the meme coin’s value has increased by 5% in the past seven days.
Pepe Sellers May Take Action
Pepe’s (PEPE) Chaikin Money Flown (CMF) confirms the rise in the altcoin’s demand. This indicator, assessed on a one-day chart, is in an uptrend at 0.08 at press time.
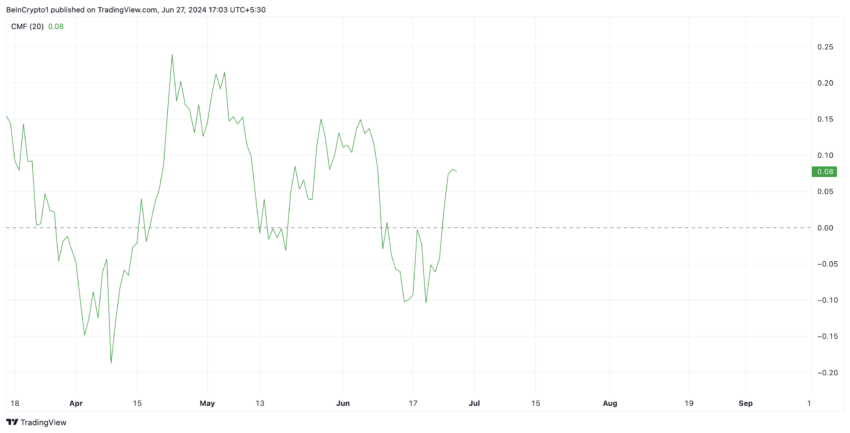
This indicator measures the money flow into or out of an asset over a specified period of time. When its value is positive, it indicates the presence of significant buying pressure behind an asset’s price rally.
However, PEPE’s Market Value to Realized Value (MVRV) ratio hints at the possibility of a price reversal. At press time, the metric’s value is 137.20%.
Read More: Pepe: A Comprehensive Guide to What It Is and How It Works
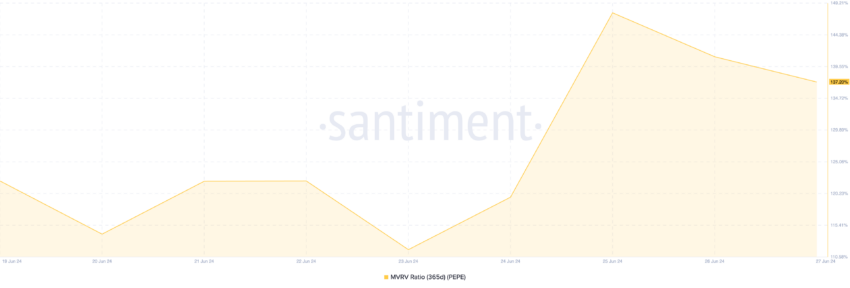
The MVRV ratio assesses whether an asset is overvalued or undervalued. It does this by comparing the current market value of an asset to the average price at which all units were last moved on the blockchain.
When it returns a value above one, it suggests that an asset’s current market value is significantly higher than the price at which most investors acquired their holdings.
When an asset’s MVRV is above one, profit-taking activity is common. This is because it suggests that the asset has appreciated in value compared to the price at which it was acquired. Investors who hold above their cost basis interpret this as an opportunity to lock in their profits by selling their holdings.
PEPE Price Prediction: The Bulls Wield Control
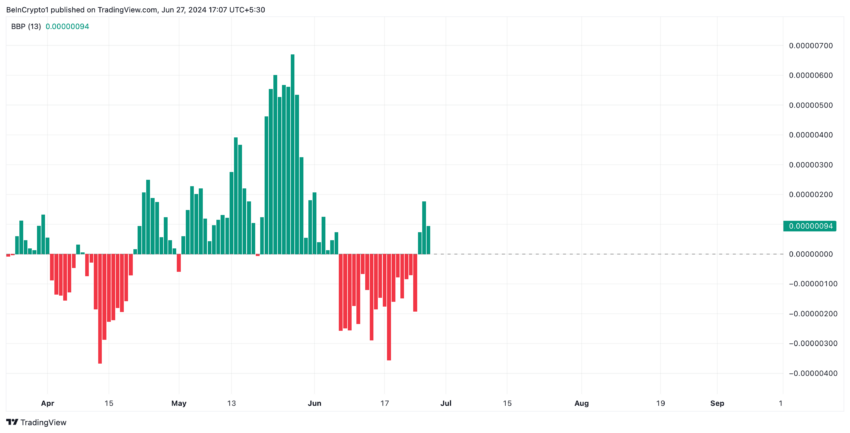
Although it remains at risk of significant selloffs, the bullish bias toward PEPE remains high. The meme coin’s Elder-Ray Index confirms this. At press time, this indicator’s value is above zero at 0.00000094.
This indicator measures the relationship between the strength of buyers and sellers in the market. When its value is positive, bull power is dominant in the market.
Further, PEPE’s rising open interest shows the surge in the demand for the meme coin. At $132 million at press time, PEPE’s open interest has risen by 20% in the past seven days.
Open interest measures the total number of outstanding futures or options contracts that have not been settled or closed. When it climbs, it suggests an influx of traders opening new positions.
If the bullish bias toward PEPE remains, the meme coin’s price will rally to $0.000013.
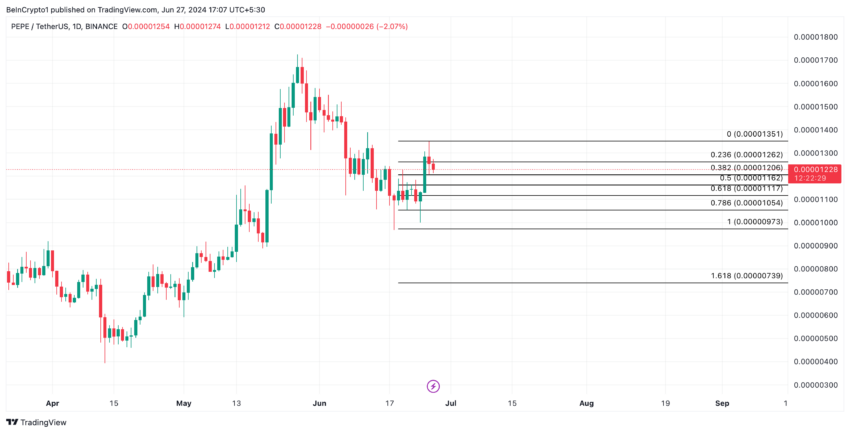
However, if profit-taking activity commences, it puts downward pressure on the token’s price, invalidating the above projection. PEPE’s price may then fall to $0.000012.
Disclaimer
In line with the Trust Project guidelines, this price analysis article is for informational purposes only and should not be considered financial or investment advice. BeInCrypto is committed to accurate, unbiased reporting, but market conditions are subject to change without notice. Always conduct your own research and consult with a professional before making any financial decisions. Please note that our Terms and Conditions, Privacy Policy, and Disclaimers have been updated.


Hedera (HBAR) is under pressure, down roughly 13.5% over the past seven days, with its market cap holding at around $7 billion. Recent technical signals point to growing bearish momentum, with both trend and momentum indicators leaning heavily negative.
The price has been hovering near a critical support zone, raising the risk of a breakdown below $0.15 for the first time in months. Unless bulls regain control soon, HBAR could face further losses before any meaningful recovery attempt.
HBAR BBTrend Has Been Turning Heavily Down Since Yesterday
Hedera’s BBTrend indicator has dropped sharply to -10.1, falling from 2.59 just a day ago. This rapid decline signals a strong shift in momentum and suggests that HBAR is experiencing an aggressive downside move.
Such a steep drop often reflects a sudden increase in selling pressure, which can quickly change the asset’s short-term outlook.
The BBTrend, or Bollinger Band Trend, measures the strength and direction of a trend using the position of price relative to the Bollinger Bands. Positive values generally indicate bullish momentum, while negative values point to bearish momentum.
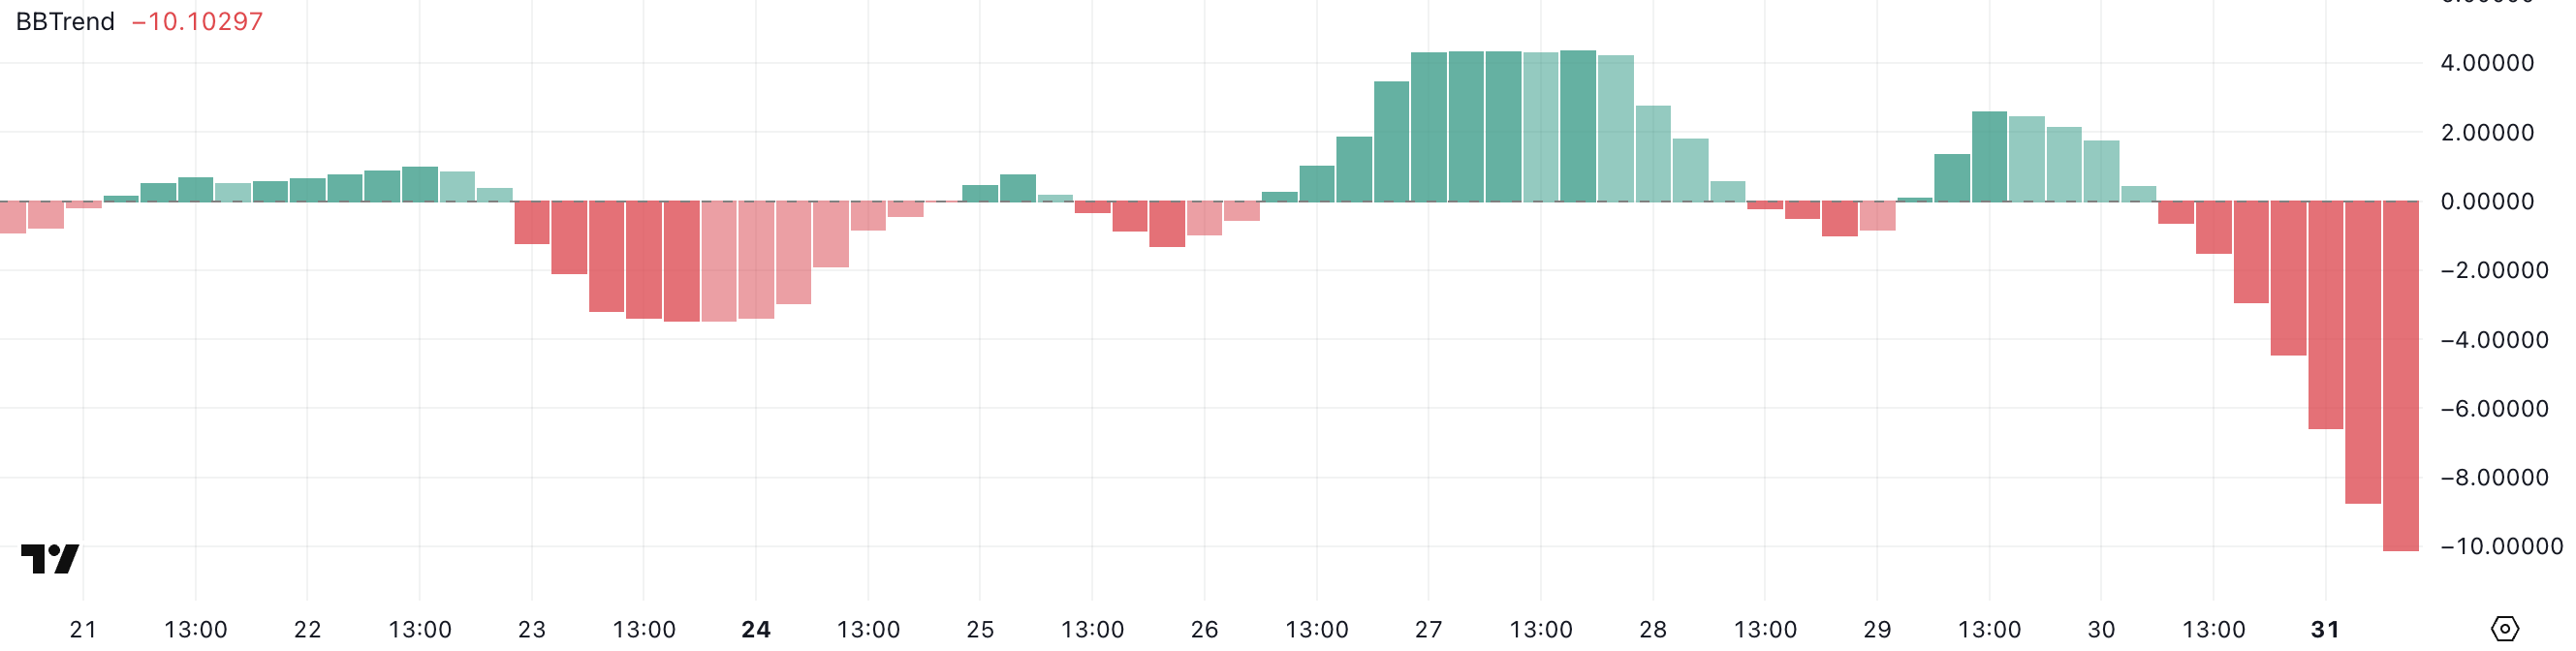
The further the value is from zero, the stronger the trend. HBAR’s BBTrend is now at -10.1, signaling strong bearish momentum.
This suggests that the price is trending lower and doing so with increasing strength, which could lead to further downside unless buyers step in to slow the momentum.
Hedera Ichimoku Cloud Paints a Bearish Picture
Hedera’s Ichimoku Cloud chart reflects a strong bearish structure, with the price action positioned well below both the blue conversion line (Tenkan-sen) and the red baseline (Kijun-sen).
This setup indicates that short-term momentum is clearly aligned with the longer-term downtrend.
The price has consistently failed to break above these dynamic resistance levels, signaling continued seller dominance.
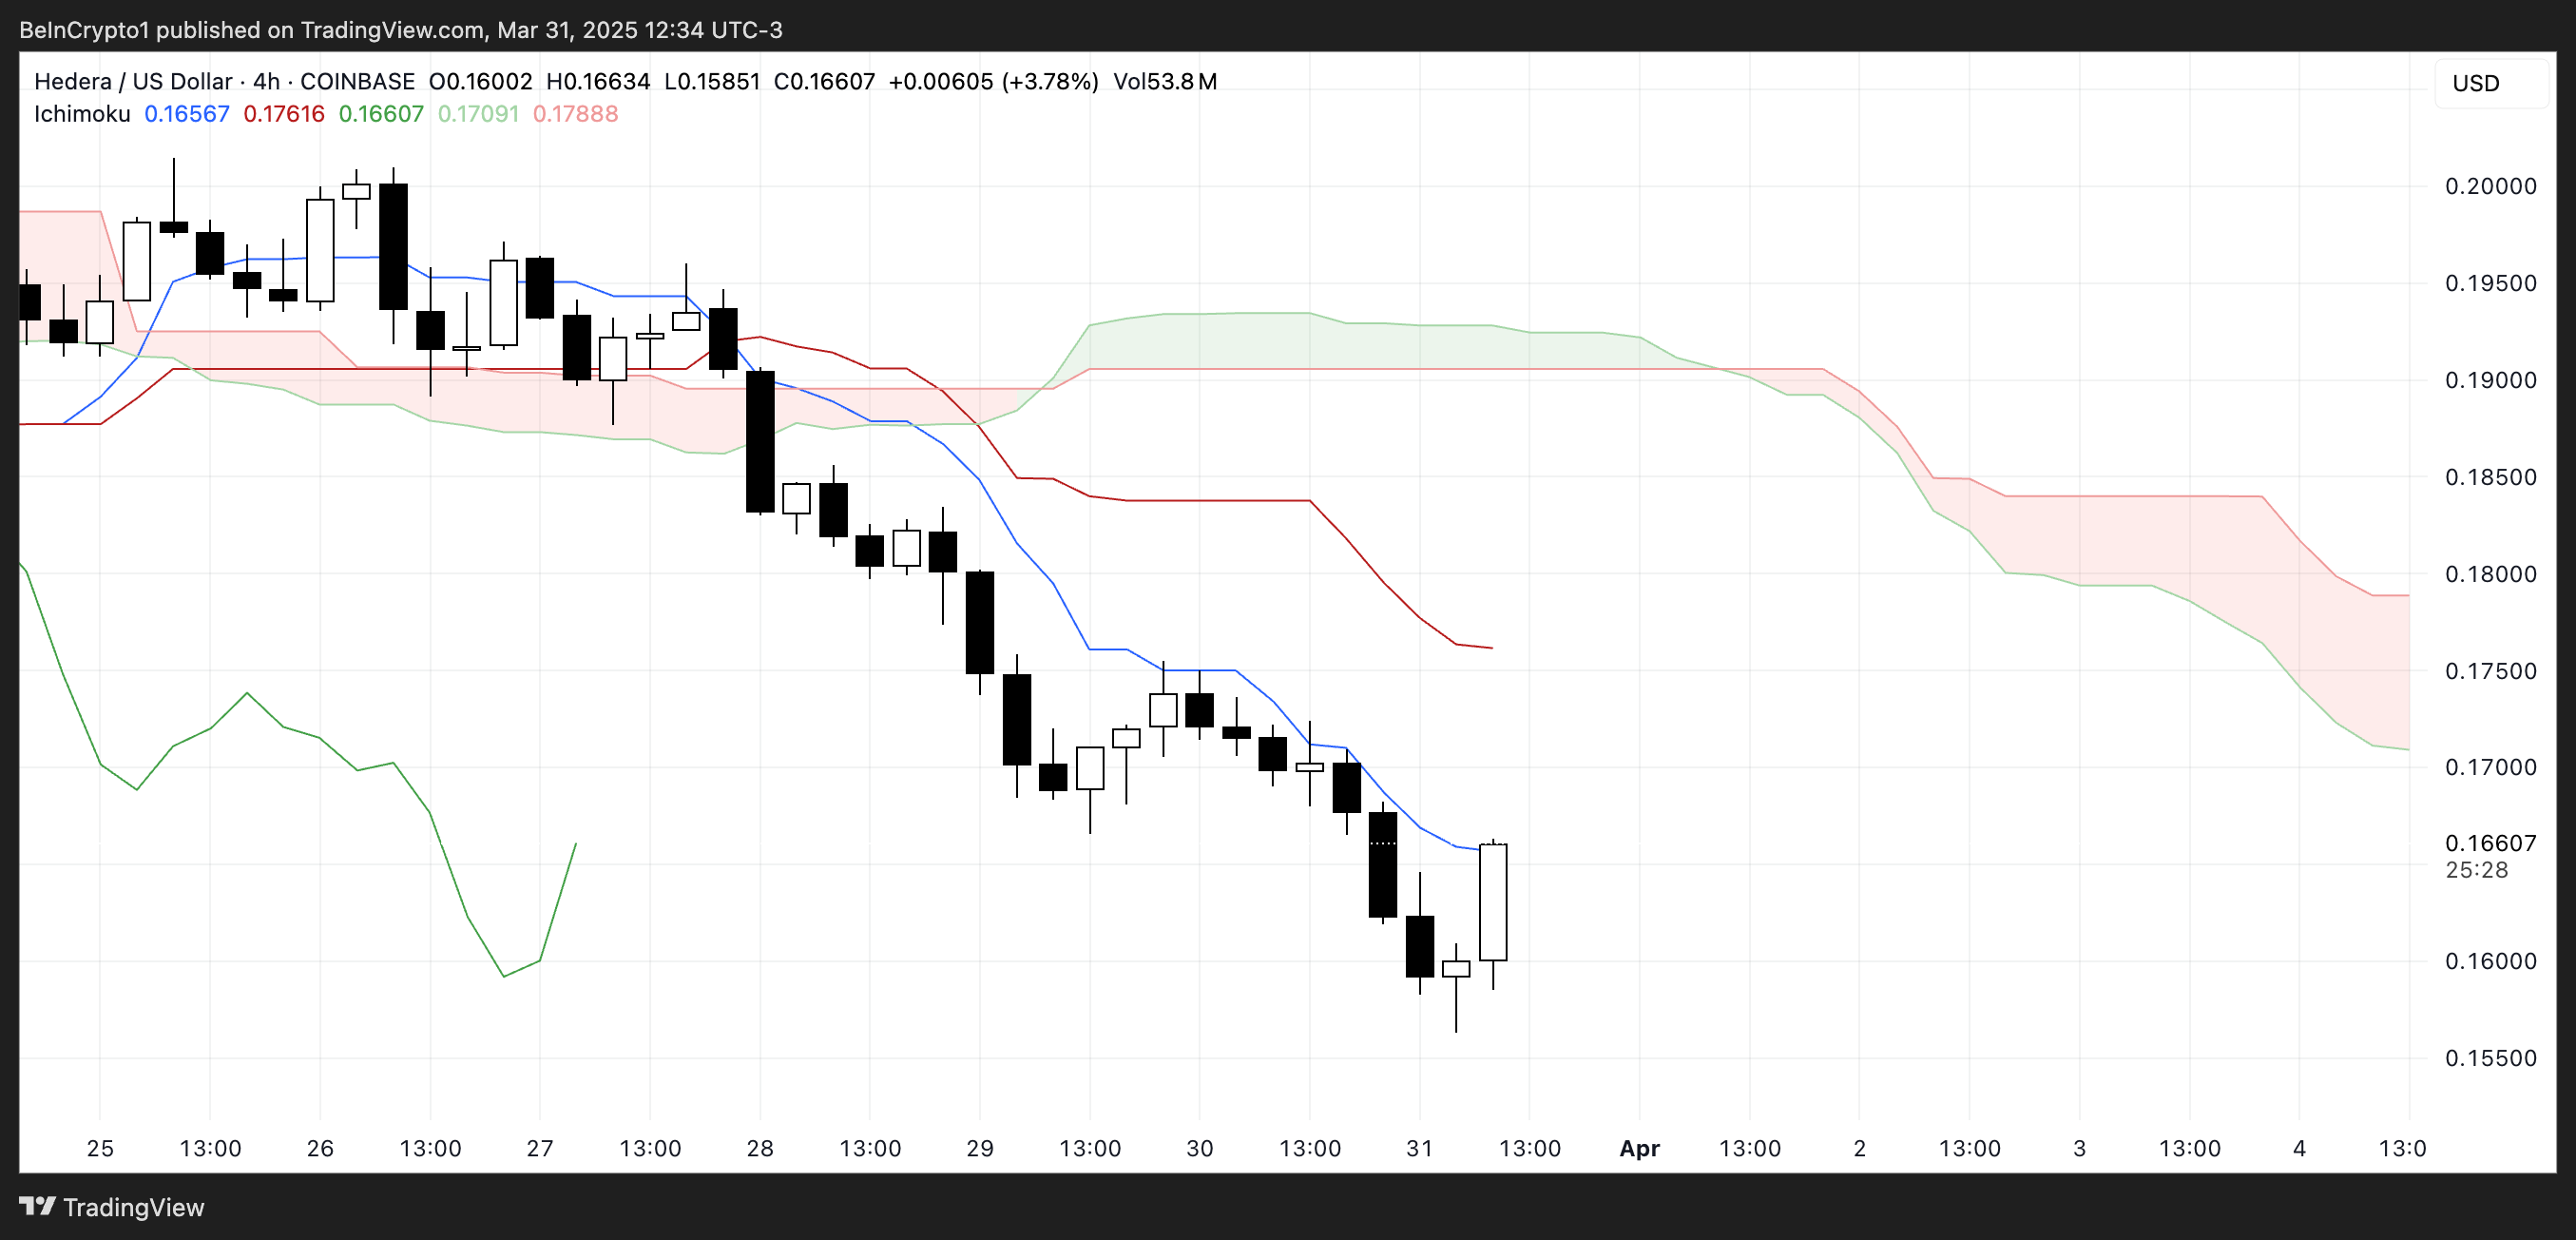
The future cloud is also red and trending downward, suggesting that bearish pressure is expected to persist in the near term.
The span between the Senkou Span A and B lines remains wide, reinforcing the strength of the downtrend. For any potential reversal to gain credibility, HBAR would first need to challenge and break above the Tenkan-sen and Kijun-sen, and eventually push into or above the cloud.
Until then, the current Ichimoku configuration supports a continuation of the bearish outlook.
Can Hedera Fall Below $0.15 Soon?
Hedera price has been hovering around the $0.16 level and is approaching a key support at $0.156.
If this support fails to hold, it could open the door for further downside, potentially pushing HBAR below the $0.15 mark for the first time since November 2024.
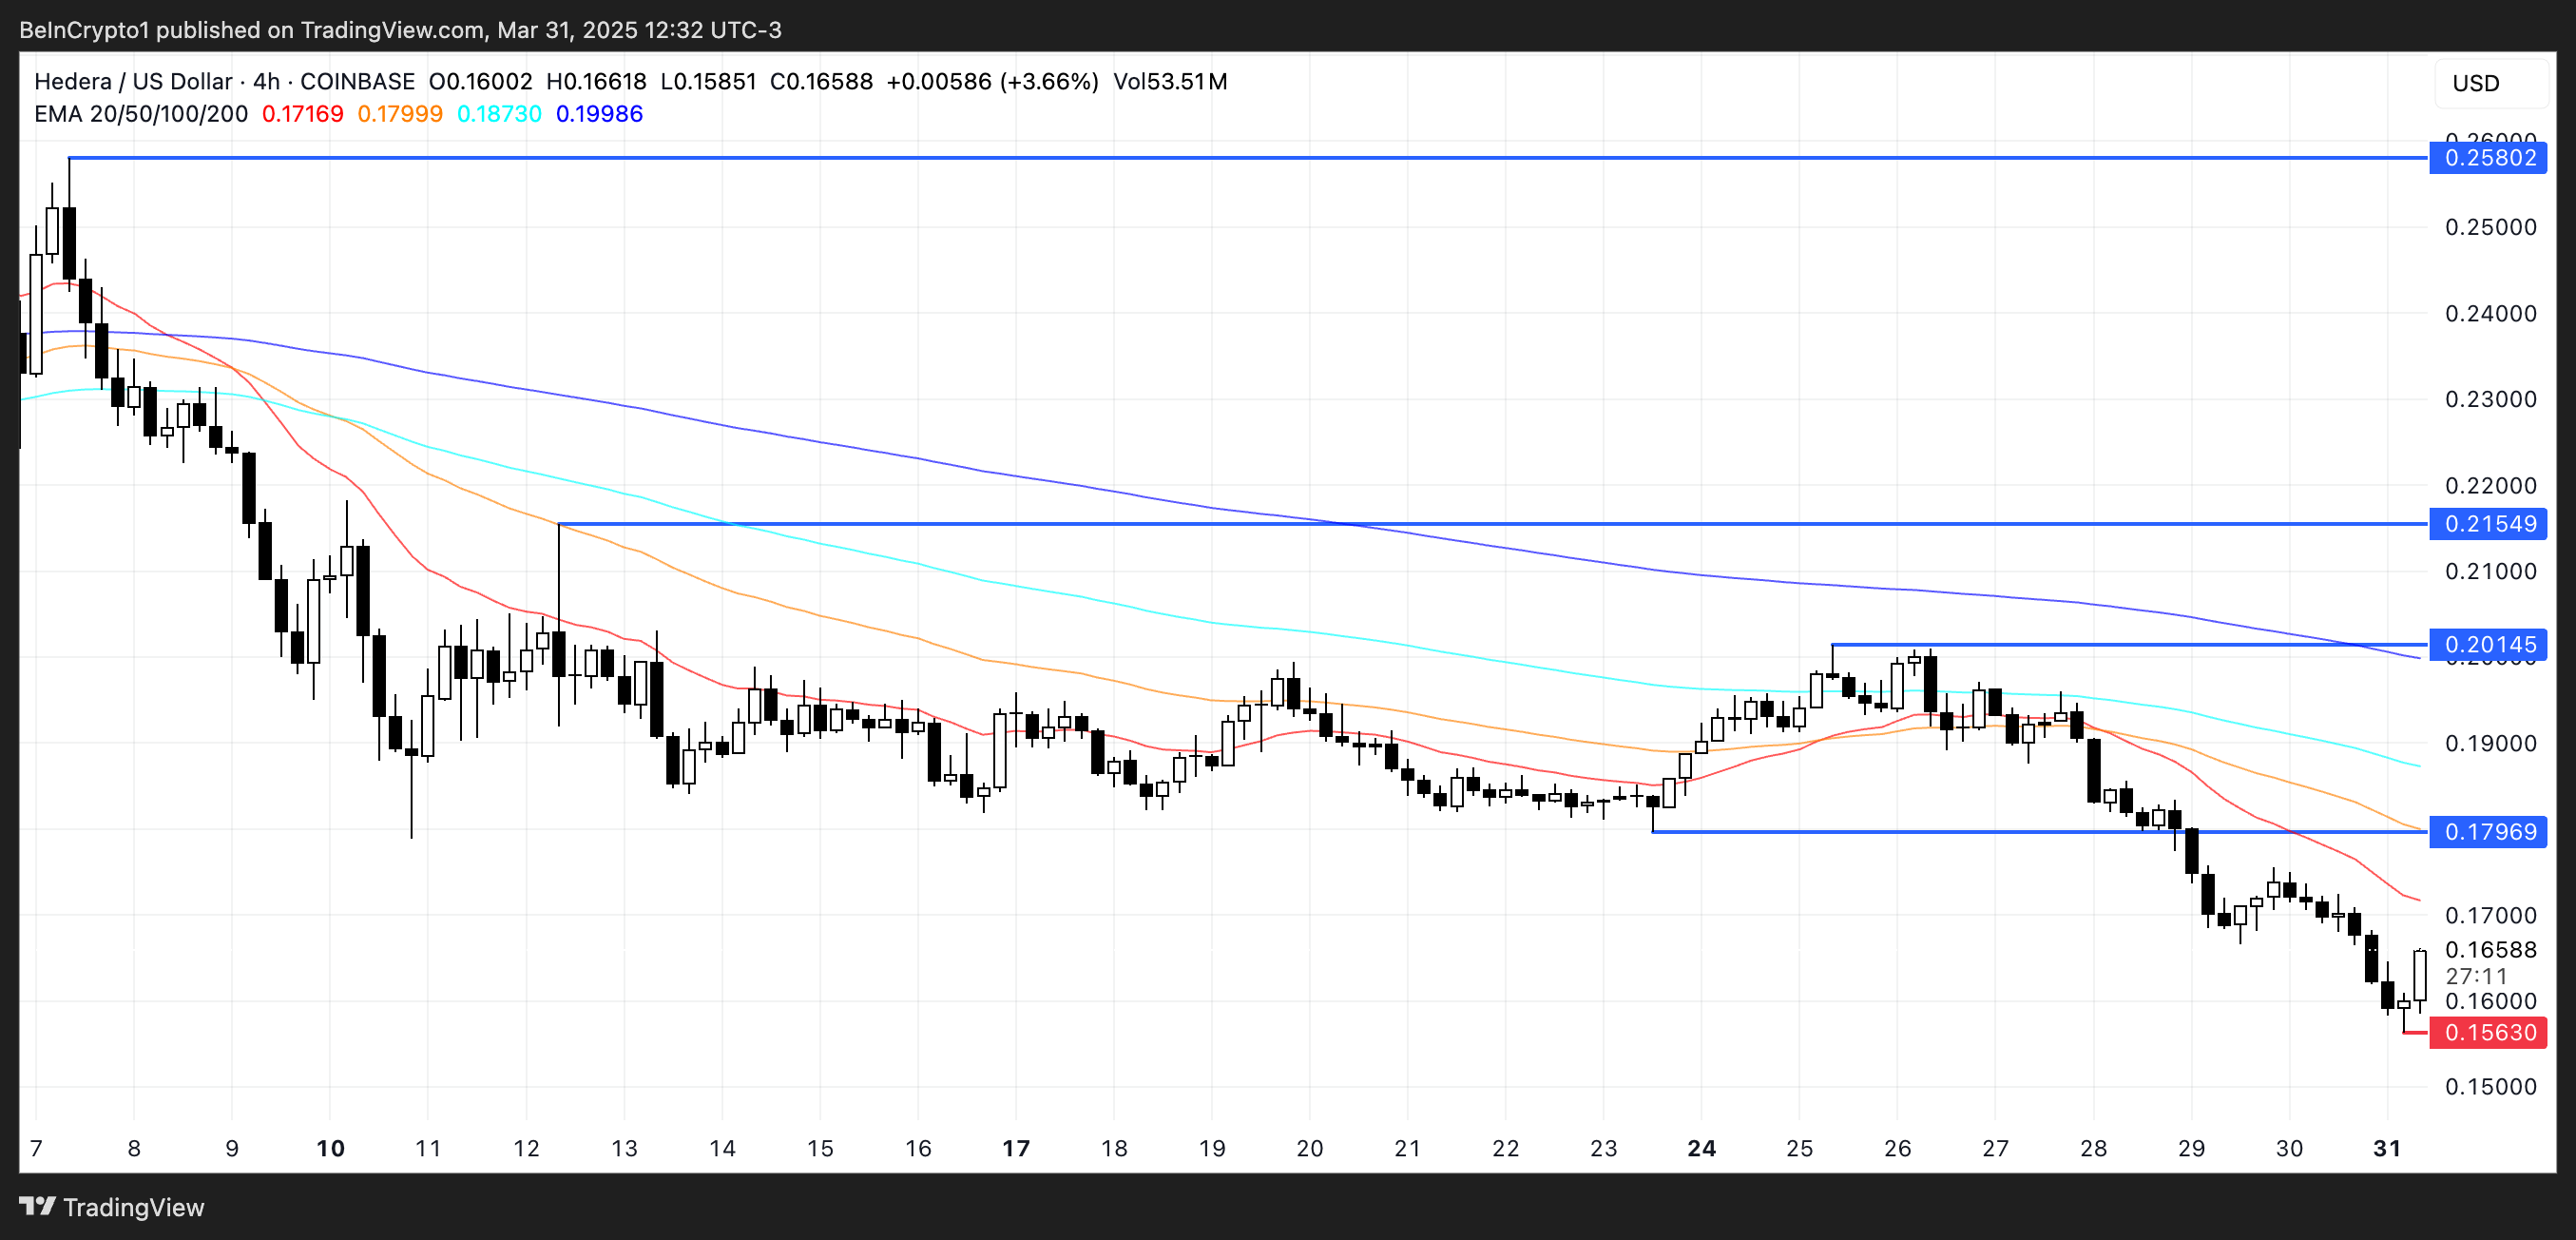
However, if HBAR manages to reverse its current trajectory and regain bullish momentum, the first target to watch is the resistance at $0.179.
A breakout above that level could lead to a stronger rally toward $0.20 and, if momentum continues, even reach $0.215. In a more extended bullish scenario, HBAR could climb to $0.25, signaling a full recovery and trend reversal.
Disclaimer
In line with the Trust Project guidelines, this price analysis article is for informational purposes only and should not be considered financial or investment advice. BeInCrypto is committed to accurate, unbiased reporting, but market conditions are subject to change without notice. Always conduct your own research and consult with a professional before making any financial decisions. Please note that our Terms and Conditions, Privacy Policy, and Disclaimers have been updated.


Coinbase asked a DC District Court if it could resume its old lawsuit against the FDIC. Coinbase sued this regulator over Operation Choke Point 2.0 and claimed that it’s still refusing to release relevant information.
Based on the information available so far, it’s difficult to draw definitive conclusions. The FDIC maintains that it responded to its opponents’ questions truthfully, though it has shown delays in the past.
Coinbase vs the FDIC
Coinbase, one of the world’s largest crypto exchanges, has been in a few fights with the FDIC. The firm has been pursuing the FDIC over Operation Choke Point 2.0 for months now, and has achieved impressive results. Despite this, however, Coinbase is asking the DC District Court to resume its litigation against the regulator:
“We’re asking the Court to resume our lawsuit because the FDIC has unfortunately stopped sharing information. While we would have loved to resolve this outside of the legal system – and we do appreciate the increased cooperation we’ve seen from the new FDIC leadership – we still have a ways to go,” claimed Paul Grewal, Coinbase’s Chief Legal Officer.
The FDIC has an important role in US financial regulation, primarily dealing with banks. This gave it a starring role in Operation Choke Point 2.0, hampering banks’ ability to deal with crypto businesses. However, it recently started a pro-crypto turn, releasing tranches of incriminating documents and revoking several of its anti-crypto statutes.
Grewal said that he “appreciated the increased cooperation” from the FDIC but that the cooperation stopped weeks ago. According to Coinbase’s filing, the FDIC hasn’t sent any new information since late February and claimed in early March that the exchange’s subsequent requests were “unreasonable and beyond the scope of discovery.”
On one hand, the FDIC has previously been slow to make relevant disclosures in the Coinbase lawsuit. On the other hand, Operation Choke Point 2.0 sparked significant tension within the industry, and a determined group is now aiming to significantly weaken the regulatory bodies involved.
Until the legal battle continues, it’ll be difficult to make any definitive statements. The FDIC will likely have two weeks to respond to Coinbase’s request.
Disclaimer
In adherence to the Trust Project guidelines, BeInCrypto is committed to unbiased, transparent reporting. This news article aims to provide accurate, timely information. However, readers are advised to verify facts independently and consult with a professional before making any decisions based on this content. Please note that our Terms and Conditions, Privacy Policy, and Disclaimers have been updated.


Larry Fink, CEO of BlackRock, claimed in a recent letter that Bitcoin and crypto could damage the dollar’s international standing. If investors treat Bitcoin as an inflation hedge to the dollar, it could precipitate serious trouble.
However, he was also adamant that the industry offers a lot of advantages, particularly through tokenization.
Larry Fink Sees Opportunity in Crypto
BlackRock is the leading Bitcoin ETF issuer in the US, and its CEO Larry Fink has long been bullish on Bitcoin. However, as Fink described in his most recent Annual Chairman’s Letter to investors, crypto’s best interest doesn’t always align with TradFi or the dollar.
“The US has benefited from the dollar serving as the world’s reserve currency for decades. But that’s not guaranteed to last forever. By 2030, mandatory government spending and debt service will consume all federal revenue, creating a permanent deficit. If the US doesn’t get its debt under control… America risks losing that position to digital assets like Bitcoin,” he said.
To be clear, Fink insisted that he supports crypto and listed some practical problems that he believes it can solve. He expressed a particular interest in asset tokenization, claiming that a digital-native infrastructure would improve and democratize the TradFi ecosystem.
Despite these advantages, Fink recognizes the danger that crypto can present to the US economy if not properly managed. He addressed the longstanding practice of using crypto to hedge against inflation, a wise practice for many assets.
However, if a wide swath of investors think Bitcoin is more stable than the dollar, it would threaten USD’s status as the world reserve currency. A scenario like that would be very dangerous to all of TradFi, and Fink has a particular interest in protecting BlackRock. Such an event would doubtlessly impact crypto as well.
“Decentralized finance is an extraordinary innovation. It makes markets faster, cheaper, and more transparent. Yet that same innovation could undermine America’s economic advantage if investors begin seeing Bitcoin as a safer bet than the dollar,” Fink added.
He didn’t offer too many specific solutions to this growing problem, but Fink isn’t the only person concerned with the issue. President Trump recently suggested that stablecoins could promote dollar dominance worldwide. Even if the dollar is seen as unstable, its adoption within a rapidly growing global industry like stablecoins could help reinforce its strength and relevance.
Of course, there are also drawbacks to Trump’s plan. Larry Fink acknowledged a possible threat from crypto, but continues to espouse its utility. Its benefits are too good to ignore.
Disclaimer
In adherence to the Trust Project guidelines, BeInCrypto is committed to unbiased, transparent reporting. This news article aims to provide accurate, timely information. However, readers are advised to verify facts independently and consult with a professional before making any decisions based on this content. Please note that our Terms and Conditions, Privacy Policy, and Disclaimers have been updated.

Hedera (HBAR) Bears Dominate, HBAR Eyes Key $0.15 Level

Charles Hoskinson Reveals How Cardano Will Boost Bitcoin’s Adoption

Coinbase Tries to Resume Lawsuit Against the FDIC

Ethereum Bitcoin Ratio Drops to Record Low, What Next for ETH?

BlackRock’s Larry Fink Thinks Crypto Could Harm The Dollar

Ethereum May Have To Undo This Death Cross For Bull’s Return

2.52 Million Altcoins Are Ruining Crypto’s Future

Animoca Brands Valuation Tanks 75% In Two Years, Here’s Why

Crypto exchange BingX hacked for $43 million

Are The Big Players Losing Interest?

Hong Kong’s Securities Association Tips Authorities On Crypto Self-Regulation

Coinbase cbBTC Set to go Live on Solana
2.52 Million Altcoins Are Ruining Crypto’s Future
Animoca Brands Valuation Tanks 75% In Two Years, Here’s Why
Crypto exchange BingX hacked for $43 million
Are The Big Players Losing Interest?
Hong Kong’s Securities Association Tips Authorities On Crypto Self-Regulation
Coinbase cbBTC Set to go Live on Solana
-
 Altcoin24 hours ago
Cardano Price Eyes Massive Pump In May Following Cyclical Patern From 2024
-

 Market20 hours ago
Bitcoin Bears Tighten Grip—Where’s the Next Support?
-

 Market19 hours ago
Ethereum Price Weakens—Can Bulls Prevent a Major Breakdown?
-
 Bitcoin12 hours ago
Marathon Digital to Sell $2 Billion in Stock to Buy Bitcoin
-
 Bitcoin7 hours ago
Strategy Adds 22,048 BTC for Nearly $2 Billion
-
 Market12 hours ago
Strategic Move for Trump Family in Crypto
-

 Market7 hours ago
BNB Breaks Below $605 As Bullish Momentum Fades – What’s Next?
-

 Market11 hours ago
Top Crypto Airdrops to Watch in the First Week of April