
Market
Could Arbitrum (ARB) Price End up Crashing to New Low?
Arbitrum’s (ARB) price is in for a major drawdown looking at not just the chart pattern but also the investors’ behavior.
Whether ARB ends up dropping to $0 or save skin before then is something to look out for.
Arbitrum Investors Prepared for Losses
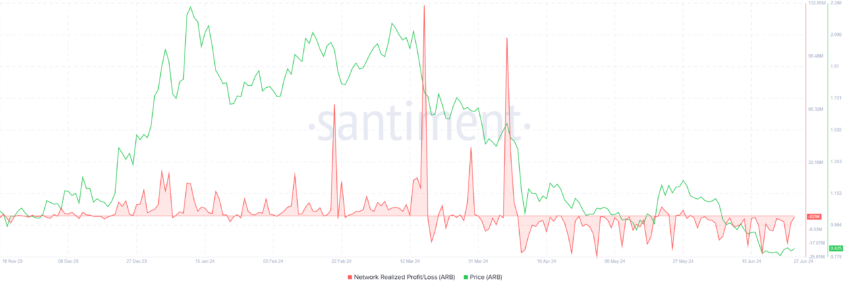
Arbitrum’s price could be looking at a new all-time low as the optimism among ARB holders has completely vanished. Arbitrum investors have been experiencing consistent losses on their transactions since mid-April. This ongoing trend is clearly highlighted by the Realized Profit/Loss metric, which underscores the financial challenges faced by the investors.
The persistent losses have significantly impacted investor sentiment, leading to a noticeable shift in behavior. Previously, many investors adopted a HODLing strategy, holding onto their assets in anticipation of long-term gains.
However, the sentiment of HODLing among Arbitrum investors has completely disappeared. The prolonged period of losses has eroded their confidence in this approach.
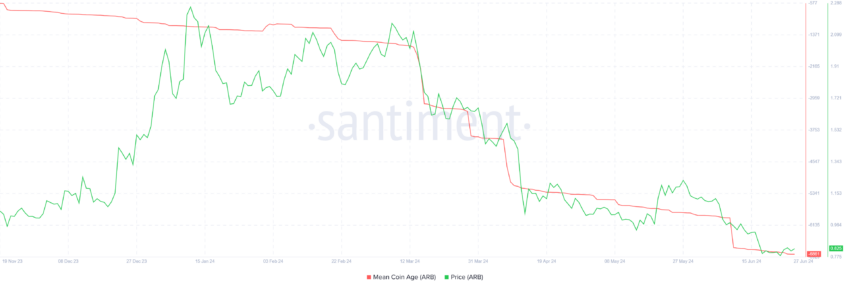
As a result, investors are now focusing on distribution strategies, as indicated by the mean coin age metric. Mean coin age measures the average age of all coins in a network, reflecting how long they’ve been held without being moved.
An increasing mean coin age suggests accumulation and holding, while a decreasing age indicates higher trading activity. This shift suggests a preference for liquidating assets rather than holding onto them, reflecting a more cautious and reactive investment approach.
Read More: How to Buy Arbitrum (ARB) and Everything You Need to Know
ARB Price Prediction: Forming New Lows
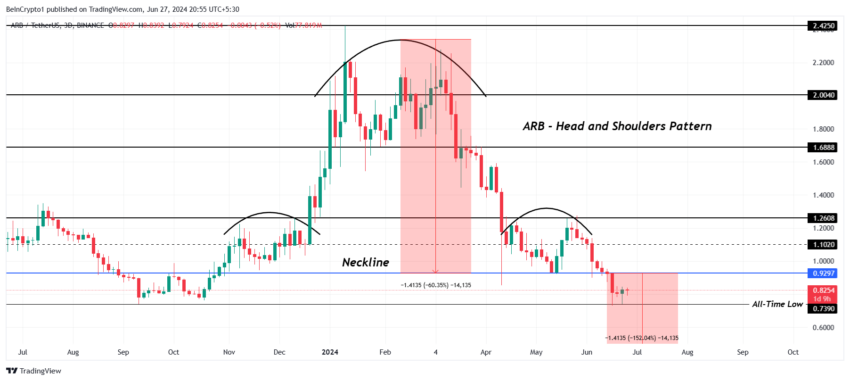
Arbitrum’s price is observing the formation of a head and shoulders pattern. The head and shoulders pattern is a bearish chart formation indicating a potential trend reversal. It consists of three peaks: a higher middle peak (head) between two lower peaks (shoulders).
Based on the technical pattern, the potential drawdown could send the altcoin down to $0 as the target is 100% below the neckline at $0.92. However, this is impossible since even during the FTX collapse, its native token, FTT, did not slip to $0.
Thus, the more practical outcome is Arbitrum’s price hitting a new all-time low. The current ATL lies at $0.73 and marking a lower low below this would not be surprising.
Read More: Arbitrum (ARB) Price Prediction 2024/2025/2035
But if by the mercy of ARB holders, the altcoin manages to bounce back Arbitrum’s price could bounce back. Potentially breaching the neckline at $0.92 will enable recovery and reclaiming $1.0 will invalidate the bearish thesis.
Disclaimer
In line with the Trust Project guidelines, this price analysis article is for informational purposes only and should not be considered financial or investment advice. BeInCrypto is committed to accurate, unbiased reporting, but market conditions are subject to change without notice. Always conduct your own research and consult with a professional before making any financial decisions. Please note that our Terms and Conditions, Privacy Policy, and Disclaimers have been updated.


Hedera (HBAR) has faced a downtrend recently, with the crypto asset’s price failing to maintain support at $0.200. This failure to establish a solid base has led to a pullback.
However, key developments within the Hedera ecosystem and shifting investor sentiment could spark a potential price rally in the coming days.
HBAR Foundation Eyes TikTok
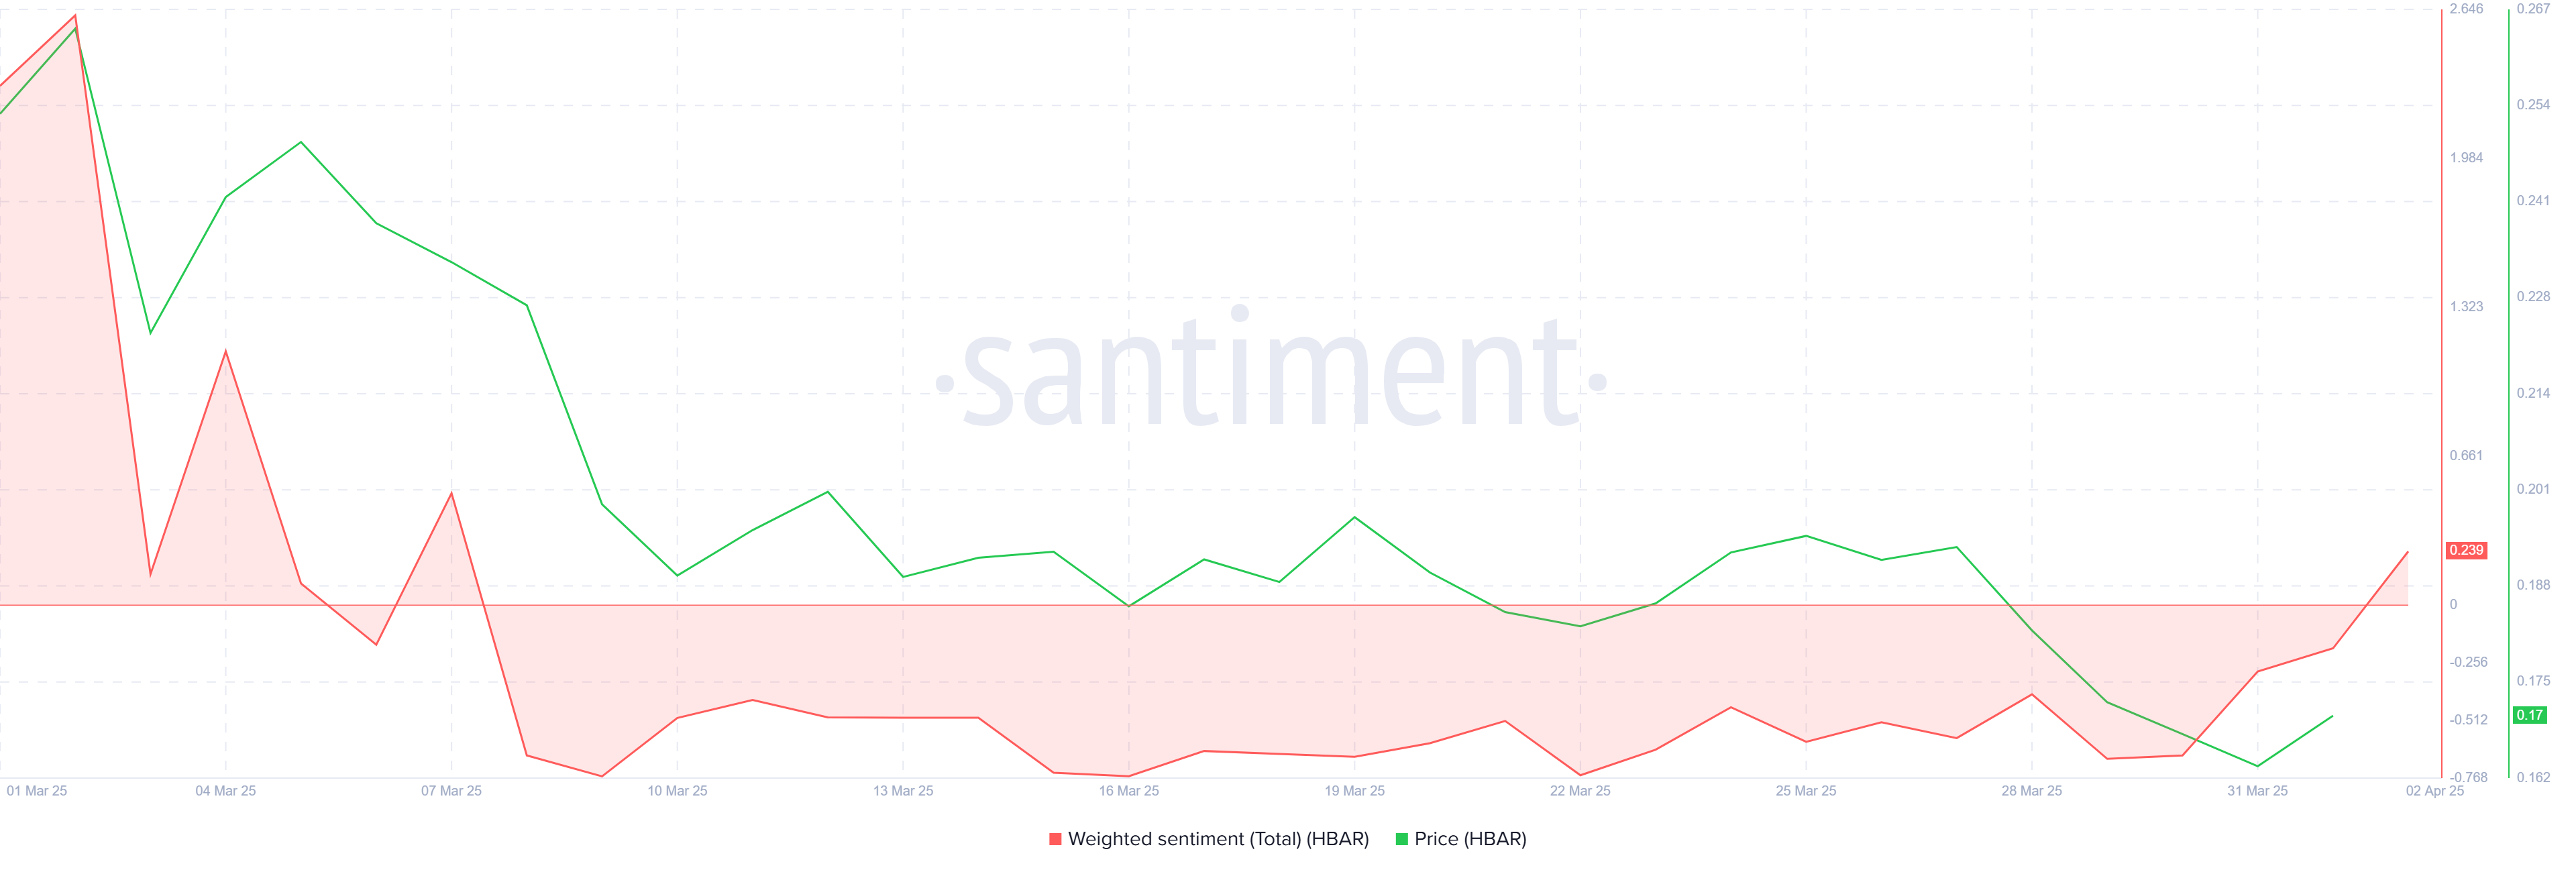
After nearly a month of bearish sentiment, investors are beginning to shift their stance towards bullishness. The Hedera Foundation’s recent move to team up with Zoopto for a late-stage bid to acquire TikTok has played a pivotal role in this shift. If the acquisition is approved, the partnership could expose HBAR to a massive audience due to TikTok’s extensive user base, potentially driving up demand and mainstream adoption.
The prospect of this collaboration has reignited interest among investors, sparking optimism about Hedera’s future growth potential. With TikTok’s wide-reaching influence, the strategic partnership could offer Hedera an edge in the competitive crypto market, encouraging further accumulation of HBAR tokens.
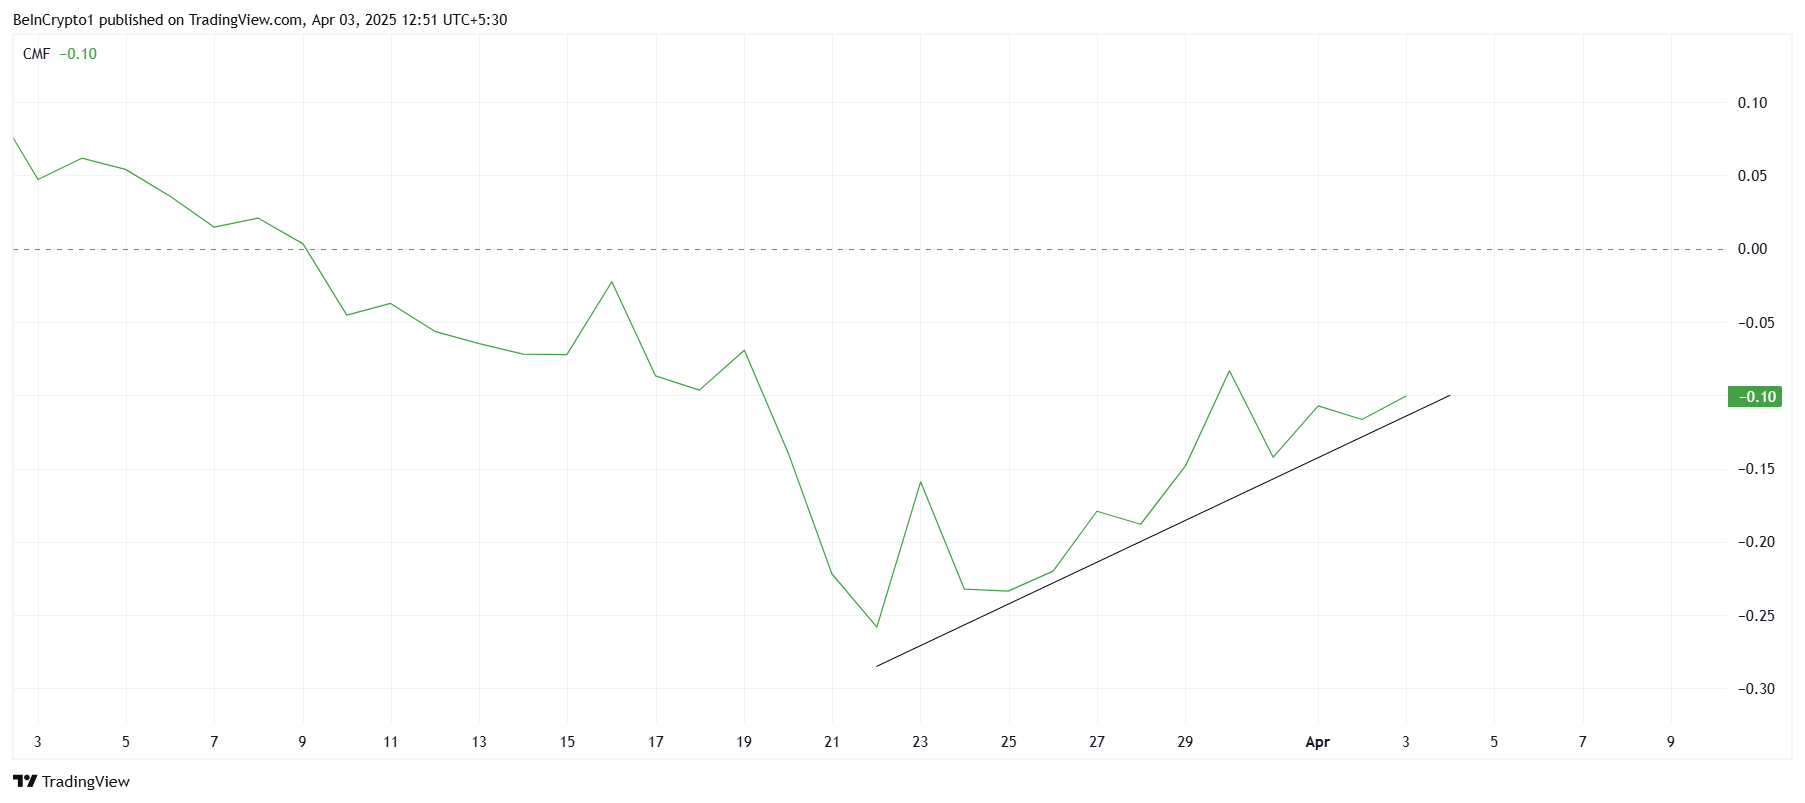
On the technical front, the Chaikin Money Flow (CMF) indicator is showing signs of recovery. The CMF has started to tick upwards, signaling a potential increase in inflows. While it hasn’t yet crossed above the zero line, the growing positive momentum indicates that more capital could be entering the market. Continued inflows could provide the necessary push for HBAR to break through key resistance levels.
The increase in capital flow suggests a strengthening of investor confidence. However, for a sustained rally, more substantial buying pressure will be required to move HBAR above its current price point. If this trend continues, HBAR may see a rise in both investor interest and market value in the near future.
HBAR Price Finds Support
Currently, HBAR is priced at $0.161, just under the key resistance level of $0.165. The next significant resistance lies at $0.197, which has acted as a barrier to HBAR’s price recovery. With a 22% gap between the current price and this resistance, overcoming this hurdle could pave the way for a move toward $0.200.
Given the positive developments surrounding Hedera, it is plausible that HBAR could move toward these resistance levels. If the token can breach $0.165 and then $0.177, the path to $0.197 becomes much clearer. This would mark a critical point for HBAR as it seeks to regain lost ground.
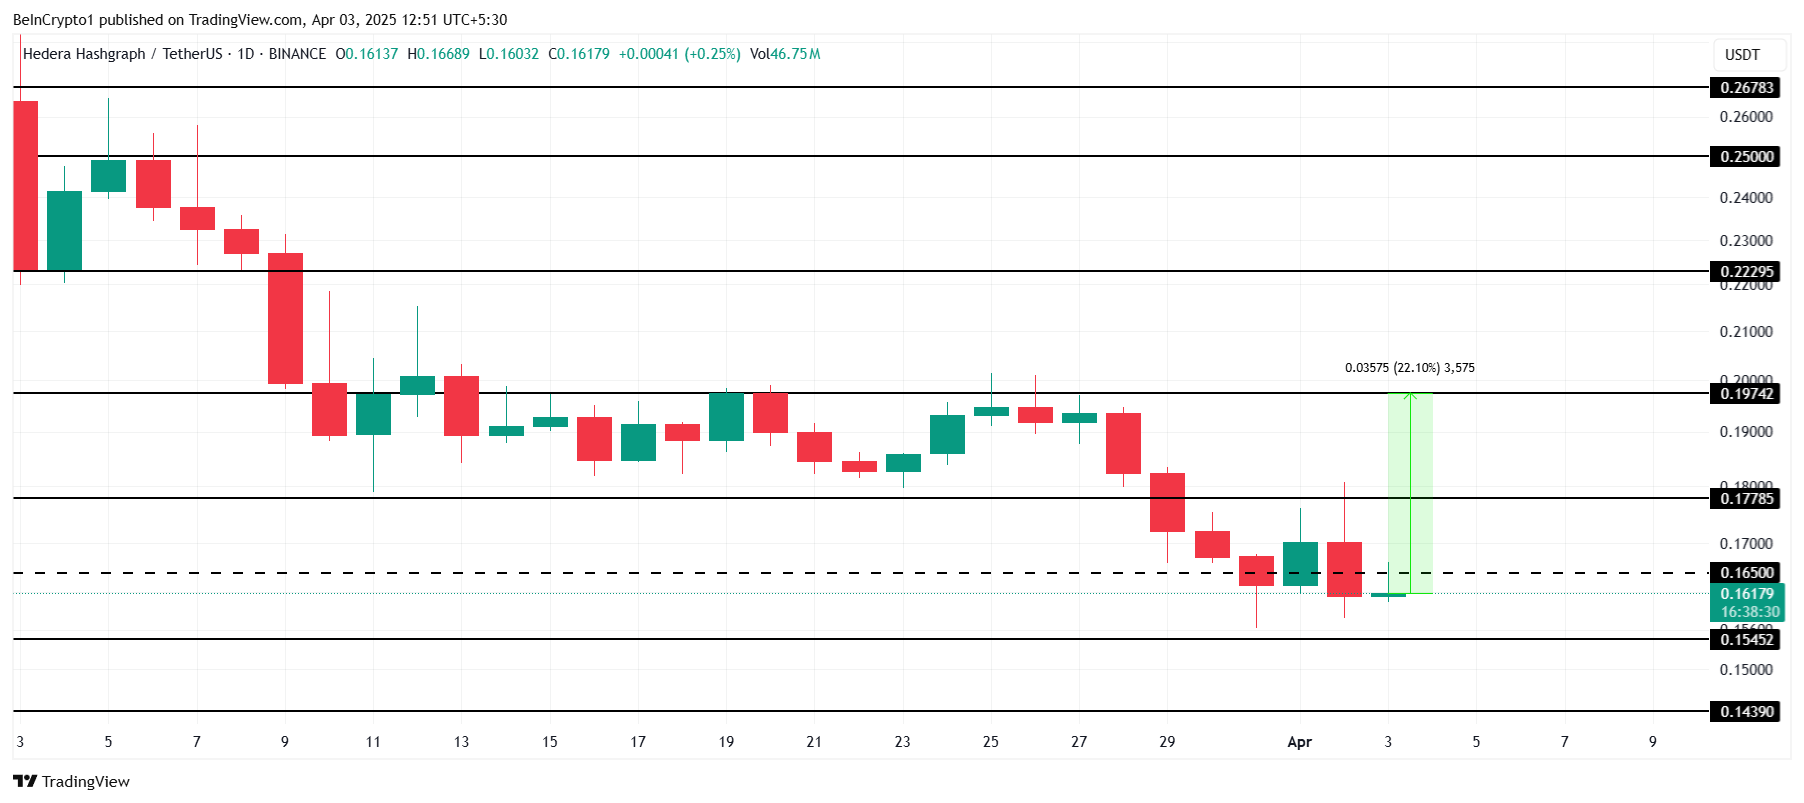
However, if investors decide to take profits and sell before further upward movement, HBAR could fail to breach the $0.177 resistance. Such a scenario could push the price back down towards $0.154 or $0.143, invalidating the bullish outlook and prolonging the consolidation phase.
Disclaimer
In line with the Trust Project guidelines, this price analysis article is for informational purposes only and should not be considered financial or investment advice. BeInCrypto is committed to accurate, unbiased reporting, but market conditions are subject to change without notice. Always conduct your own research and consult with a professional before making any financial decisions. Please note that our Terms and Conditions, Privacy Policy, and Disclaimers have been updated.

Story’s IP is today’s top-performing asset. Its price has surged 5% to trade at $$4.37 at press time, defying the broader market’s lackluster performance.
However, despite the price uptick, the weakening demand for the altcoin raises concerns about its rally’s sustainability.
IP Price Rises, But Falling Volume Signals Weak Buying Momentum
IP’s daily trading volume has plummeted by 7% over the past 24 hours despite the token’s price surge. This forms a negative divergence that hints at the likelihood of a price correction.
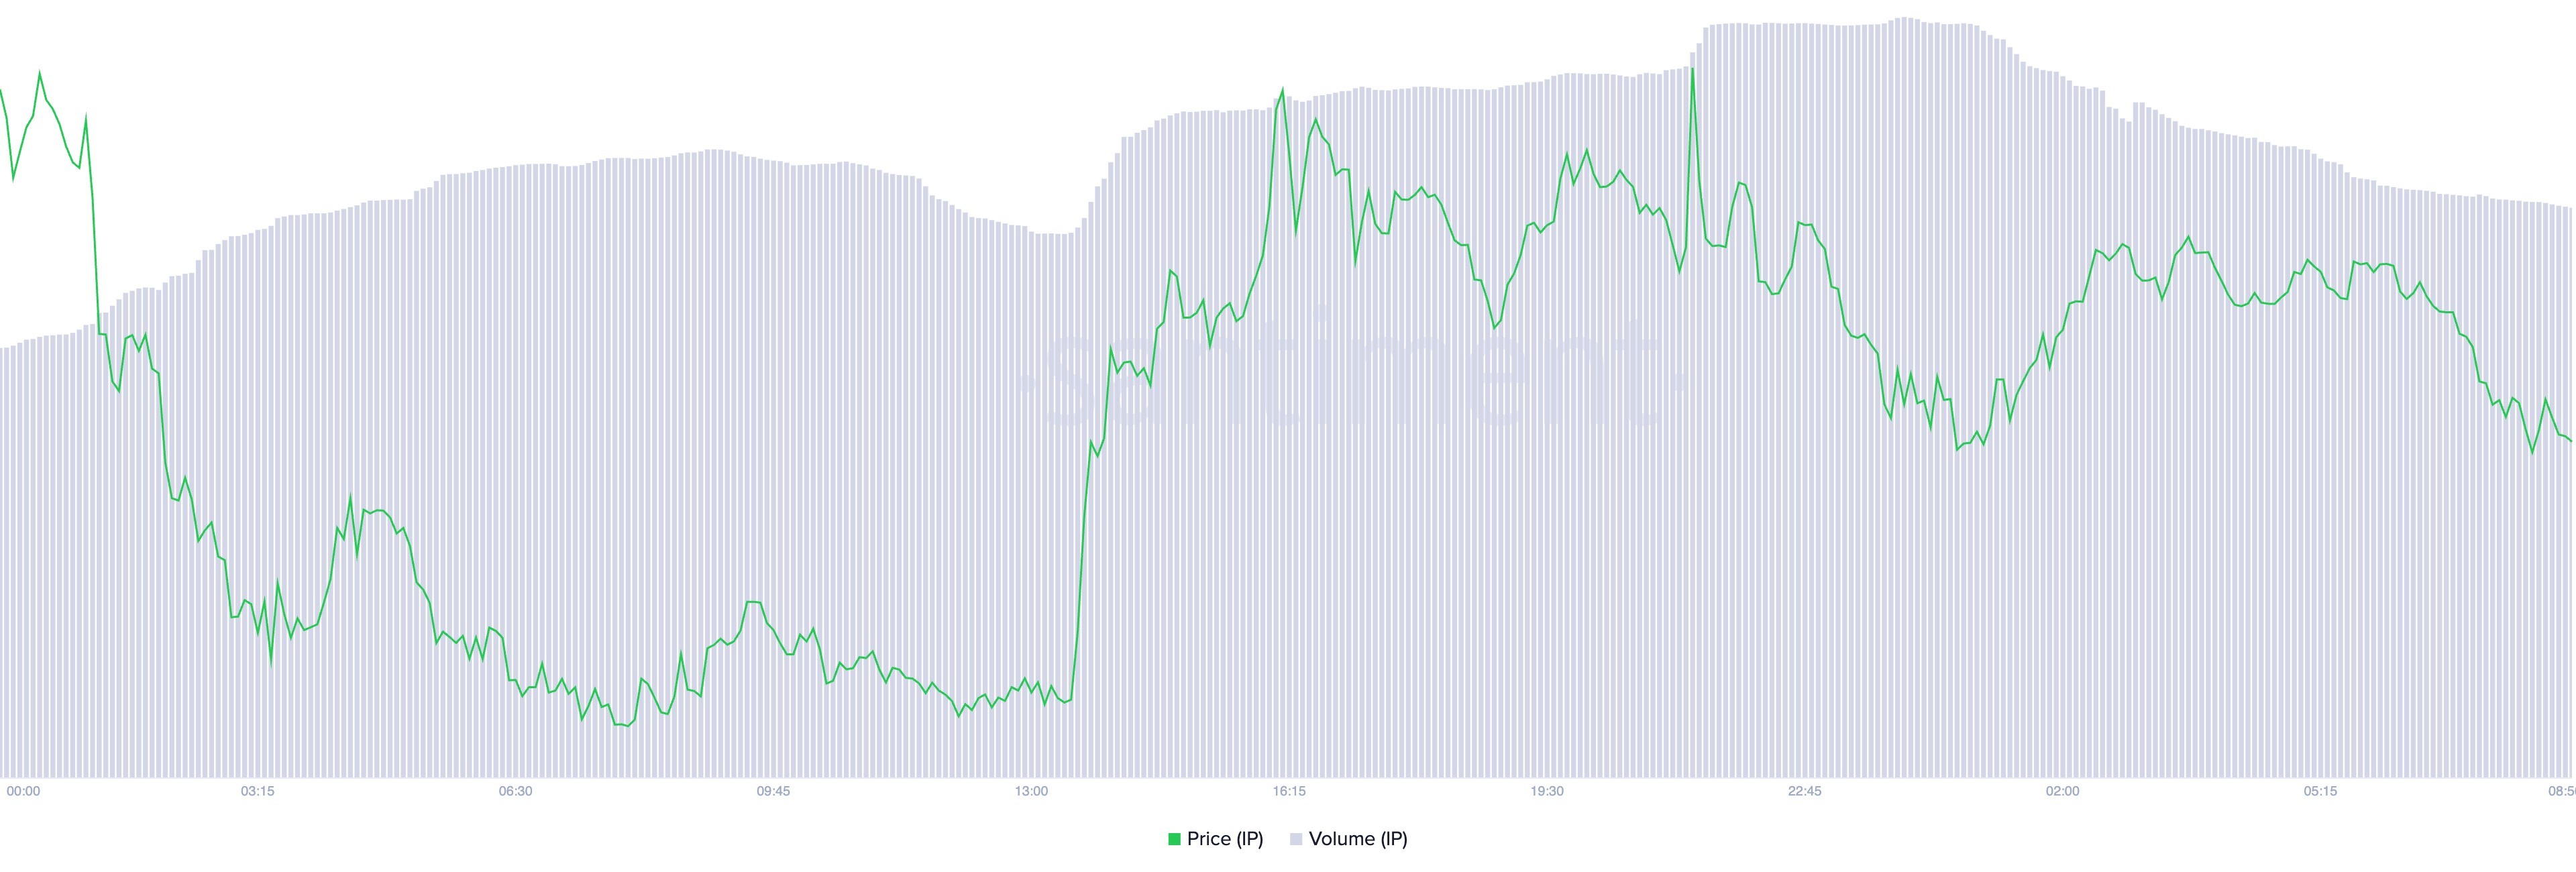
A negative divergence emerges when an asset’s price rises while trading volume falls. It suggests weak buying momentum and a lack of strong market participation.
This indicates that the IP rally may not be sustainable, as fewer traders are backing its upward move. Without sufficient volume to reinforce the price increase, the altcoin is at risk of a potential reversal or correction.
Further, IP’s Moving Average Convergence Divergence (MACD) setup supports this bearish outlook. As of this writing, the token’s MACD line (blue) rests below its signal line (orange), reflecting the selling pressure among IP spot market participants.
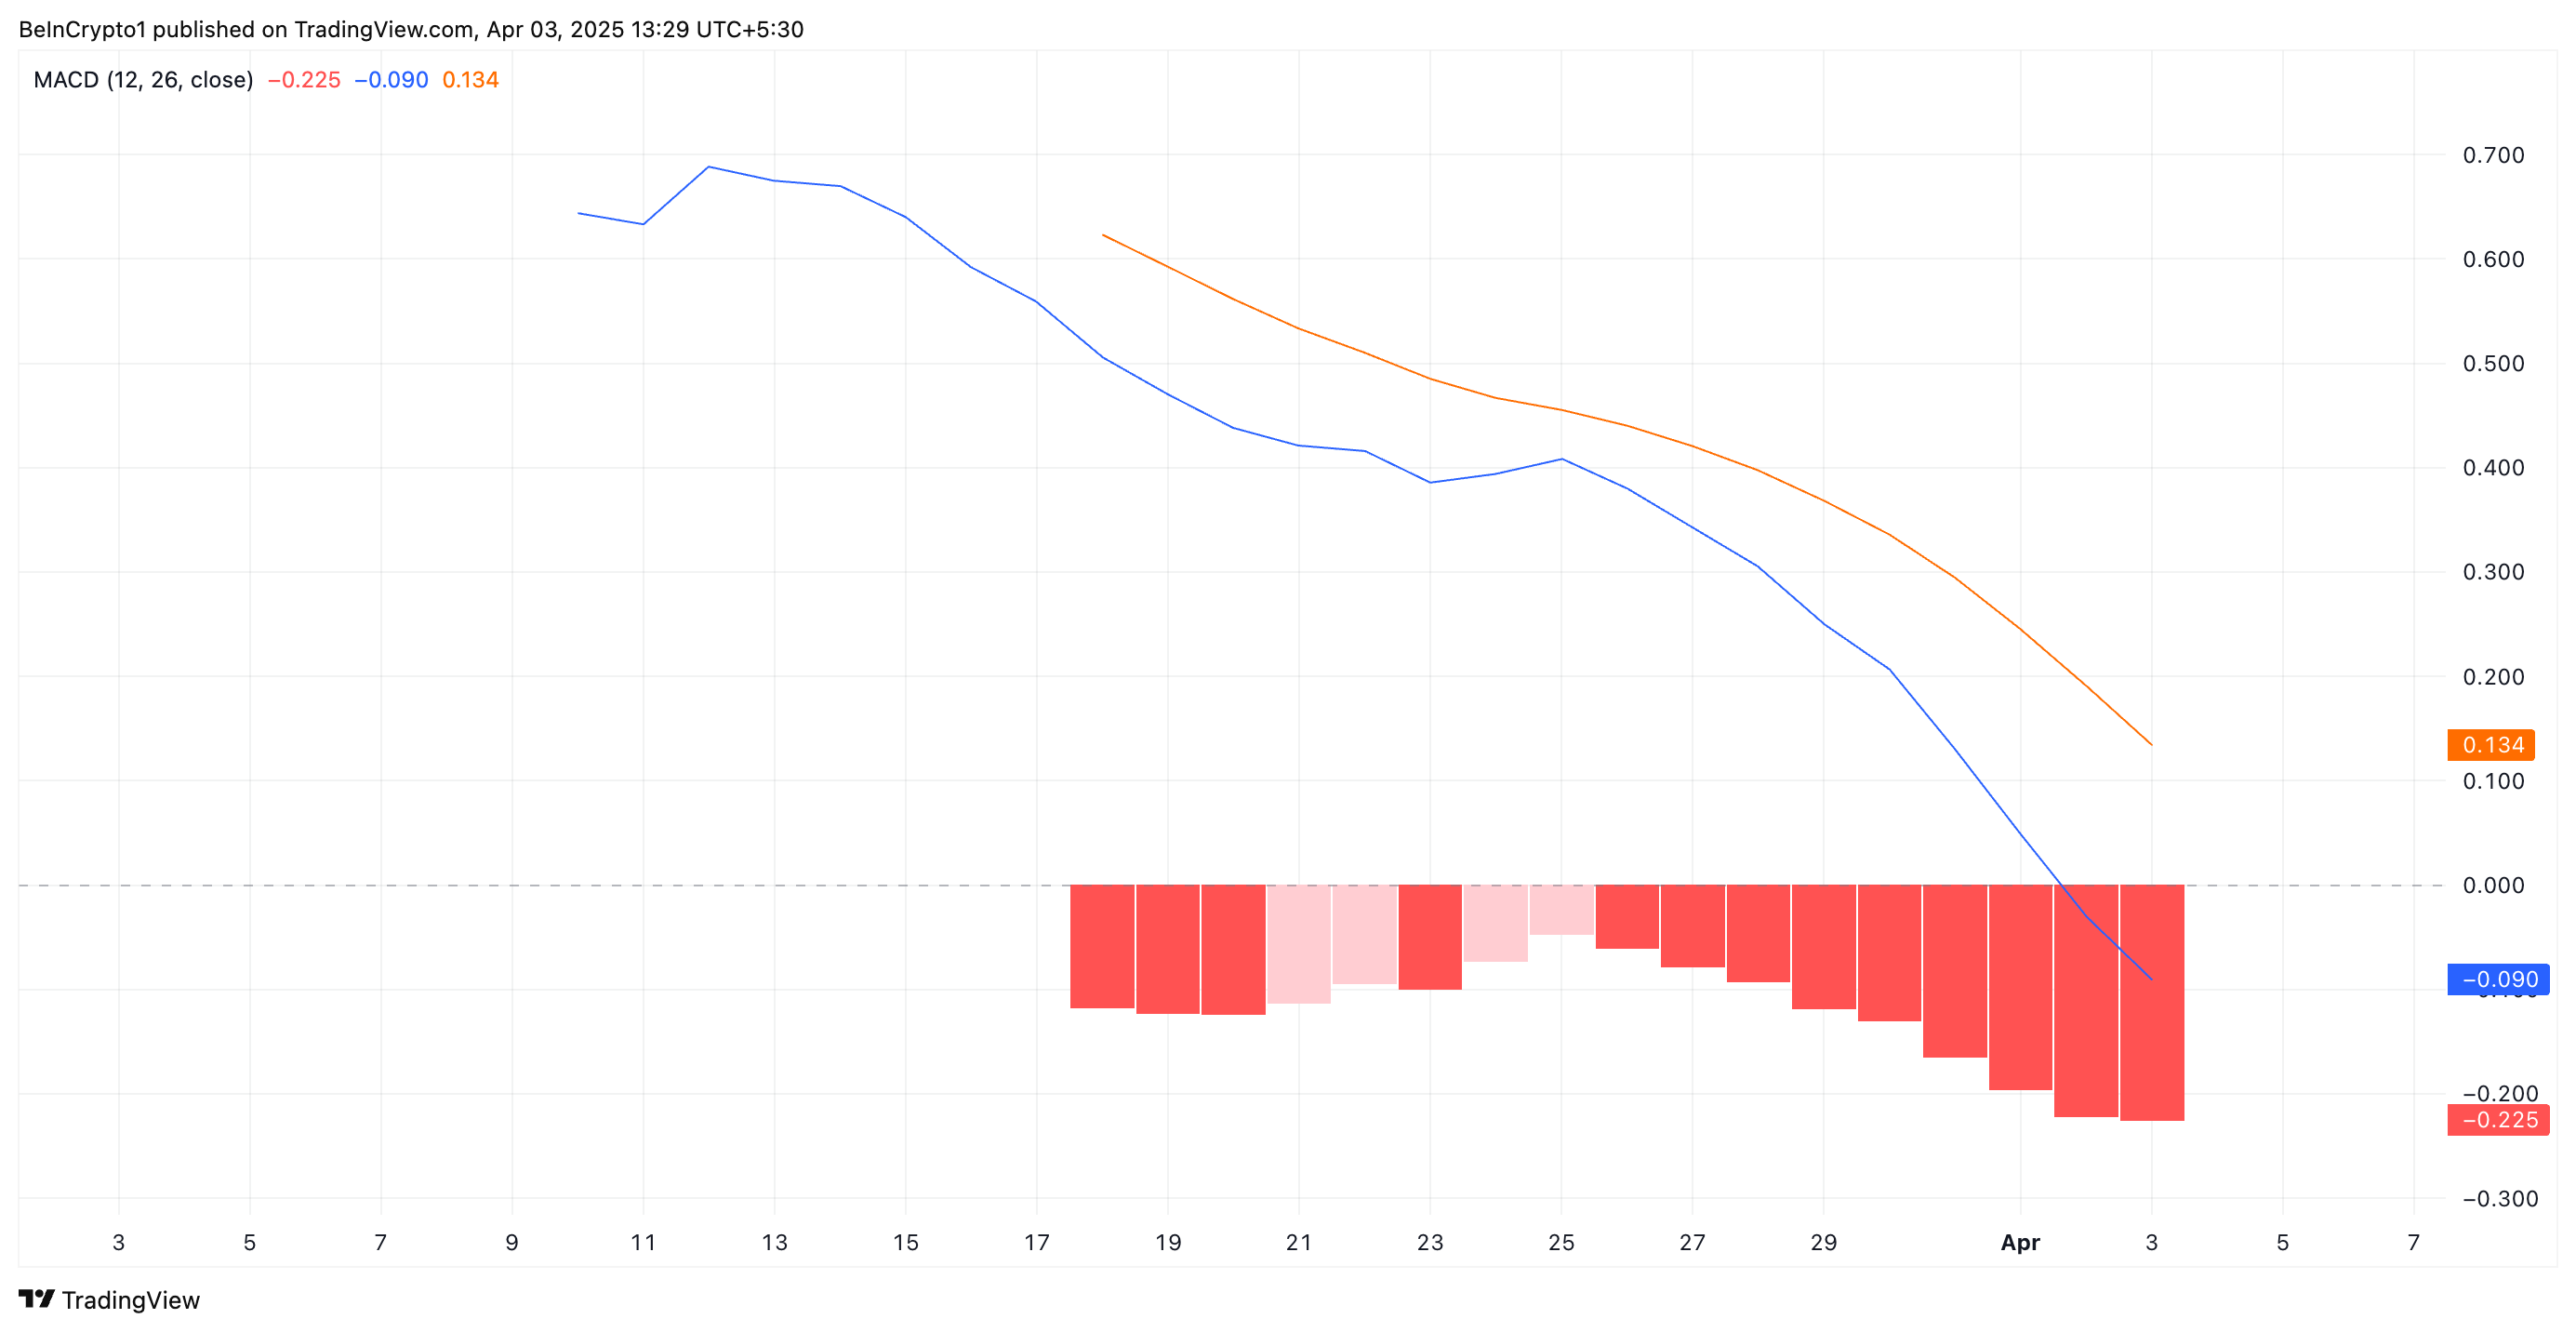
The MACD indicator measures an asset’s trend direction and momentum by comparing two moving averages of an asset’s price. When the MACD line is below the signal line, it indicates bearish momentum, suggesting a potential downtrend or continued selling pressure.
If this trend persists, IP’s recent 5% price surge may lose steam, increasing the likelihood of a short-term correction.
IP’s Bearish Structure Remains Intact – How Low Can It Go?
On the daily chart, IP has traded within a descending parallel channel since March 25. This bearish pattern emerges when an asset’s price moves within two downward-sloping parallel trendlines, indicating a consistent pattern of lower highs and lower lows.
This pattern confirm’s IP prevailing downtrend, suggesting continued bearish pressure unless a breakout above resistance occurs.
If the downtrend strengthens, IP’s price could break below the lower trend line of the descending parallel channel and fall to $3.68.
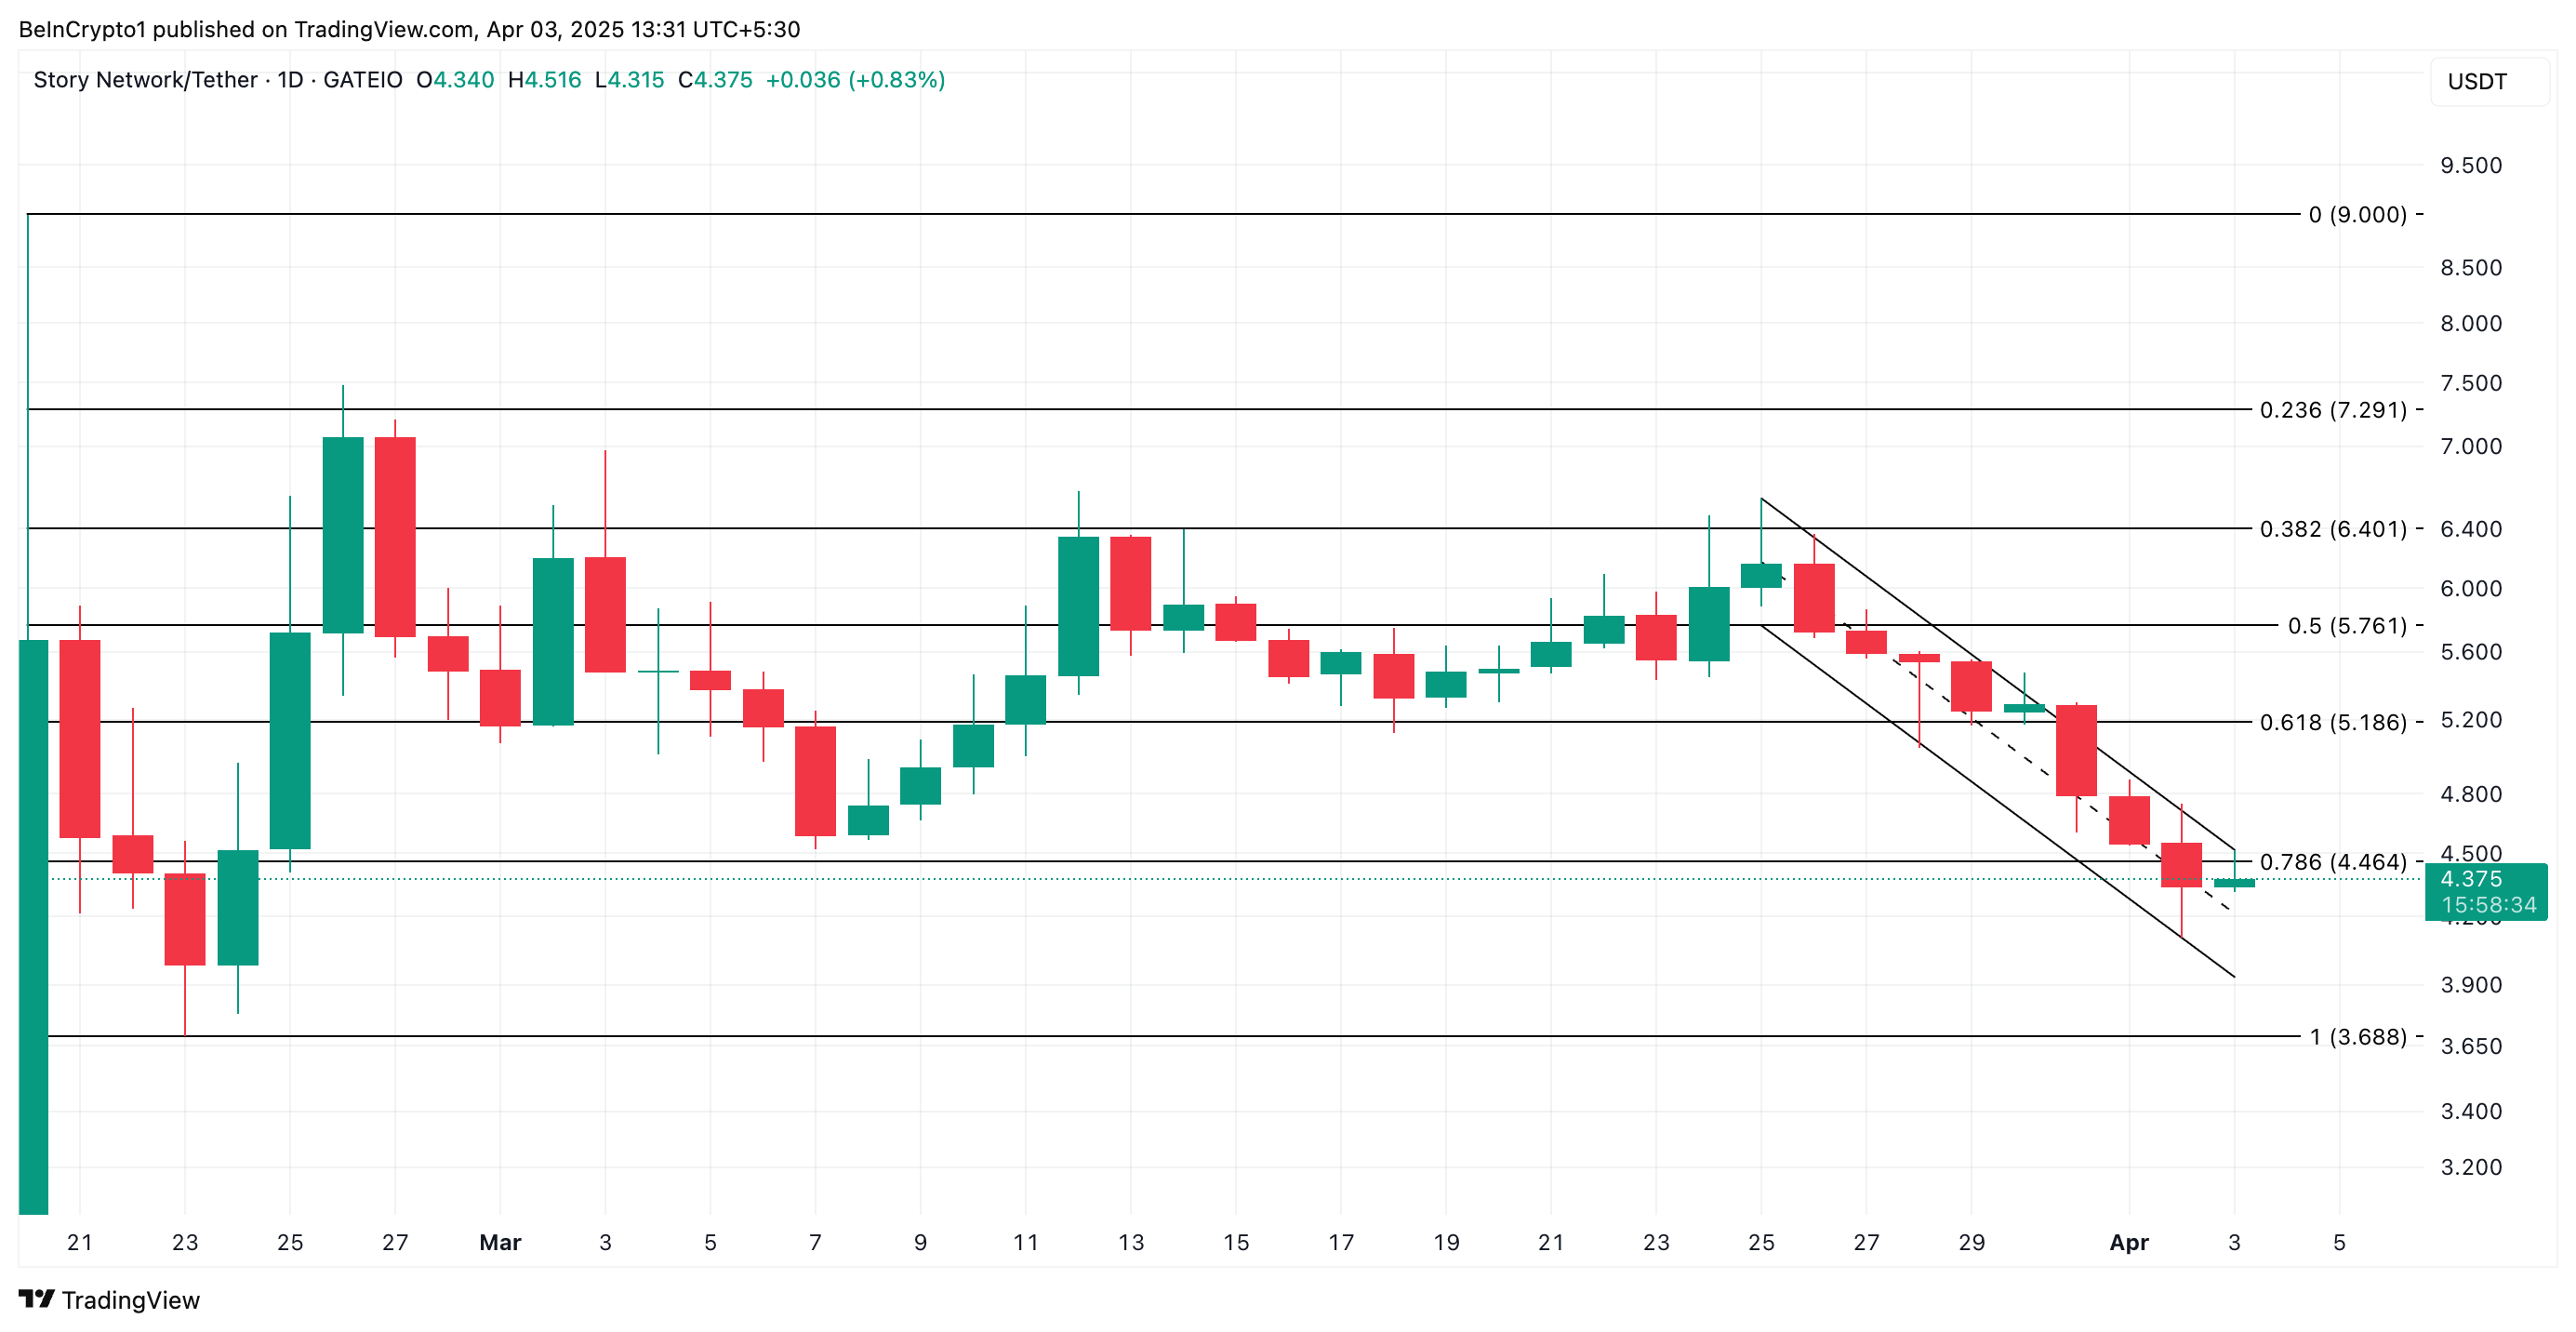
On the other hand, if the altcoin witnesses a spike in new demand, it could break above the bearish channel and rally toward $5.18.
Disclaimer
In line with the Trust Project guidelines, this price analysis article is for informational purposes only and should not be considered financial or investment advice. BeInCrypto is committed to accurate, unbiased reporting, but market conditions are subject to change without notice. Always conduct your own research and consult with a professional before making any financial decisions. Please note that our Terms and Conditions, Privacy Policy, and Disclaimers have been updated.

Pi Network recently celebrated a milestone with its first PiFest in the Open Network, showcasing impressive participation numbers.
However, despite the event’s success, the value of Pi Coin (PI) continues to plummet, sparking concerns among its community of Pioneers.
PiFest Fails to Bolster Pi Coin’s Value
Pi Network’s team announced the results of its first PiFest, a community-driven event designed to integrate PI into local commerce. According to the post, over 125,000 registered and 58,000 active sellers participated in the event. In addition, 1.8 million Pioneers utilized the Map of Pi app for transactions.
The event facilitated a wide range of purchases, from groceries and clothing to professional services like design and automotive repairs, showcasing PI’s growing utility in the real world.
“PiFest is more than a celebration—it exemplifies and demonstrates Pi’s real-world utility. With Open Network fully live, PiFest shows how Pi can support genuine commerce and empower local economies worldwide,” the blog read.
Despite these achievements, the event failed to bolster PI’s market performance. According to data from CoinGecko, PI has fallen to the 31st position in the rankings. Currently, Pi Coin is trading 78.7% below its peak value. Meanwhile, it’s just 3.1% above its lowest recorded price.
As of press time, Pi Coin’s trading price was $0.6, a decline of 8.2% over the past day. Additionally, over the past 30 days, the token has experienced a significant drop of 64.5%.

This sharp downturn has fueled negative sentiment within the community.
“The comments are getting more and more negative from this accounts tweets. Finally looks like “some people” are waking up to this being a failure in terms of what promises were sold of what this would be, and obviously is not,” a user posted on X.
Meanwhile, users are increasingly considering converting their PI holdings to other assets amid the altcoin’s ongoing struggles to maintain its value. In fact, a Pioneer openly debated trading their PI for 1 Ethereum (ETH).
“Shortly after Pi launched, my holdings were worth around €7,000. I decided to hold onto them, expecting a potential Binance listing or a major announcement from the team—something that never happened. Now, my Pi is worth around €1,700, and I feel extremely disappointed,” a user wrote on Reddit.
The post sparked a heated discussion, with some users encouraging the trade, citing Ethereum’s more established market position. Despite this, many still continue to advocate for PI, believing in its long-term potential.
“Be patient. Trust the process. Believe in the Pi core team, developers, ecosystem and the community. Do not spread FUD. Hold your Pi. Never sell cheap. You will be rewarded big time in the future,” a Pioneer posted.
As the community grapples with the token’s underperformance, opinions remain divided. The outcome of this ongoing debate will likely depend on future developments and the Pi Network’s ability to regain investor confidence.
Disclaimer
In adherence to the Trust Project guidelines, BeInCrypto is committed to unbiased, transparent reporting. This news article aims to provide accurate, timely information. However, readers are advised to verify facts independently and consult with a professional before making any decisions based on this content. Please note that our Terms and Conditions, Privacy Policy, and Disclaimers have been updated.
John Squire Says XRP Could Spark A Wave of Early Retirements

HBAR Foundation Eyes TikTok, Price Rally To $0.20 Possible

BlackRock Approved by FCA to Operate as UK Crypto Asset Firm

Ethereum Trading In ‘No Man’s Land’, Breakout A ‘Matter Of Time’?

Movimiento millonario de Solana, SOLX es la mejor opción

IP Token Price Surges, but Weak Demand Hints at Reversal

2.52 Million Altcoins Are Ruining Crypto’s Future

Animoca Brands Valuation Tanks 75% In Two Years, Here’s Why

Crypto exchange BingX hacked for $43 million

Are The Big Players Losing Interest?

Hong Kong’s Securities Association Tips Authorities On Crypto Self-Regulation

Coinbase cbBTC Set to go Live on Solana
2.52 Million Altcoins Are Ruining Crypto’s Future
Animoca Brands Valuation Tanks 75% In Two Years, Here’s Why
Crypto exchange BingX hacked for $43 million
Are The Big Players Losing Interest?
Hong Kong’s Securities Association Tips Authorities On Crypto Self-Regulation
Coinbase cbBTC Set to go Live on Solana
-

 Altcoin24 hours ago
Franklin Templeton Eyes Crypto ETP Launch In Europe After BlackRock & 21Shares
-

 Bitcoin23 hours ago
Lummis Confirms Treasury Probes Direct Buys
-

 Regulation22 hours ago
Kraken Obtains Restricted Dealer Registration in Canada
-
 Altcoin18 hours ago
Here’s Why This Analyst Believes XRP Price Could Surge 44x
-
 Altcoin17 hours ago
How Will Elon Musk Leaving DOGE Impact Dogecoin Price?
-

 Ethereum15 hours ago
Why A Massive Drop To $1,400 Could Rock The Underperformer
-
 Altcoin14 hours ago
First Digital Trust Denies Justin Sun’s Allegations, Claims Full Solvency
-
 Altcoin15 hours ago
Will Cardano Price Bounce Back to $0.70 or Crash to $0.60?