
Market
Has Bitcoin Price Hit Bottom? 4 Crucial On-Chain Signals
In the crypto ecosystem, pinpointing the exact moment Bitcoin (BTC) prices bottom out is akin to finding a needle in a haystack. Recent data, however, provides some insights into whether the Bitcoin price has bottomed.
As the digital currency touched a one-month low of $58,500, analysts from CryptoQuant and Glassnode revealed four crucial on-chain indicators to watch. These indicators could be useful for analyzing market behaviors near the low points and understanding the conditions necessary for prices to rebound and rise again.
1. Tracking Bitcoin Demand Growth
The first quarter of 2024 saw a remarkable surge in Bitcoin demand coinciding with the launch of US spot ETFs, establishing record highs. However, post-May, this demand has seen a significant slowdown.
It is vital to observe the demand from permanent holders to determine whether Bitcoin has bottomed out. Permanent holders are now buying at a rate of 72,000 Bitcoin per month.
However, demand is significantly lower than in early 2024. A resurgence to these levels is essential for a sustainable price rally.
Read more: Bitcoin (BTC) Price Prediction 2024/2025/2030

Apart from the demand side, Glassnode’s analysis reveals significant insights into the behavior of long-term holders (LTHs), who play a crucial role in the supply side as well. LTHs typically distribute coins and take profits during bull markets, helping to establish market cycle tops.
Currently, the market is witnessing a regime where LTH divestment is moderated. This indicates a move toward equilibrium rather than euphoria, which is a phase when the unrealized profits of LTHs are more than 250%. The high profits motivate LTHs to sell BTC aggressively, marking a market top.
The current equilibrium phase suggests that while LTHs are not yet ready to offload their holdings massively, they are also not accumulating at a pace, thus providing a balanced supply dynamic in the market.
2. Assessing the Profitability of Traders
Another indicator is the profitability of traders. Currently, on-chain unrealized margins for traders are in the negative, suggesting reduced selling pressure but not necessarily a readiness for a price rebound.
For a bullish signal, these margins need to turn positive and rise above their 30-day simple moving average.
“Since mid-June, the spot price has plunged below the cost basis of both the 1-week to 1-month-old holders ($68,500) and 1-month to 3-month-old holders ($66,400). If this structure persists, it has historically resulted in a deterioration of investor confidence and risks this correction being deeper and taking longer to recover from,” Glassnode said.
Read more: 8 Best On-Chain Analysis Tools in 2024

3. Evaluating Stablecoin Liquidity
The growth in Tether’s USDT market capitalization is a proxy for liquidity in the cryptocurrency market. After peaking at $12.6 billion in late April, the growth over the past 60 days has slowed dramatically to just $2.5 billion, marking the slowest pace since November 2023.
An acceleration in stablecoin liquidity is essential for Bitcoin prices to rally. This will provide the market with the needed capital inflow to support higher price levels.

4. Monitoring the Ultimate Bitcoin Price Support Level
The final indicator to watch is Bitcoin’s support level, currently pegged at $56,000 based on Metcalfe’s price valuation bands.
“This valuation is based on the Metcalfe law that states the value of a network is proportional to the number of users in the network,” CryptoQuant explains.
This level has historically acted as both resistance and support in previous cycles. It also provided support to Bitcoin when its price dropped to around $56,500 in May 2024. A drop below this critical support could signal a significant market correction while maintaining above this level could suggest the market has bottomed.
Read more: How To Evaluate Cryptocurrencies with On-chain & Fundamental Analysis

Amid these technical indicators, social sentiment also shows signs that the market may believe the bottom has been reached. Analysis from Santiment highlighted a spike in social volume and dominance for the term “bottom,” suggesting a growing belief among investors and traders that Bitcoin’s price may not fall further.
However, the market often tends to go against the retail sentiments. Hence, traders and investors should consider the nuances carefully and do their own research before building new market positions.
Disclaimer
In line with the Trust Project guidelines, this price analysis article is for informational purposes only and should not be considered financial or investment advice. BeInCrypto is committed to accurate, unbiased reporting, but market conditions are subject to change without notice. Always conduct your own research and consult with a professional before making any financial decisions. Please note that our Terms and Conditions, Privacy Policy, and Disclaimers have been updated.


Bitcoin price is rising steadily above the $95,000 zone. BTC is showing positive signs and might soon hit the $100,000 milestone level.
- Bitcoin started a fresh increase above the $95,000 zone.
- The price is trading above $95,000 and the 100 hourly Simple moving average.
- There is a key bullish trend line forming with support at $95,200 on the hourly chart of the BTC/USD pair (data feed from Kraken).
- The pair could continue to rise if it clears the $100,000 resistance zone.
Bitcoin Price Sets Another ATH
Bitcoin price remained supported above the $92,000 level. BTC formed a base and started a fresh increase above the $95,000 level. It cleared the $96,500 level and traded to a new high at $98,999 before there was a pullback.
There was a move below the $98,000 level. However, the price remained stable above the 23.6% Fib retracement level of the upward move from the $91,500 swing low to the $98,990 high. There is also a key bullish trend line forming with support at $95,200 on the hourly chart of the BTC/USD pair.
The trend line is close to the 50% Fib retracement level of the upward move from the $91,500 swing low to the $98,990 high. Bitcoin price is now trading above $96,000 and the 100 hourly Simple moving average.
On the upside, the price could face resistance near the $98,880 level. The first key resistance is near the $99,000 level. A clear move above the $99,000 resistance might send the price higher. The next key resistance could be $100,000.

A close above the $100,000 resistance might initiate more gains. In the stated case, the price could rise and test the $102,000 resistance level. Any more gains might send the price toward the $104,500 resistance level.
Downside Correction In BTC?
If Bitcoin fails to rise above the $100,000 resistance zone, it could start a downside correction. Immediate support on the downside is near the $98,000 level.
The first major support is near the $96,800 level. The next support is now near the $95,500 zone and the trend line. Any more losses might send the price toward the $92,000 support in the near term.
Technical indicators:
Hourly MACD – The MACD is now gaining pace in the bullish zone.
Hourly RSI (Relative Strength Index) – The RSI for BTC/USD is now above the 50 level.
Major Support Levels – $96,800, followed by $95,500.
Major Resistance Levels – $99,000, and $100,000.
Ripple’s (XRP) price rallied by 25% in the last 24 hours following Gary Gensler’s announcement that he would resign as the US Securities and Exchange Commission (SEC) chair on January 20, 2025.
This development comes as a relief to the popular “XRP Army,” which has had to deal with suppressed price action due to the Gensler-led SEC’s nonstop petitions against Ripple. But that is not all that happened.
Ripple Bears Face Notable Liquidation Following Gensler’s Notification
Gensler’s announcement appears to be a positive development for the broader crypto market. But XRP holders seemed to benefit the most. This was particularly significant given the unresolved Ripple-SEC legal issues that have persisted throughout the SEC Chair’s tenure.
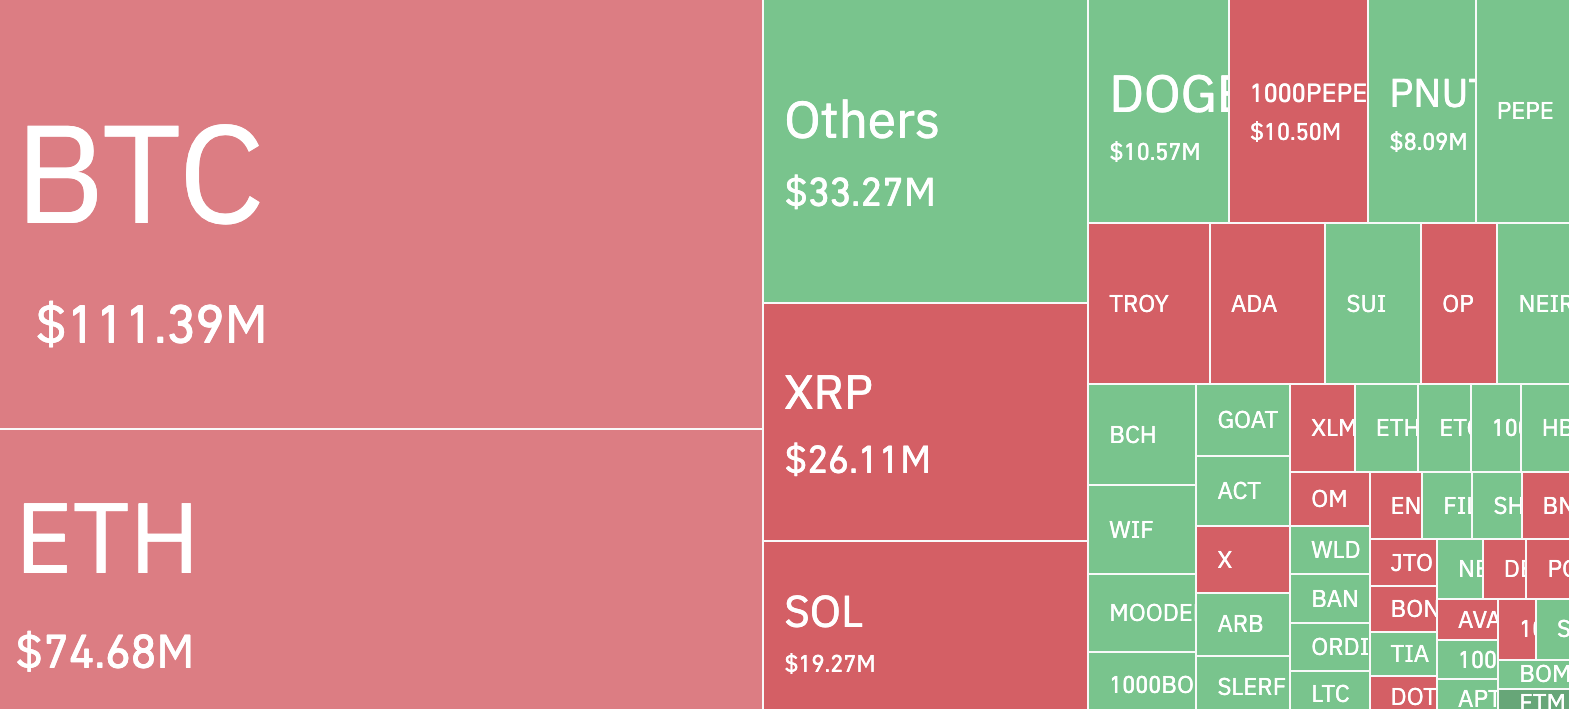
As a result, it came as no surprise that XRP price rallied and outpaced those of any other cryptocurrency in the top 10. Furthermore, the development triggered liquidations totaling $26.11 million over the last 24 hours.
Liquidation occurs when a trader fails to meet the margin requirements for a leveraged position. This forces the exchange to sell off their assets to prevent further losses. In XRP’s case, the liquidation primarily resulted in a short squeeze.
A short squeeze happens when a large number of short positions (traders betting on price declines) are forced to close, driving the price higher as they rush back to buy back the asset.
At press time, XRP trades at $1.40 and currently has a market cap of $80.64 billion. With Gensler almost gone, crypto lawyer John Deaton noted that XRP price gains could be higher, and the market cap could climb to $100 billion.
“XRP soon will achieve a $100B market cap. Times are changing,” Deaton wrote on X.
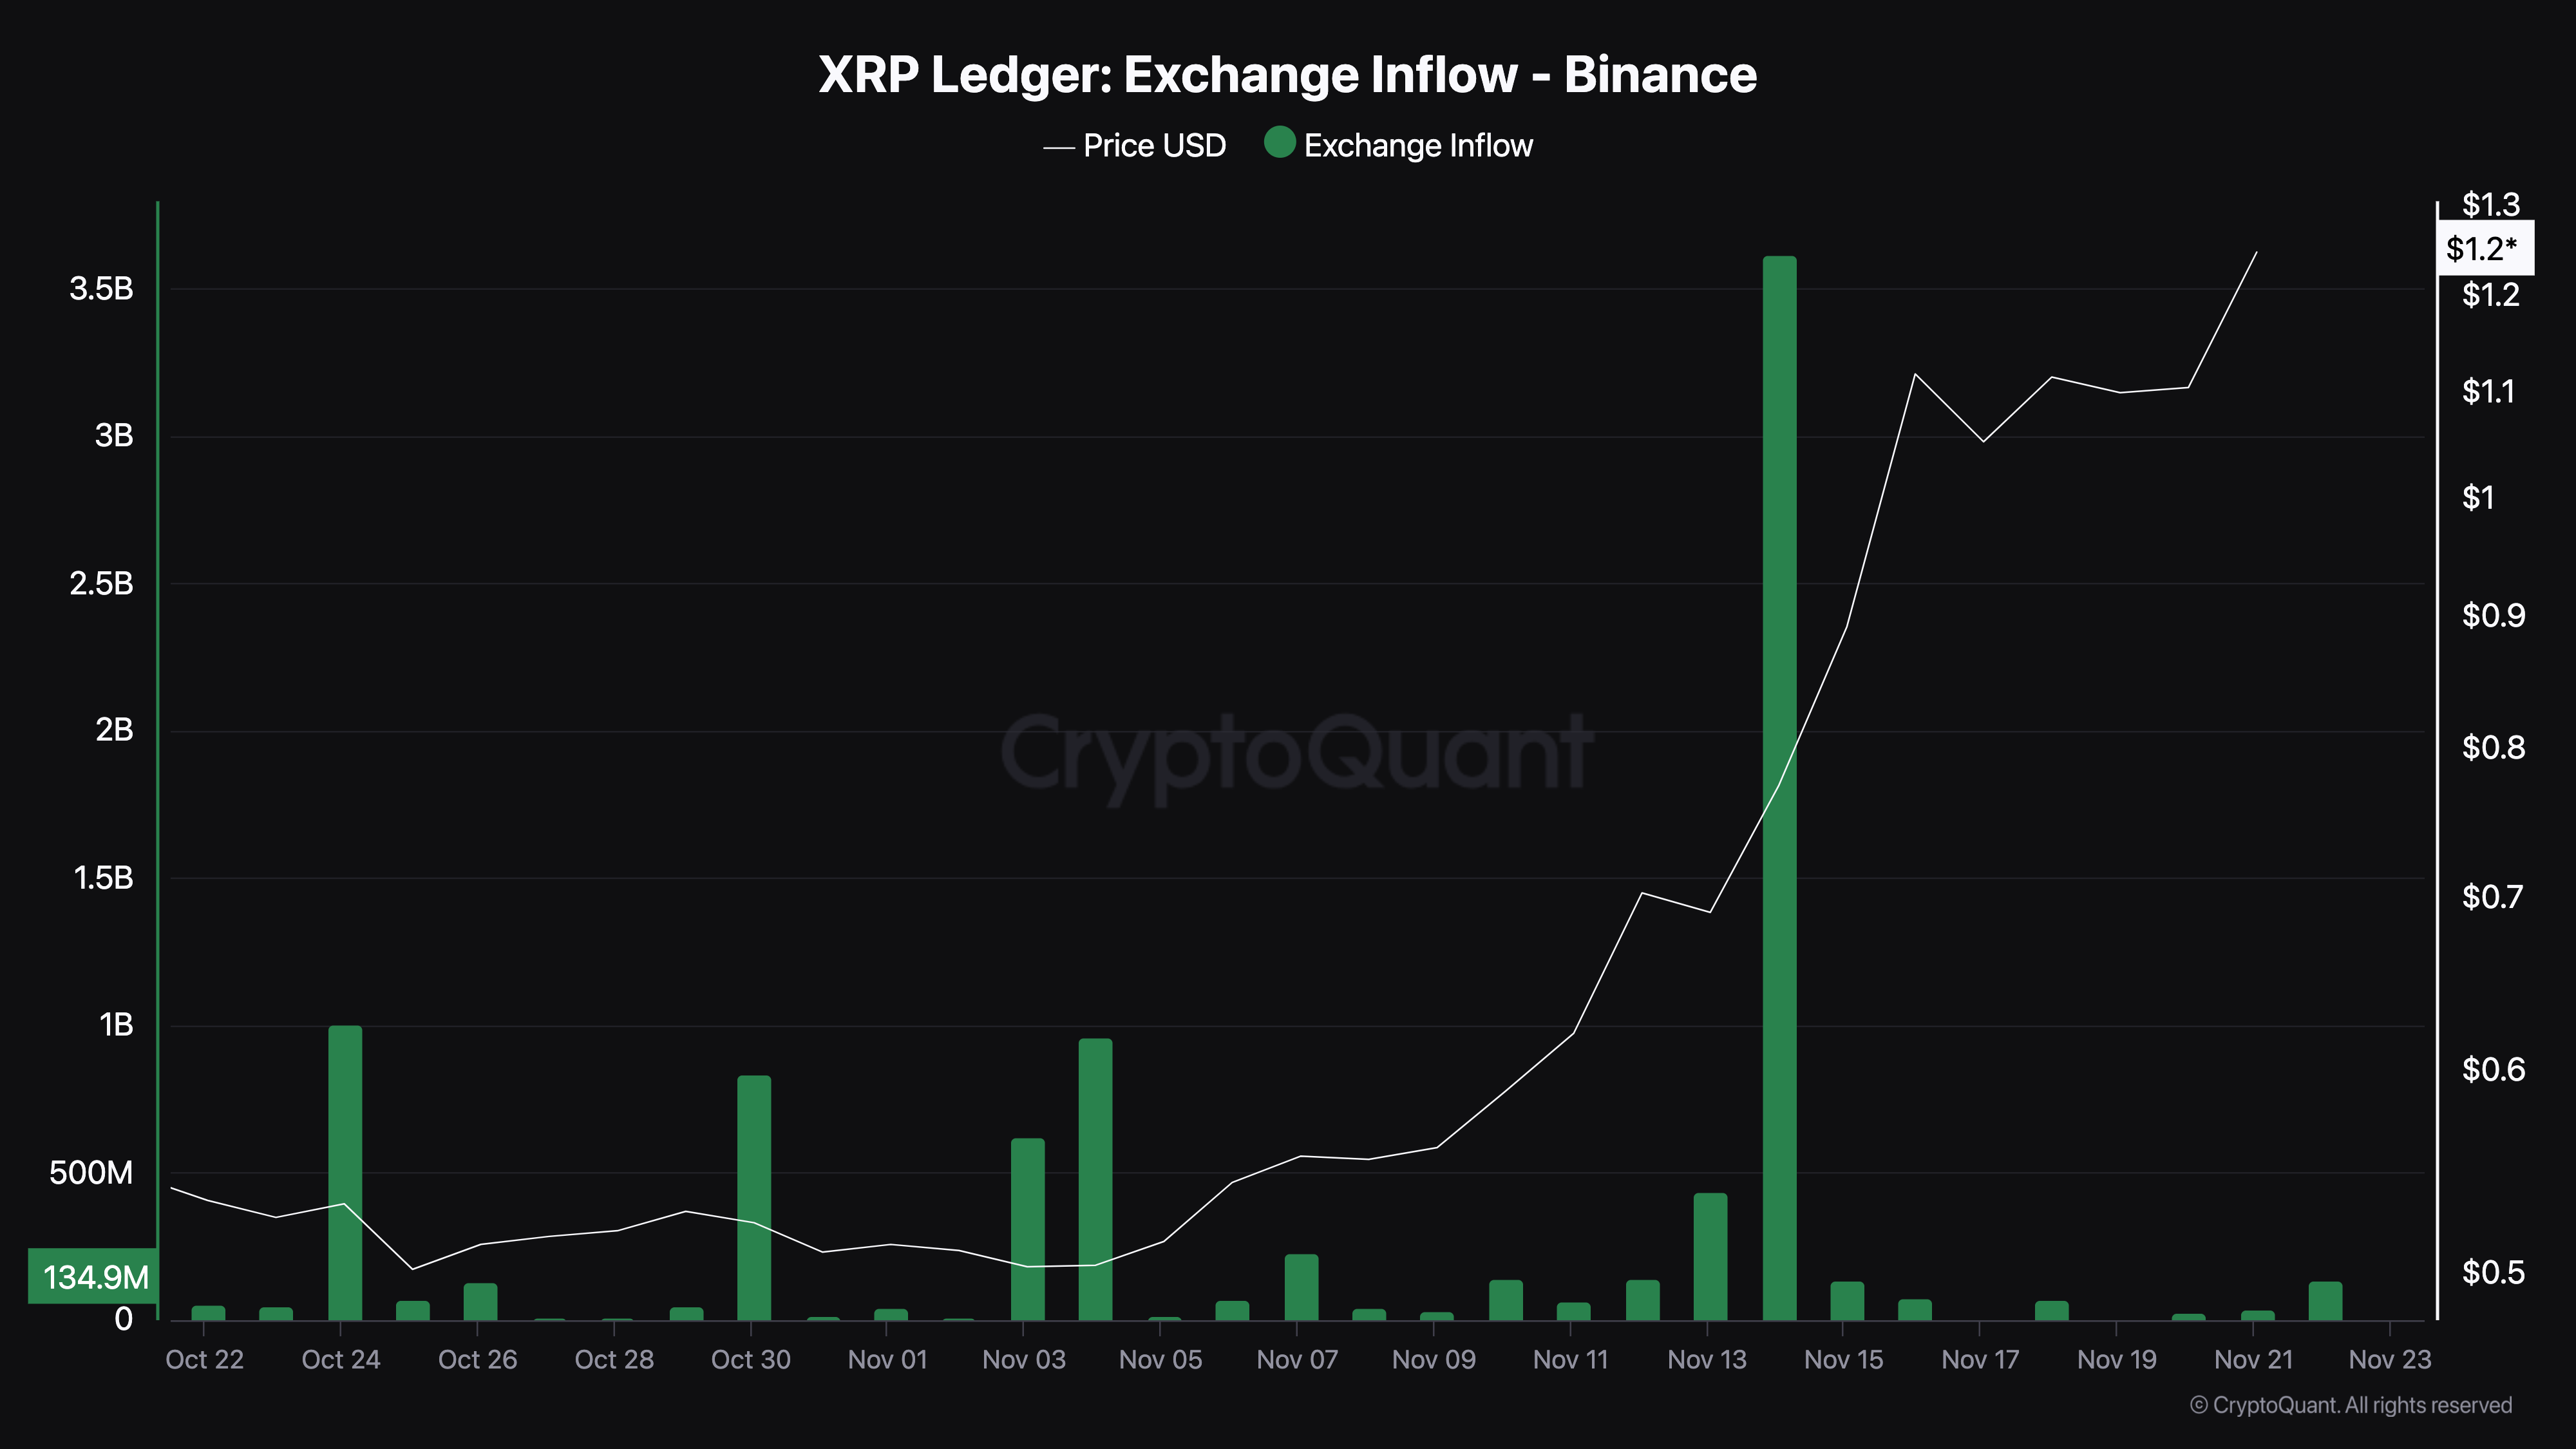
Meanwhile, CryptoQuant data shows that the total number of XRP sent into exchange has significantly decreased. Typically, high values indicate increased selling pressure in the spot market. This is because it suggests that more assets are being offloaded, potentially driving prices lower.
However, since it is low, XRP holders are refraining from selling. If this remains the case, the token’s value could rise higher than $1.40.
XRP Price Prediction: $2 Coming?
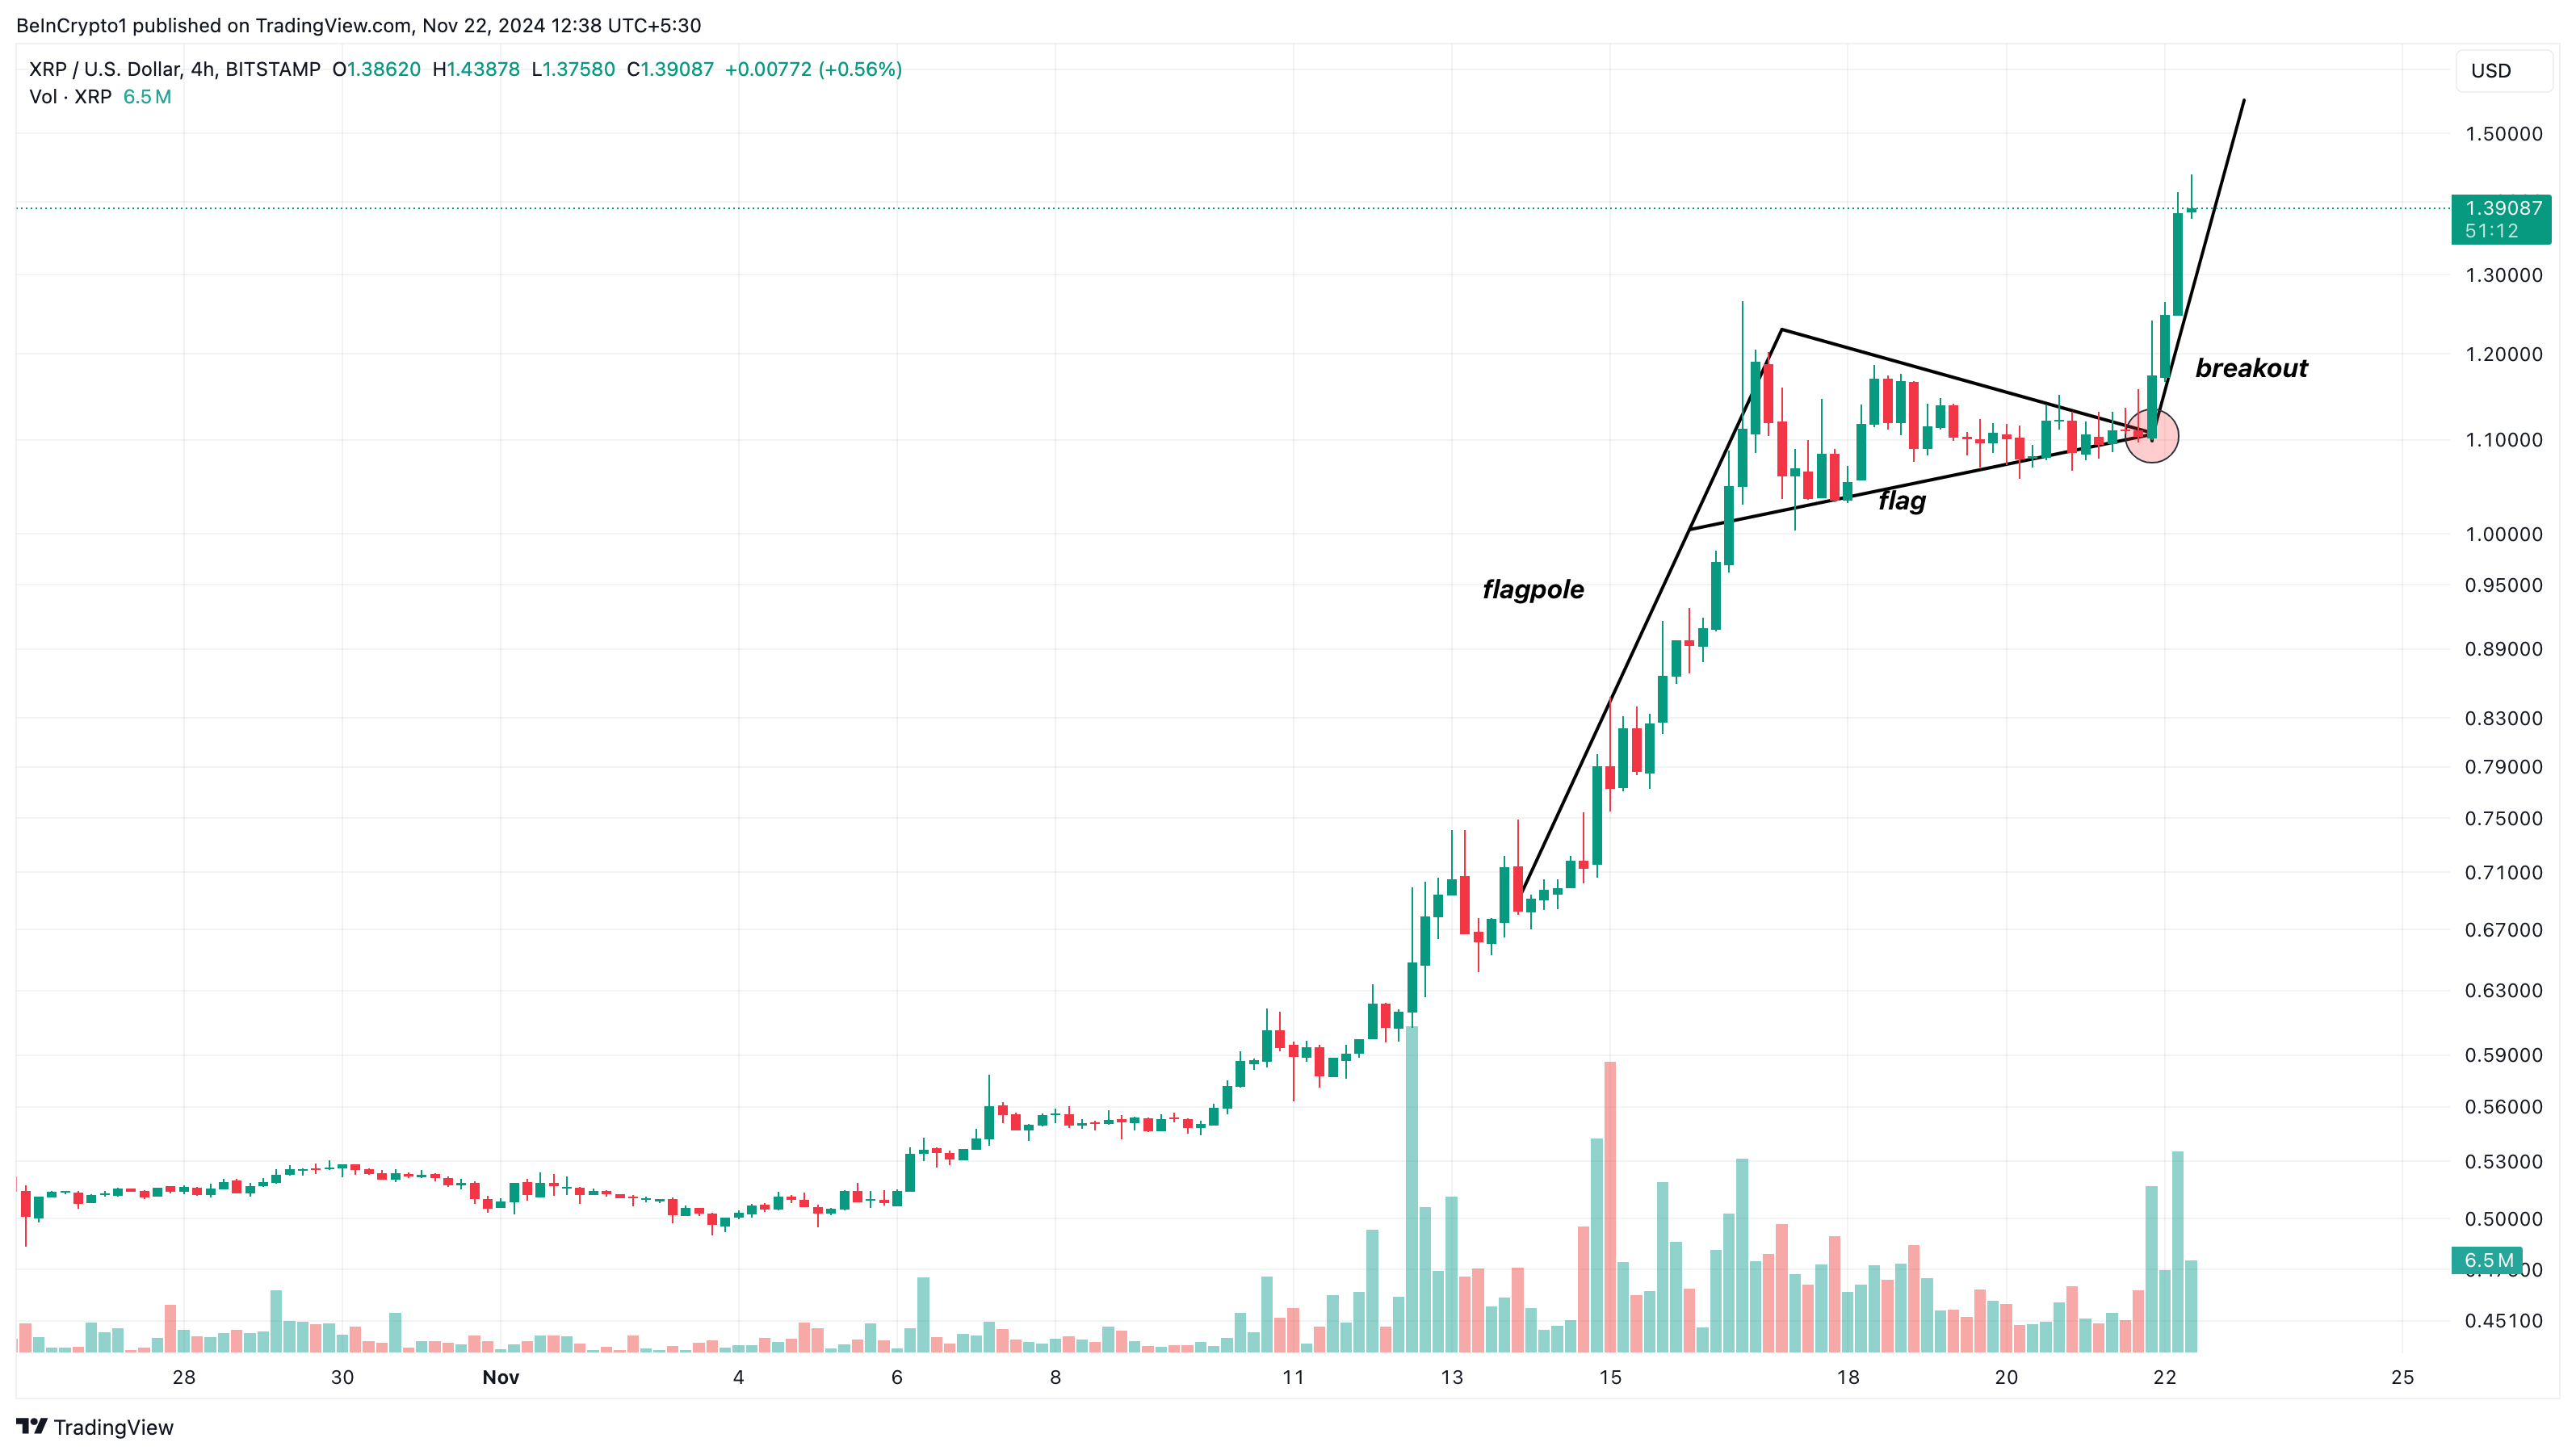
According to the 4-hour chart, XRP has been trading within a range of $1.04 to $1.17 since November 18. This sideways movement has resulted in the formation of a bull flag — a bullish chart pattern that signals potential upward momentum.
The bull flag begins with a sharp price surge, forming the flagpole, driven by significant buying pressure that outpaces sellers. This is followed by a consolidation phase, where the price retraces slightly and moves within parallel trendlines, creating the flag structure.
Yesterday, XRP broke out of this pattern, signaling that bulls have seized control of the market. If this momentum persists, XRP’s price could surpass $1.50, potentially approaching the $2 threshold.
However, this bullish scenario hinges on market behavior. If holders decide to secure profits, selling pressure could push XRP’s price below $1, erasing recent gains.
Disclaimer
In line with the Trust Project guidelines, this price analysis article is for informational purposes only and should not be considered financial or investment advice. BeInCrypto is committed to accurate, unbiased reporting, but market conditions are subject to change without notice. Always conduct your own research and consult with a professional before making any financial decisions. Please note that our Terms and Conditions, Privacy Policy, and Disclaimers have been updated.
Dogecoin is consolidating gains above the $0.380 resistance against the US Dollar. DOGE is holding gains and eyeing more upsides above $0.400.
- DOGE price started a fresh increase above the $0.3750 resistance level.
- The price is trading above the $0.3800 level and the 100-hourly simple moving average.
- There was a break above a short-term contracting triangle with resistance at $0.390 on the hourly chart of the DOGE/USD pair (data source from Kraken).
- The price could continue to rally if it clears the $0.400 and $0.4080 resistance levels.
Dogecoin Price Eyes More Upsides
Dogecoin price remained supported above the $0.350 level and recently started a fresh increase like Bitcoin and Ethereum. DOGE was able to clear the $0.3650 and $0.3750 resistance levels.
The price climbed above the 50% Fib retracement level of the downward move from the $0.4208 swing high to the $0.3652 low. Besides, there was a break above a short-term contracting triangle with resistance at $0.390 on the hourly chart of the DOGE/USD pair.
Dogecoin price is now trading above the $0.3750 level and the 100-hourly simple moving average. Immediate resistance on the upside is near the $0.3950 level or the 61.8% Fib retracement level of the downward move from the $0.4208 swing high to the $0.3652 low.

The first major resistance for the bulls could be near the $0.400 level. The next major resistance is near the $0.4080 level. A close above the $0.4080 resistance might send the price toward the $0.4200 resistance. Any more gains might send the price toward the $0.4500 level. The next major stop for the bulls might be $0.500.
Are Dips Supported In DOGE?
If DOGE’s price fails to climb above the $0.400 level, it could start a downside correction. Initial support on the downside is near the $0.3850 level. The next major support is near the $0.3750 level.
The main support sits at $0.3550. If there is a downside break below the $0.3550 support, the price could decline further. In the stated case, the price might decline toward the $0.3200 level or even $0.300 in the near term.
Technical Indicators
Hourly MACD – The MACD for DOGE/USD is now gaining momentum in the bullish zone.
Hourly RSI (Relative Strength Index) – The RSI for DOGE/USD is now above the 50 level.
Major Support Levels – $0.3850 and $0.3750.
Major Resistance Levels – $0.4000 and $0.4200.

Bitcoin Price Approaches $100K: The Countdown Is On
Top Neiro Ethereum Holder Dumps $3M NEIRO Sparking Price Dip Concerns

This Is Why XRP Price Rallied By 25% and Could Soon Hit $2

Hidden Bullish Divergence Appears On Dogecoin Price Chart, Here’s What To Expect Next

Dogecoin (DOGE) Shows Renewed Energy: Rally Incoming?

XRP Price Rally to $2 As Paul Atkins Leads to Replace US SEC Chair Gary Gensler

2.52 Million Altcoins Are Ruining Crypto’s Future

Animoca Brands Valuation Tanks 75% In Two Years, Here’s Why

Crypto exchange BingX hacked for $43 million

Are The Big Players Losing Interest?

Hong Kong’s Securities Association Tips Authorities On Crypto Self-Regulation

Coinbase cbBTC Set to go Live on Solana
2.52 Million Altcoins Are Ruining Crypto’s Future
Animoca Brands Valuation Tanks 75% In Two Years, Here’s Why
Crypto exchange BingX hacked for $43 million
Are The Big Players Losing Interest?
Hong Kong’s Securities Association Tips Authorities On Crypto Self-Regulation
Coinbase cbBTC Set to go Live on Solana
-

 Market23 hours ago
South Korea Unveils North Korea’s Role in Upbit Hack
-

 Bitcoin18 hours ago
Marathon Digital Raises $1B to Expand Bitcoin Holdings
-

 Regulation13 hours ago
UK to unveil crypto and stablecoin regulatory framework early next year
-
 Market18 hours ago
ETH/BTC Ratio Plummets to 42-Month Low Amid Bitcoin Surge
-
 Altcoin20 hours ago
Dogecoin Whale Accumulation Sparks Optimism, DOGE To Rally 9000% Ahead?
-
 Altcoin23 hours ago
Vitalik Buterin, Coinbase’s Jesse Pollack Buy Super Anon (ANON) Tokens On Base
-
 Altcoin18 hours ago
5 Key Indicators To Watch For Ethereum Price Rally To $10K
-

 Market17 hours ago
SEC Moves Toward Solana ETF Approval Amid Pro-Crypto Shift