
Ethereum
Ethereum Price Tied To BitMEX Whales: Quant Uncovers Link
A quant has pointed out how the trends in the BitMEX exchange reserve have affected the Ethereum price during the past few years.
BitMEX Ethereum Whales Have Shown Smart Money Behavior In Recent Years
In a CryptoQuant Quicktake post, an analyst discussed a pattern in the ETH exchange reserve of the BitMEX platform. The “exchange reserve” here refers to an on-chain metric that keeps track of the total amount of Ethereum that’s sitting in the wallets of any given centralized exchange.
When the value of this metric rises, investors will make net deposits to the platform right now. As one of the main reasons investors transfer to exchanges is for selling purposes, this trend can have potential bearish implications for the asset’s price.
On the other hand, a decline in the indicator suggests a net amount of the cryptocurrency’s supply is moving off the wallets associated with the exchange. Investors generally take their coins off into self-custody when they plan to hold for extended periods, so such a trend could be bullish for the coin.
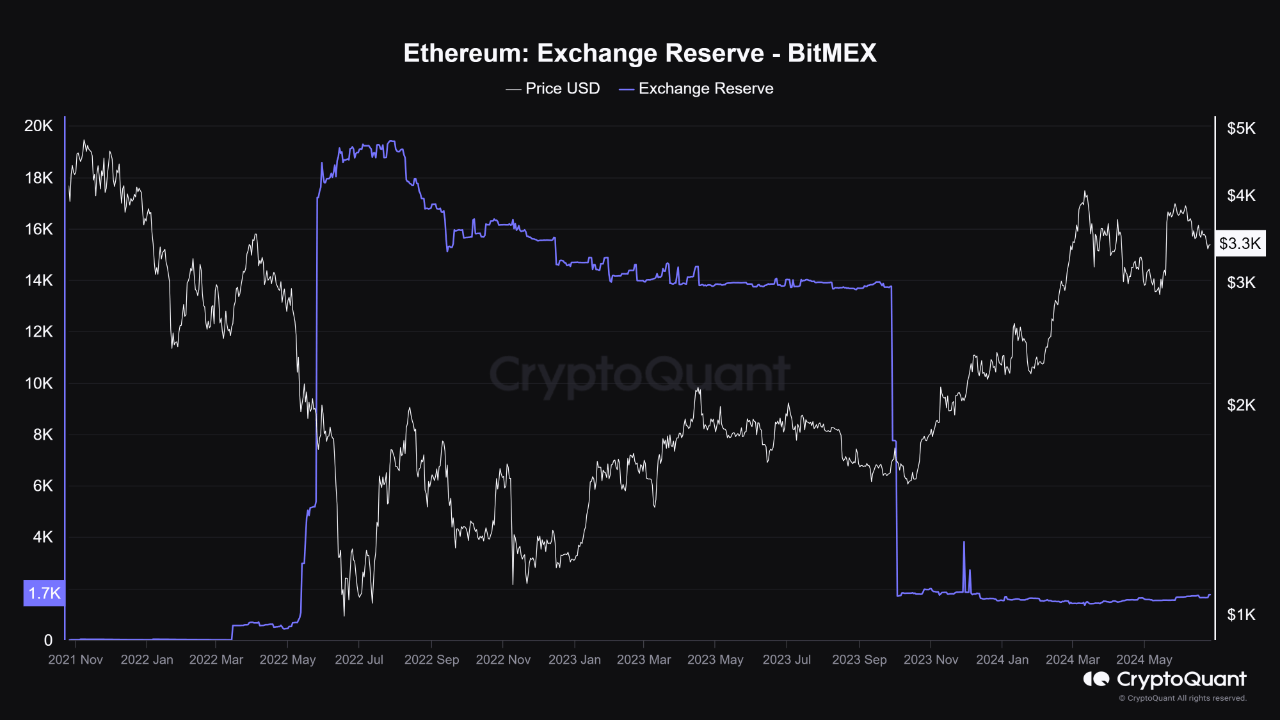
Now, here is a chart that shows the trend in the Ethereum exchange reserve for BitMEX over the last few years:

As is visible in the above graph, the Ethereum exchange reserve on the BitMEX platform observed a sharp increase back in mid-2022. This would suggest that the investors had made some hefty net deposits into the exchange.
According to the quant, the platform houses a significant number of whales, so this large inflow activity would reflect the behavior of these humongous investors.
Interestingly, the rapid growth in the indicator had come right before ETH had crashed towards its bear market lows. Thus, it would appear possible that these large holders had anticipated that things were about to get worse for the asset, so they had pulled the trigger on selling while they still had the chance.
Another notable shift in the exchange reserve of BitMEX occurred in September 2023, when the whales took out a huge amount of Ethereum, almost completely retracing the earlier bear market increase.
From the chart, it’s apparent that soon after these net outflows occurred, the cryptocurrency’s price started on a sharp rally that would eventually take it above the $4,000 level for the first time since December 2021.
It would appear that these smart money whales were again correct in their intuition about the market, as they could time their buys just in time for the rally.
Since these net outflows in September, the indicator hasn’t displayed any significant shifts, as its value has been moving sideways. Given the historical trend, any new deviations that crop up could be worth watching out for, as they could potentially spell another shift for Ethereum.
ETH Price
Ethereum showed a recovery push from its lows yesterday, but the run has calmed down as ETH is still trading around $3,400 today.


Meet Samuel Edyme, Nickname – HIM-buktu. A web3 content writer, journalist, and aspiring trader, Edyme is as versatile as they come. With a knack for words and a nose for trends, he has penned pieces for numerous industry player, including AMBCrypto, Blockchain.News, and Blockchain Reporter, among others.
Edyme’s foray into the crypto universe is nothing short of cinematic. His journey began not with a triumphant investment, but with a scam. Yes, a Ponzi scheme that used crypto as payment roped him in. Rather than retreating, he emerged wiser and more determined, channeling his experience into over three years of insightful market analysis.
Before becoming the voice of reason in the crypto space, Edyme was the quintessential crypto degen. He aped into anything that promised a quick buck, anything ape-able, learning the ropes the hard way. These hands-on experience through major market events—like the Terra Luna crash, the wave of bankruptcies in crypto firms, the notorious FTX collapse, and even CZ’s arrest—has honed his keen sense of market dynamics.
When he isn’t crafting engaging crypto content, you’ll find Edyme backtesting charts, studying both forex and synthetic indices. His dedication to mastering the art of trading is as relentless as his pursuit of the next big story. Away from his screens, he can be found in the gym, airpods in, working out and listening to his favorite artist, NF. Or maybe he’s catching some Z’s or scrolling through Elon Musk’s very own X platform—(oops, another screen activity, my bad…)
Well, being an introvert, Edyme thrives in the digital realm, preferring online interaction over offline encounters—(don’t judge, that’s just how he is built). His determination is quite unwavering to be honest, and he embodies the philosophy of continuous improvement, or “kaizen,” striving to be 1% better every day. His mantras, “God knows best” and “Everything is still on track,” reflect his resilient outlook and how he lives his life.
In a nutshell, Samuel Edyme was born efficient, driven by ambition, and perhaps a touch fierce. He’s neither artistic nor unrealistic, and certainly not chauvinistic. Think of him as Bruce Willis in a train wreck—unflappable. Edyme is like trading in your car for a jet—bold. He’s the guy who’d ask his boss for a pay cut just to prove a point—(uhhh…). He is like watching your kid take his first steps. Imagine Bill Gates struggling with rent—okay, maybe that’s a stretch, but you get the idea, yeah. Unbelievable? Yes. Inconceivable? Perhaps.
Edyme sees himself as a fairly reasonable guy, albeit a bit stubborn. Normal to you is not to him. He is not the one to take the easy road, and why would he? That’s just not the way he roll. He has these favorite lyrics from NF’s “Clouds” that resonate deeply with him: “What you think’s probably unfeasible, I’ve done already a hundredfold.”
PS—Edyme is HIM. HIM-buktu. Him-mulation. Him-Kardashian. Himon and Pumba. He even had his DNA tested, and guess what? He’s 100% Him-alayan. Screw it, he ate the opp.

The Ethereum price has been consolidating for about a week since it hit a four-month high at $3,420. As the second largest cryptocurrency, Ethereum has the biggest price correlation with Bitcoin. However, you could argue the Ethereum price has been largely left behind in terms of performance throughout the ongoing bull cycle. Interestingly, a crypto analyst, Ben Lilly, has shared a bold prediction about the trajectory of the Ethereum price.
Taking to a post on the social media platform X, Ben Lilly forecasted that the Ethereum price will reach a new all-time high (ATH) between December 21, 2024, and January 7, 2025. The prediction stems from his analysis of the previous performance of the ETH price movements during Bitcoin’s ATH discovery phase in 2021.
A Historical Parallel: Ethereum’s 2021 Rally
In his analysis, Ben Lilly referenced Ethereum’s price behavior during the historic rally of the Bitcoin price in the 2021 bull run. At the time, the Ethereum price was trading nearly 60% below its 2018 peak. After Bitcoin broke out to fresh ATH levels, it took Ethereum five weeks to follow suit, rallying by about 640% to reach its current ATH of $4,878.
Related Reading
Lilly believes the present market conditions mirror those of 2021, with the Bitcoin price recently entering price discovery mode. Ethereum, which was approximately 50% below its 2021 peak of $4,418 as of November 2024, has started to rebound, showing over 20% gains within just two weeks from a low of $2,366 on November 4.
Interestingly, the analyst’s comments suggest that as the Bitcoin price continues to set new price records this bull run, Ethereum is likely to follow with a substantial price leap very soon. The timeframe for this substantial price leap, he projects, aligns closely with late December 2024 and early January 2025.
Based on his projections, the analyst asserts that Ethereum could repeat its historical pattern and rally significantly within a short timeframe. He highlights that a 300% surge from Ethereum’s November 4 low price level could push it toward the $10,000 mark.
ETH will form a new ATH between Dec 21-Jan7.
I don’t make the rules. pic.twitter.com/NVgVdQ8Bsj
— Ben Lilly (@MrBenLilly) November 20, 2024
Current State Of The Ethereum Price
Ben Lilly’s Ethereum price prediction highlights the importance of the Bitcoin price momentum to that of the second-largest asset. Particularly, the 2021 pattern he pointed to is a result of an altcoin season where the altcoin market (led by Ethereum) started to outperform the Bitcoin price.
Related Reading
As it stands, an altcoin season has yet to materialize this cycle, and all the interest is going into Bitcoin. The Bitcoin price is currently on an all-time high roll, meaning the market will have to continue to wait for the interest to roll into Ethereum.
At the time of writing, the ETH price is trading at $3,107 and is down by 3.84% in the past seven days.
Featured image created with Dall.E, chart from Tradingview.com

Data shows the Ethereum derivatives-related metrics have shot up recently, a sign that the price is at risk of going through a volatile storm.
Ethereum Open Interest & Leverage Ratio Have Both Spiked Recently
In a CryptoQuant Quicktake post, an analyst has discussed about the trend in the derivatives indicators of Ethereum. The metrics in question are the Open Interest and the Estimated Leverage Ratio.
First, the Open Interest keeps track of the total amount of ETH-related contracts that are currently open on all derivatives platforms. The metric naturally takes into account for both long and short positions.
When the value of this metric rises, it means the investors are opening up fresh positions on the market. Such a trend suggests derivatives trading interest in the coin is going up.
On the other hand, the indicator registering a drawdown implies positions in the market are going down. This could be because of investors willfully closing them up, or due to exchanges forcibly liquidating them.
Now, here is a chart that shows the trend in the Ethereum Open Interest over the last few years:

The value of the metric appears to have been shooting up in recent days | Source: CryptoQuant
The above graph shows that the Ethereum Open Interest has witnessed rapid growth recently. It has surpassed the previous all-time high (ATH) to set a new record above $13 billion.
When considering the timeframe of the past four months, the indicator has increased by over 40%, which suggests an explosion in speculative interest around the cryptocurrency has occurred.
This development, however, may not be the healthiest, as the trend in the second indicator of relevance, the Estimated Leverage Ratio, would suggest. This metric measures the ratio between the Open Interest and the Derivatives Exchange Reserve.
The Derivatives Exchange Reserve is naturally just the total amount of the cryptocurrency sitting in wallets associated with all centralized derivatives exchanges.
The Estimated Leverage Ratio tells us the amount of leverage or loan that the average derivatives user in the Ethereum market is currently opting for.
Below is a chart for this indicator.

Looks like the value of the metric has been heading up over the last few weeks | Source: CryptoQuant
From the graph, it’s apparent that the Ethereum Estimated Leverage Ratio has shot up recently. This would mean that the increase in the Open Interest has been more rapid than the rise in the Derivatives Exchange Reserve.
The investors are now sitting on all-time high (ATH) leverage, which can be a bad sign for ETH as it implies any volatility in the future could take down the overleveraged positions and induce a mass liquidation event called a squeeze.
The quant has pointed out that the Ethereum Funding Rate, a ratio between long and short positions, is positive right now, which suggests that if a squeeze is to happen shortly, it’s more likely to involve the bullish side of the market.
ETH Price
At the time of writing, Ethereum is floating around $3,000, down almost 7% over the past week.
The price of the coin seems to have been consolidating sideways recently | Source: ETHUSDT on TradingView
Featured image from Dall-E, CryptoQuant.com, chart from TradingView.com

“Crypto Dad” Chris Giancarlo Emerges Top For White House Crypto Czar Role
Dogecoin Code Appears In CyberTruck And Model 3 Website, Will Tesla Accept DOGE Payments For Cars Soon?

GOAT Price Sees Slower Growth After Reaching $1B Market Cap

Ripple (XRP) Price Hits 109% Monthly Gain as Indicators Weaken

Ethereum Sees Neutral Netflow On Binance: What Does This Signal?
Trump Media Files Trademark for Crypto Platform TruthFi

2.52 Million Altcoins Are Ruining Crypto’s Future

Animoca Brands Valuation Tanks 75% In Two Years, Here’s Why

Crypto exchange BingX hacked for $43 million

Are The Big Players Losing Interest?

Hong Kong’s Securities Association Tips Authorities On Crypto Self-Regulation

Coinbase cbBTC Set to go Live on Solana
2.52 Million Altcoins Are Ruining Crypto’s Future
Animoca Brands Valuation Tanks 75% In Two Years, Here’s Why
Crypto exchange BingX hacked for $43 million
Are The Big Players Losing Interest?
Hong Kong’s Securities Association Tips Authorities On Crypto Self-Regulation
Coinbase cbBTC Set to go Live on Solana
-

 Market23 hours ago
This is Why MoonPay Shattered Solana Transaction Records
-

 Ethereum20 hours ago
Fundraising platform JustGiving accepts over 60 cryptocurrencies including Bitcoin, Ethereum
-

 Market24 hours ago
Steady Climb Toward New Highs
-
 Altcoin22 hours ago
BTC Reaches $97K, Altcoins Gains
-

 Market16 hours ago
South Korea Unveils North Korea’s Role in Upbit Hack
-

 Market20 hours ago
Cardano’s Hoskinson Wants Brian Armstrong for US Crypto-Czar
-

 Market19 hours ago
Litecoin (LTC) at a Crossroads: Can It Rebound and Rally?
-
 Altcoin13 hours ago
Dogecoin Whale Accumulation Sparks Optimism, DOGE To Rally 9000% Ahead?