
Bitcoin
Nubank Adds Bitcoin Lightning Network for Users’ Transactions
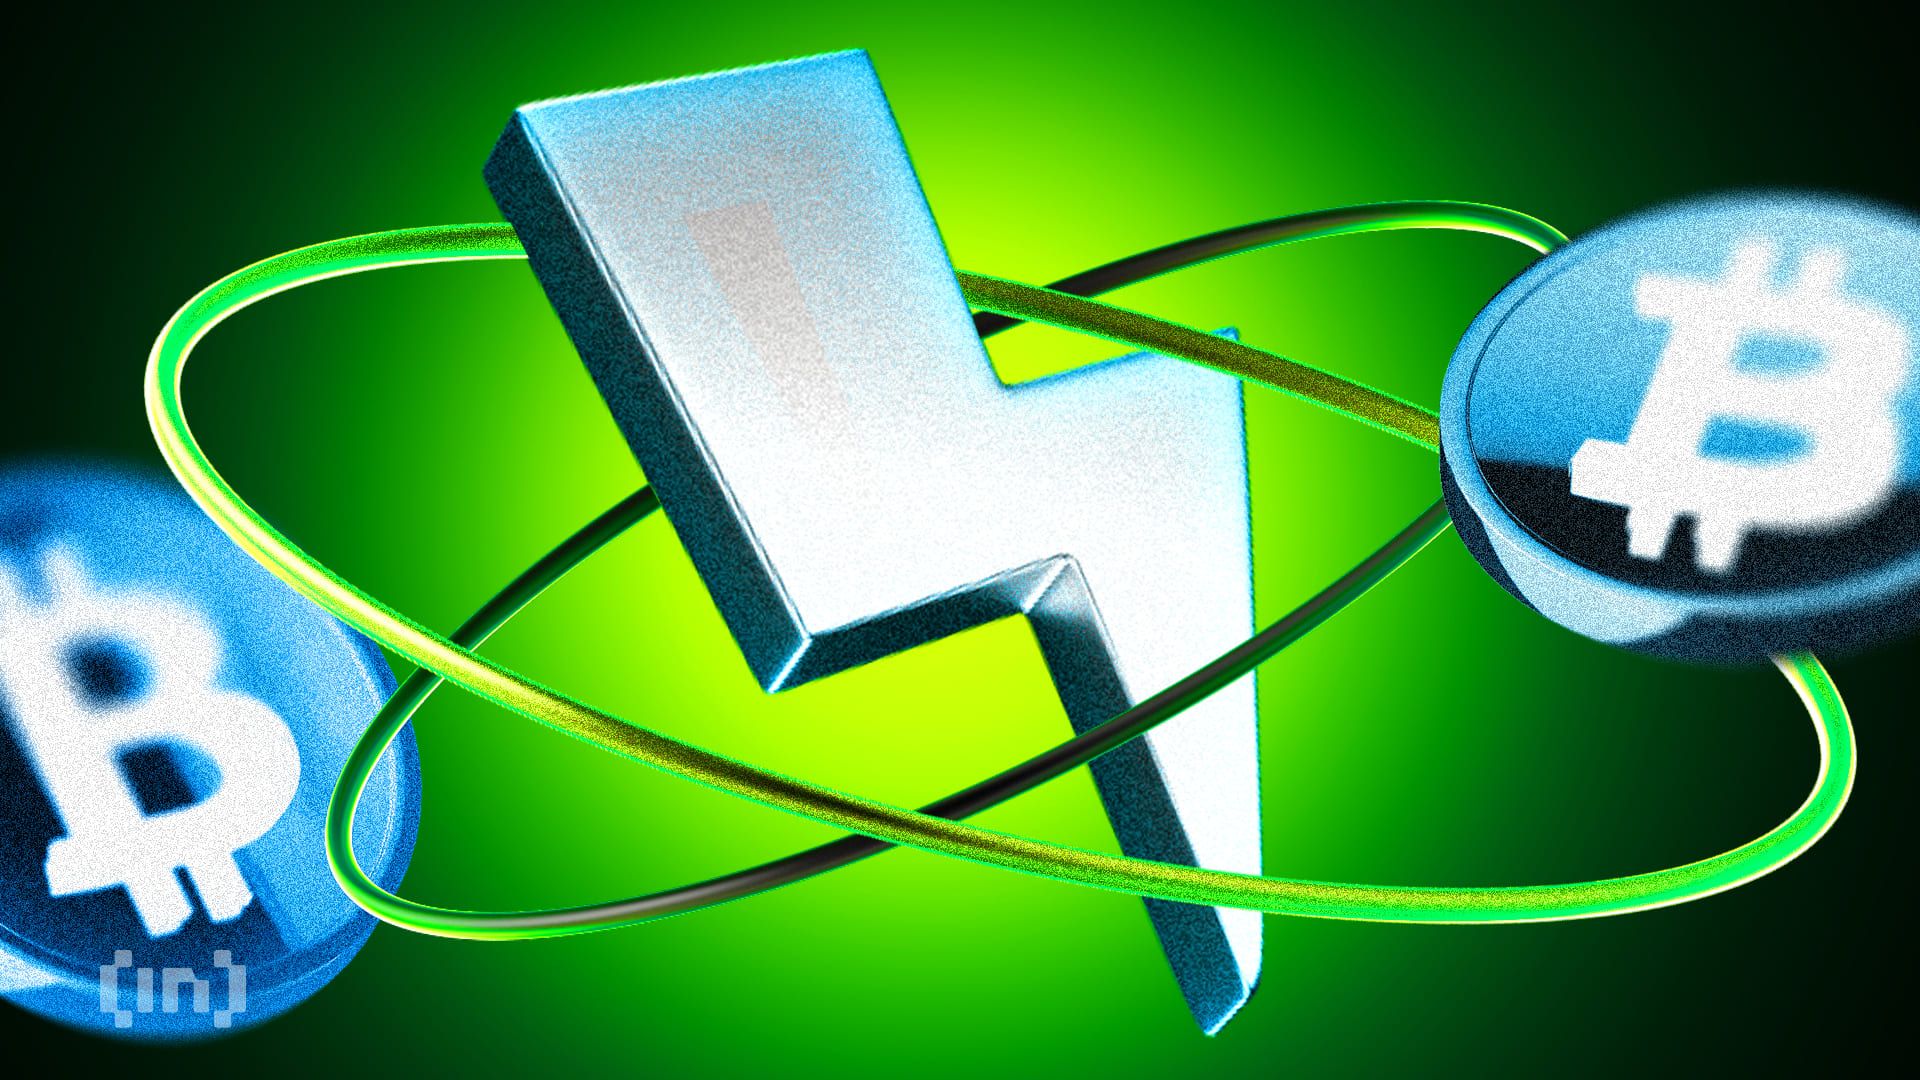
Nubank, a prominent Brazilian neobank, recently announced the integration of Bitcoin’s layer-2 (L2) Lightning Network.
This initiative aims to enhance transaction speed, reduce costs, and improve scalability for its users.
Nubank Partners with Lightspark to Enhance User Experience through Lightning Network
The move is part of a strategic partnership with Lightspark, a company renowned for its blockchain solutions. Integrating with Lightspark’s tools will optimize transaction success rates and liquidity requirements. This provides Nubank with powerful tools to enhance end-to-end transaction experiences via blockchain.
By incorporating the Lightning Network, Nubank enables its customers to conduct everyday payments, transfers, and international purchases with Bitcoin (BTC). This development aligns with Nubank’s continuous efforts to innovate and improve its digital banking services. Thomaz Fortes, Executive Director of Nubank Cripto, emphasized the institution’s focus on efficient customer solutions.
Read more: Beginner’s Tutorial to Start Using the Lightning Network
“The future integration of Lightning Network underscores Nu’s ongoing mission to offer more efficient services with greater speed and lower costs through blockchain technology,” Fortes added.
Echoing Fortes’ sentiment, David Marcus, CEO and co-founder of Lightspark, also expressed his excitement about their part in introducing Lightning Network to Nu’s 100 million customers.
“We’re delighted to enable Nubank to keep evolving their crypto solutions,” Marcus stated.
In addition to the Lightning Network, the partnership with Lightspark will introduce Universal Money Addresses (UMAs), which function like email addresses for sending money. This feature simplifies financial transactions for Nubank’s users. While specific product details remain undisclosed, Nubank promises further announcements in the near future.
Nubank’s latest crypto-related expansions align with the current market in Brazil. According to a report from research firm Kaiko, the Brazilian crypto market has experienced substantial growth this year.
Read more: The Best Bitcoin Lightning Network Wallets In 2024
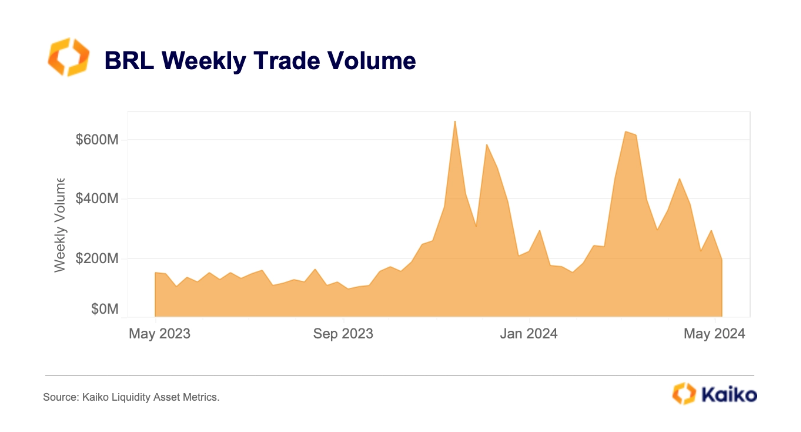
Brazilian real-denominated crypto trading volumes reached $6 billion from January to early May 2024. This growth positions Brazil as a leading player in the Latin American crypto market and highlights the increasing interest in stablecoins, Bitcoin, and other cryptocurrencies.
Disclaimer
In adherence to the Trust Project guidelines, BeInCrypto is committed to unbiased, transparent reporting. This news article aims to provide accurate, timely information. However, readers are advised to verify facts independently and consult with a professional before making any decisions based on this content. Please note that our Terms and Conditions, Privacy Policy, and Disclaimers have been updated.


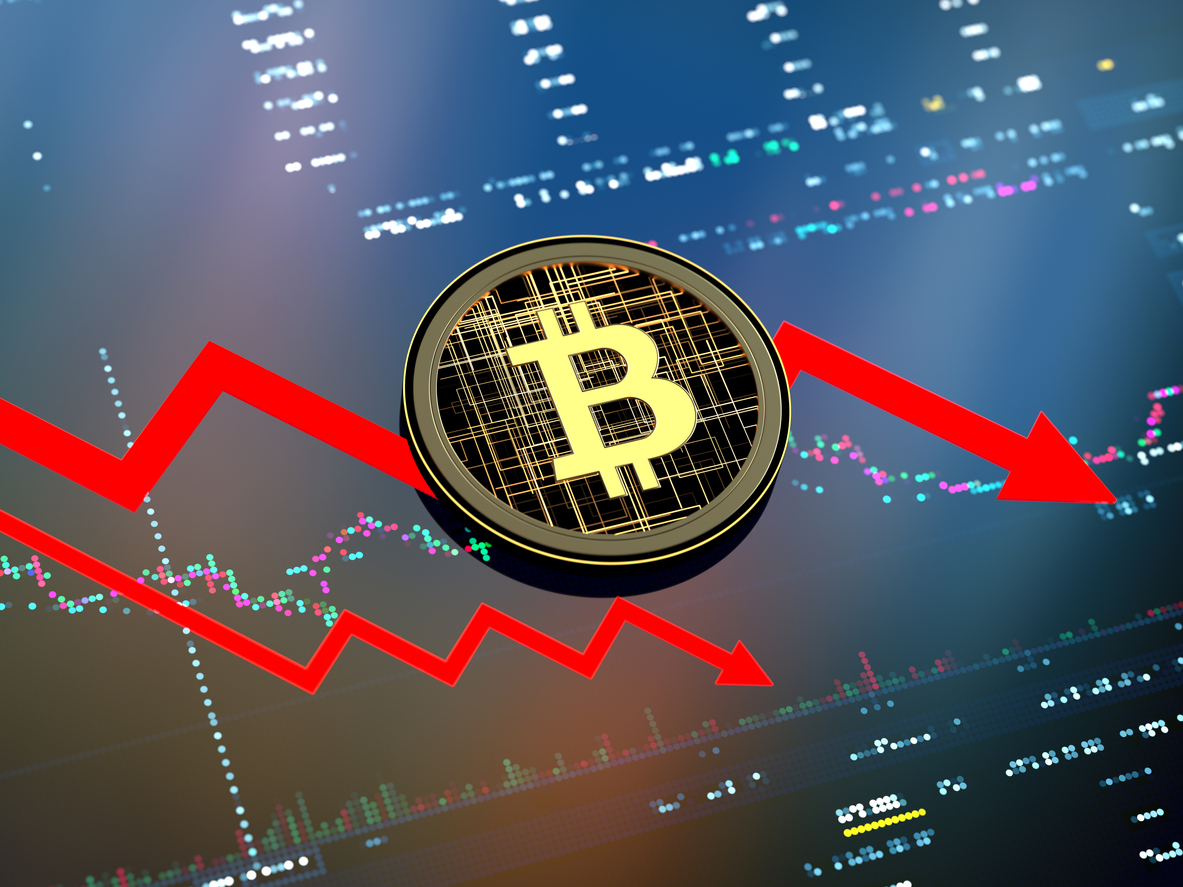
In the last two months, Bitcoin price has plunged by over 23% in a prolonged market correction. Significant portions of this decline have been attributed to a series of new US tariffs announced in February, March, and most recently April.
Despite the short-term bearish effects of this macroeconomic development on the crypto market, popular crypto analyst Miles Deutscher theorizes that BTC could substantially benefit from the long-term effects of these policy decisions.
Short-Term Chaos, Long-Term Clarity: Bitcoin Tipped For New ATH
In a recent X post, Deutscher states that Bitcoin is on course for a new all-time high despite current market uncertainty. The analyst explains that while recent trade and economic policy changes by the administration of US President Donald Trump may be exerting a negative market effect, the ensuing sequence of events from these decisions can prove bullish.
Firstly, Deutscher states that recent economic decisions by the US government show intentions to induce short-term pain that could weaken the dollar and interest rates which should be beneficial for Bitcoin and other crypto assets.
However, the new import tariffs are likely going to discourage the purchase of US Treasury Bills forcing a reliance on domestic buyers which triggers liquidity tightening. As Bitcoin is sensitive to liquidity, the contraction of global liquidity will cause further price falls as investors move their funds to safer assets.
Eventually, the crypto market is expected to bottom out pricing in recession fears. By the time an official recession is announced, the market could be stable and anticipate an economic response by the Federal Reserve.
At this junction, the US Apex Bank is likely to announce a rate cut clearing the way for quantitative easing (QE). However, while this QE may not occur until 2026, Bitcoin will experience a dollar liquidity boost from other economic tools including repurchase agreements, Bank Term Funding Program, and Treasury bill purchases.
Following this development, Bitcoin is expected to embark on an upward trajectory. The “top quality” altcoins will potentially follow the market leader while other tokens with little to no utility shrink. Once Bitcoin nears or hits a peak price, the altseason will kick in.
Deutscher explains it is currently difficult to predict the crypto market and US policies in the short term i.e. 1-12 weeks. However, his forecast is likely to roll out in the coming months placing Bitcoin in a strong position for a new all-time high between Q3 2025 and Q1 2026.
BTC Market Overview
At the time of writing, Bitcoin was trading at $83,313 following a 0.90% gain in the past week. However, the asset’s daily trading volume is down by 68.68% and is valued at $14.25 billion.
Featured image from The Conversation, chart from Tradingview
Editorial Process for bitcoinist is centered on delivering thoroughly researched, accurate, and unbiased content. We uphold strict sourcing standards, and each page undergoes diligent review by our team of top technology experts and seasoned editors. This process ensures the integrity, relevance, and value of our content for our readers.
The first quarter of 2025 was dominated by talks of the altcoin season, as is usually the case when the bull cycle is ending. In past cycles, capital tends to rotate from Bitcoin to other cryptocurrencies as investors look for maximum gain before the arrival of the bear market.
However, the story has been very different for the cryptocurrency market so far this year, with most large-cap assets failing to enjoy the same capital rotation seen in past cycles. The latest on-chain data shows that Bitcoin has continued to dominate the crypto market, outperforming all categories of altcoins.
Is It Time To Buy Altcoins?
In an April 5 post on the X platform, pseudonymous analyst Darkfost shared an interesting on-chain insight into the performance of all altcoin categories relative to the world’s largest cryptocurrency. According to the online pundit, the altcoins are underperforming compared to Bitcoin in terms of market capitalization growth.
In their post, Darkfost compared the market cap growth of Bitcoin, large-cap altcoins (the top 20 largest altcoins), and mid-to-small cap altcoins by calculating the difference between their 365-day and the 30-day moving average (MAs). According to the analyst, the variation between the 365-day MA and the 30-day MA serves as an indicator of growth momentum.
Typically, when the short-term moving average (30-day MA) rises faster than the long-term moving average (365-day MA), it implies rapid market cap growth. On the flip side, a reduced growth momentum is indicated by a lagging 30-day moving average.

Source: @Darkfost_Coc on X
As observed in the chart above, Bitcoin is outpacing the large-cap and mid-to-small-cap altcoins in terms of their market cap growth. Darkfost noted that this difference in the growth ratio has reached a level last seen in October 2023, a period correlated with a brief altcoin rally and subsequently BTC’s dominance.
The analyst further highlighted that when this growth ratio turns negative, it often signals that a strong correction has occurred. Historically, a negative ratio might present a potential buying opportunity for investors looking to get into the market.
Bitcoin And Ethereum Price Quick Look
As of this writing, the price of BTC stands at around $83,500, reflecting no significant movement in the past 24 hours. At the same time, the ETH token is valued at around $1,805, with no change in the past day.
While the premier cryptocurrency dropped by about 15% in the first quarter of 2025, Ethereum lost almost double its value in the same period. This gap in performance underscores how woeful the “king of altcoins” has been in the past few months.
The price of BTC on the daily timeframe | Source: BTCUSDT chart on TradingView
Featured image from iStock, chart from TradingView
Editorial Process for bitcoinist is centered on delivering thoroughly researched, accurate, and unbiased content. We uphold strict sourcing standards, and each page undergoes diligent review by our team of top technology experts and seasoned editors. This process ensures the integrity, relevance, and value of our content for our readers.
The price of Bitcoin has had an interesting performance so far in 2025, starting the year with a run to a new all-time high. However, the flagship cryptocurrency finished the year’s first quarter with over 15% of its value shaved off in those three months.
While the BTC price appears to be steadying within a consolidation range, the prognosis doesn’t look all positive for the world’s largest cryptocurrency. This explains why several short-term investors are getting frustrated and, as a result, exiting the market.
Is Bitcoin About To Go Up?
In a new post on the X platform, an on-chain analyst with the pseudonym Darkfost revealed that a certain class of Bitcoin holders have been selling their assets at a loss. According to the crypto pundit, the sell-offs are occurring at a rate not seen since the FTX collapse.
This on-chain observation is based on a significant drop in the Profit/Loss Margin, which tracks the profitability of investors by comparing their purchase price to the current price of a cryptocurrency. This metric offers insight into whether the market is in a state of unrealized profit or loss.
Specifically, Darkfost’s analysis focuses on Bitcoin investors who have been holding BTC for between one to three months (otherwise known as short-term holders). These traders are considered the most reactive class of holders, a trait highlighted by their recent activity.
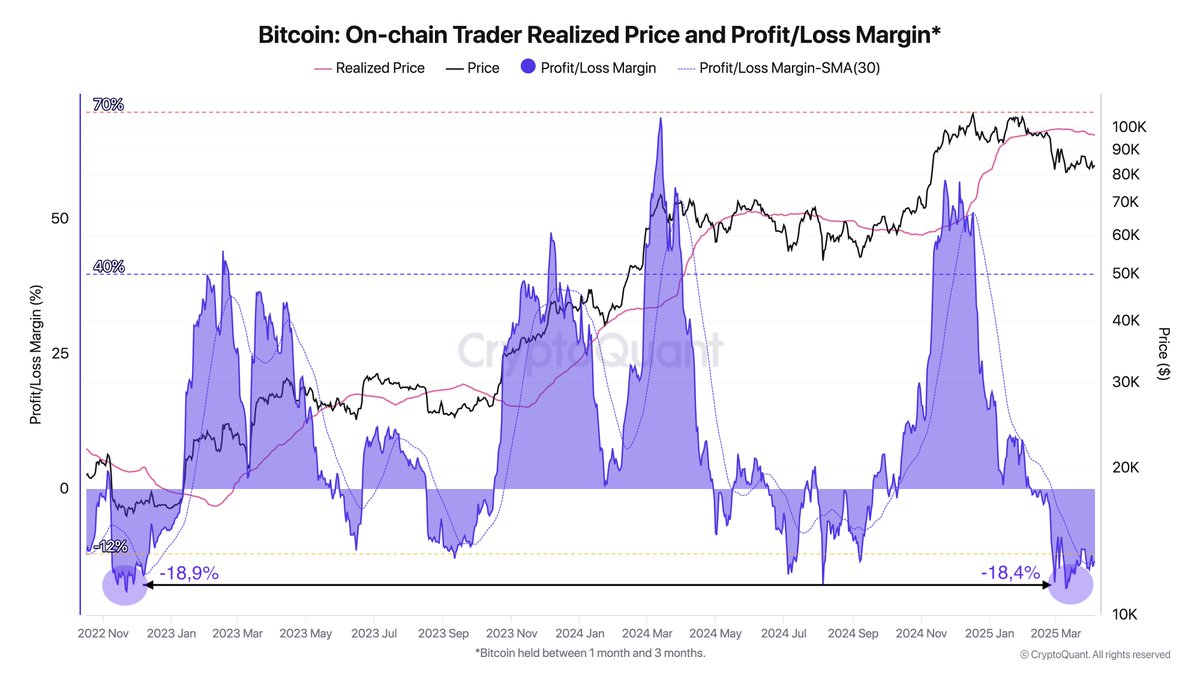
Source: @Darkfost_Coc on X
According to Darkfost, BTC short-term holders have been offloading their coins at a loss since early February. These realized losses have now reached levels last seen in the FTX crash and are even higher than the losses recorded during the 2024 price pullback.
Historically, significant loss realization by the Bitcoin short-term holders has preceded substantial upward price movements, especially when long-term holders continue to accumulate. Hence, the persistence of this trend means that long-term investors will take the coins off the weak hands before the next bullish jump.
BTC Price At A Glance
As of this writing, the price of BTC stands at around $83,700, reflecting no significant change in the past 24 hours. According to data from CoinGecko, the market leader is up by 1% in the last seven days.
The price of Bitcoin is thickening around the $84,000 level on the daily timeframe | Source: BTCUSDT chart on TradingView
Featured image from iStock, chart from TradingView
Editorial Process for bitcoinist is centered on delivering thoroughly researched, accurate, and unbiased content. We uphold strict sourcing standards, and each page undergoes diligent review by our team of top technology experts and seasoned editors. This process ensures the integrity, relevance, and value of our content for our readers.

Bitcoin Price Drops Below $80,000 Amid Heavy Weekend Selloff

Expert Reveals Decentralized Strategy To Stabilize Pi Network Price

Avalanche Price Holds Under $20, Low Selling Can’t Lift Price

Justin Sun Claims First Digital Trust Fraud Exceeds Impact of FTX

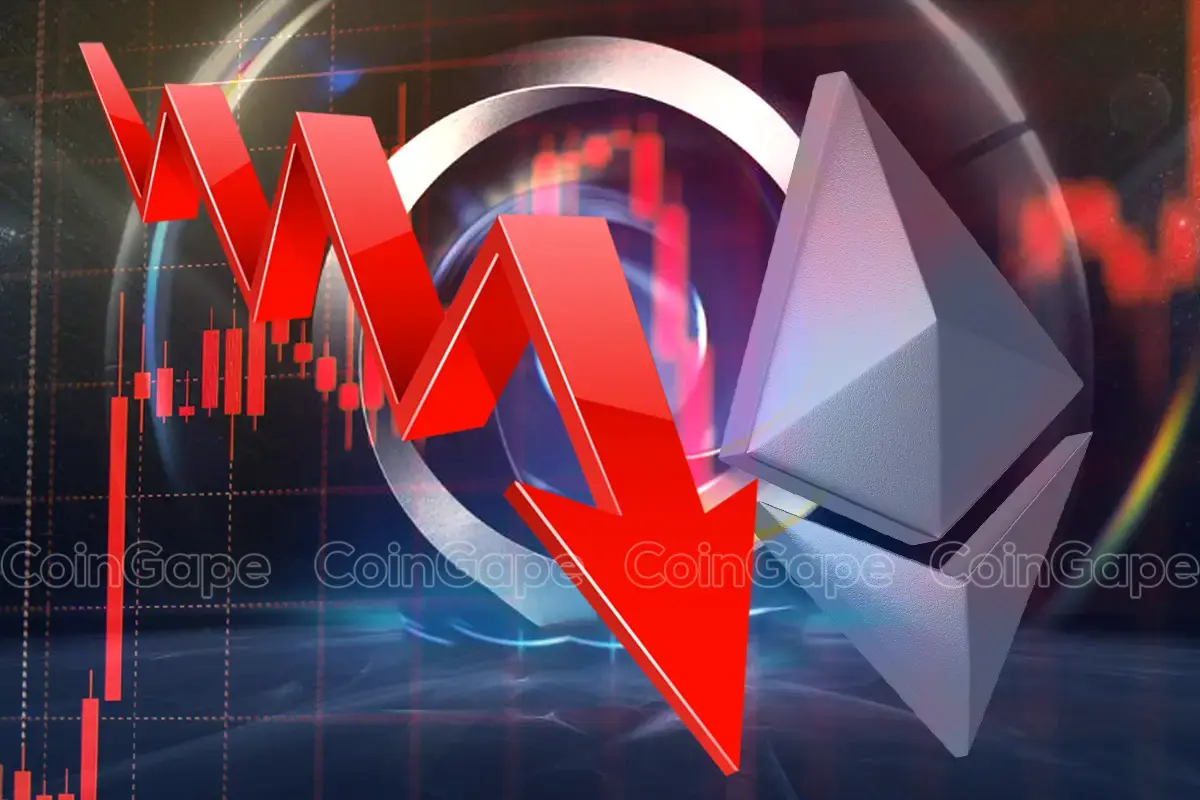
Ethereum Lags Behind Bitcoin In Q1 Performance Amid Market Downturn – Details

3 Token Unlocks for This Week: AXS, JTO, XAV


-

 Market24 hours ago
Solana Altcoin Saros Rallies 1000% Since March, Hits New High
-
 Altcoin21 hours ago
What’s Next for ADA Price?
-
 Bitcoin21 hours ago
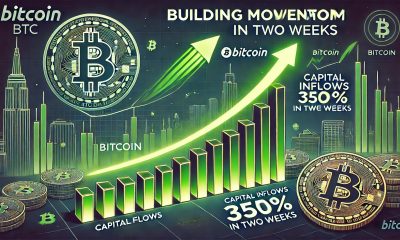
Bitcoin Indicator Signals Momentum Building – Capital Inflows Surge 350% In 2 Weeks
-
 Bitcoin19 hours ago
Bitcoin (BTC) To Take Off In June, Analyst Pins Market Target At $175,000
-

 Altcoin12 hours ago
Has The Dogecoin Price Bottomed Out? Analyst Points Out ‘Critical Decision Zone’
-

 Ethereum11 hours ago
Ethereum Whale Activity Fades Since Late February – Details
-

 Altcoin20 hours ago
XRP’s Open Interest Surges Above $3 Billion, Will Price Follow?
-
 Altcoin19 hours ago
Ethereum Price Threatens Decline To $1600 After Breakdown From Symmetrical Triangle
 Arabic
 Chinese (Simplified)
 Dutch
Dutch English
 French
 German
 Italian
 Portuguese
 Russian
 Spanish
 Vietnamese