
Ethereum
Will Ethereum Skyrocket? Analyst Predicts $6,000 By September
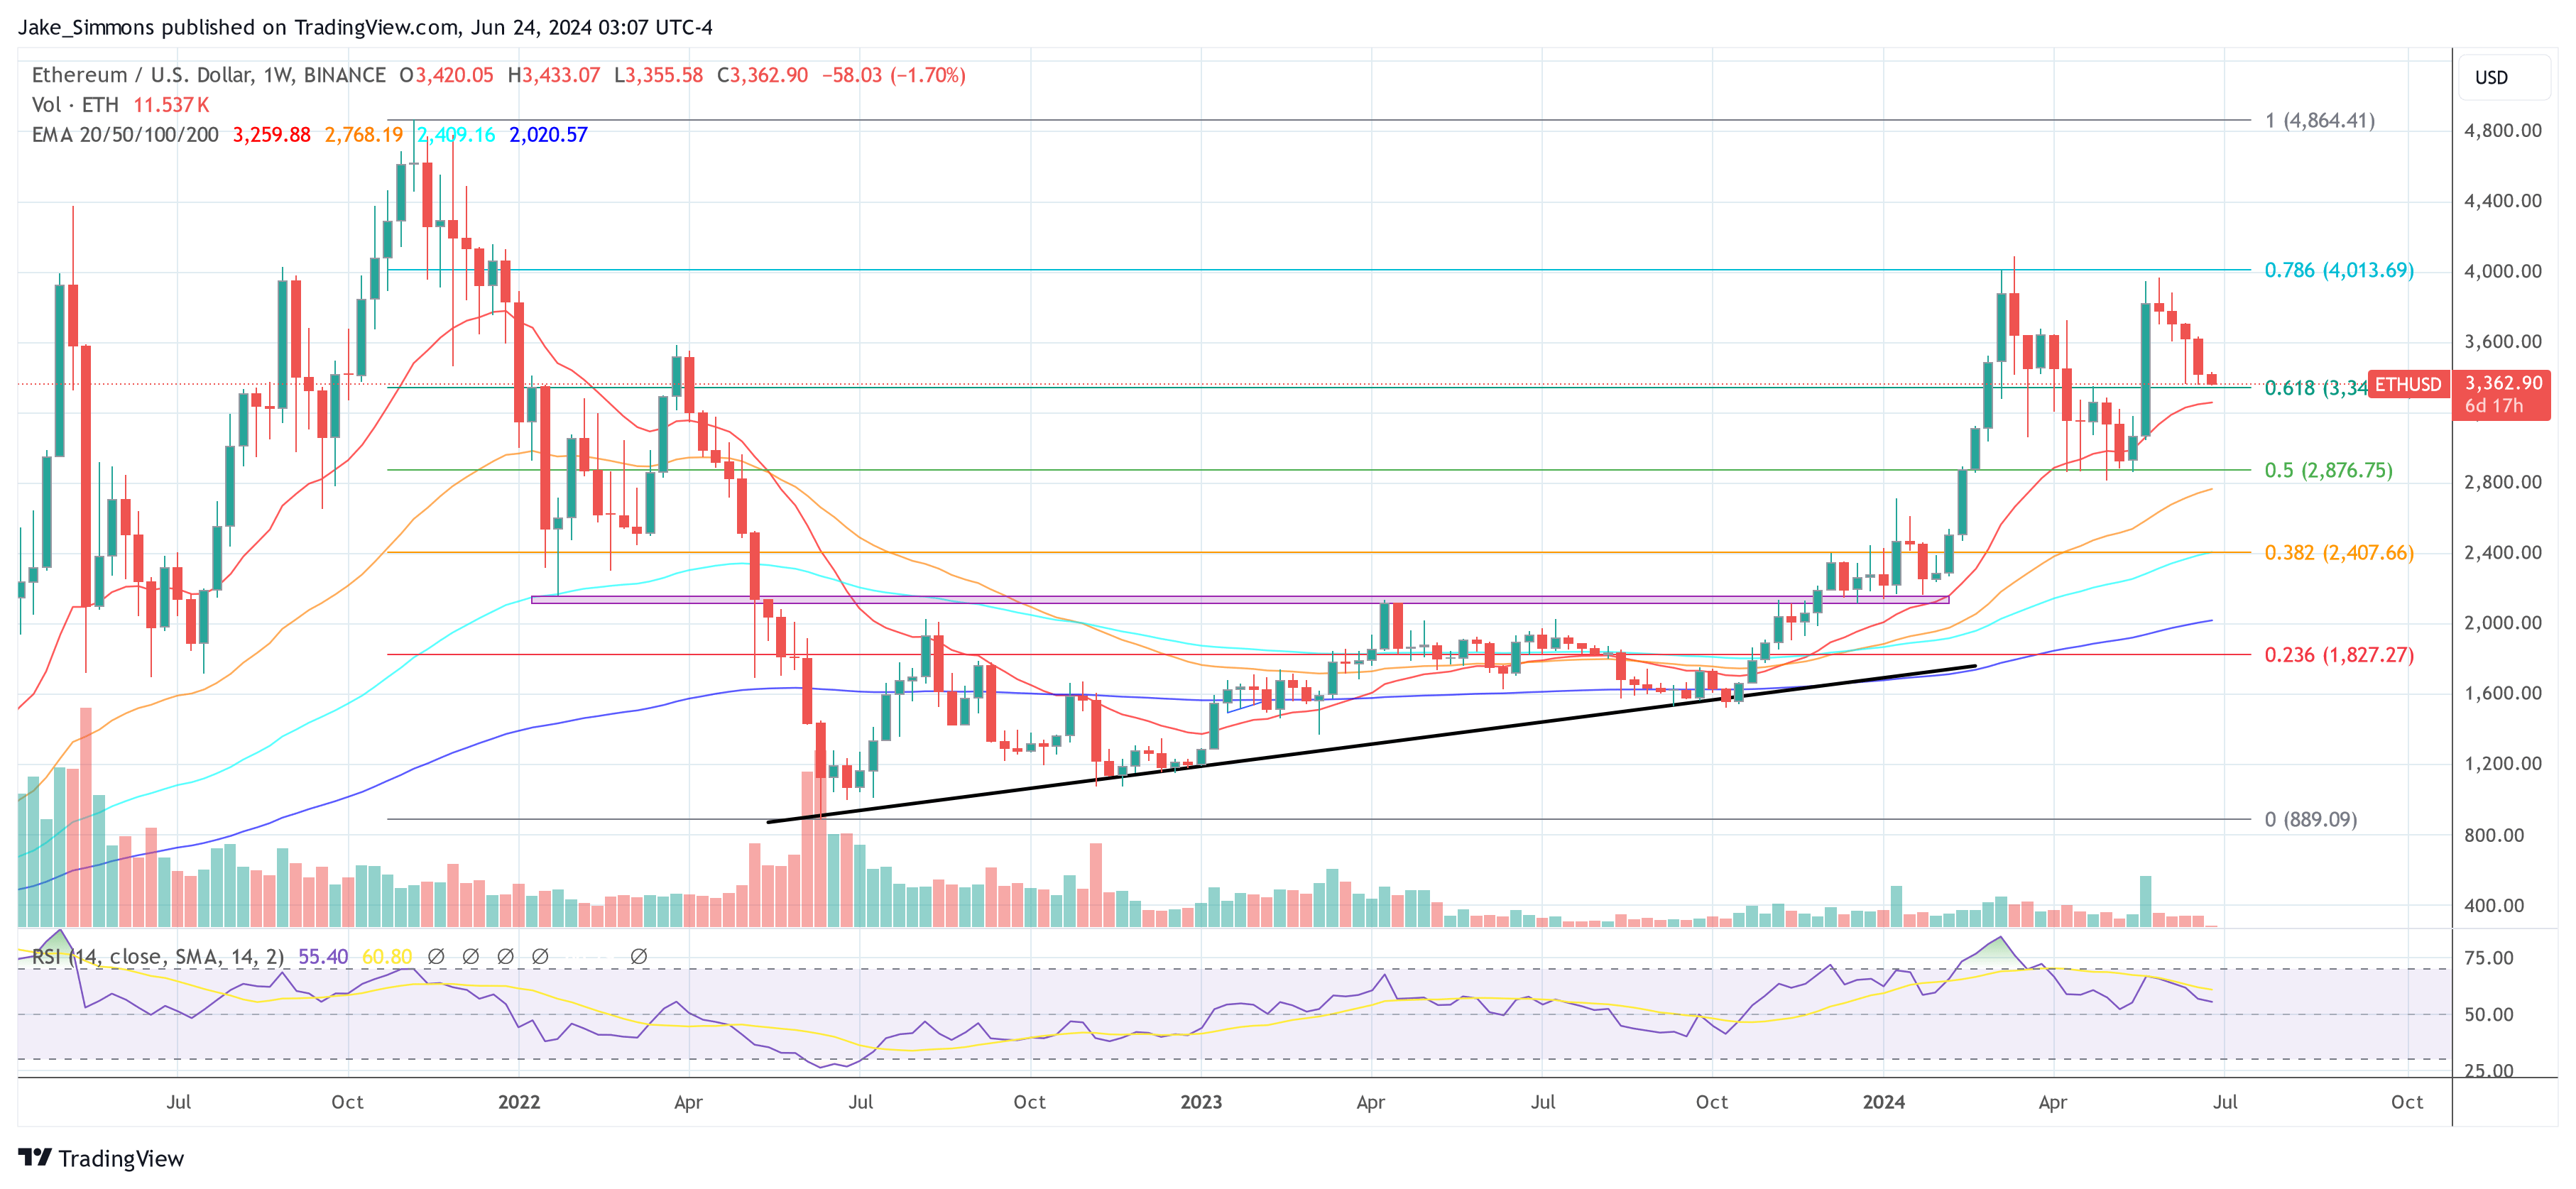
Popular crypto analyst degentrading (@degentradingLSD) has made a bold prediction that Ethereum will reach $6,000 by September 2024. This prediction comes in response to an analysis by Mechanism Capital founder Andrew Kang, who expects Ethereum to underperform despite the imminent launch of US spot Ethereum ETFs.
Andrew Kang’s analysis projects a continued downtrend for ETHBTC, with the ratio expected to range between 0.035 and 0.06 over the next year. In his detailed thread on X, Kang expressed skepticism about Ethereum’s potential, despite the ETF launch being just days away.
Why Ethereum Could Reach $6,000 By September
Degentrading, however, presented a counter-argument in a thread on X. Degentrading begins by examining the change in CME open interest (OI) from pre-ETF days to the present, noting a substantial increase of approximately $5 billion.
He explains, “Pre-ETF, it was very onerous to perform cash and carry on CME due to margin requirements. Hence, the upper bound of basis trades is probably capped at that amount.” This insight suggests that the advent of the ETF could significantly ease trading constraints, potentially unlocking a large influx of capital.
However, he tempers this by discussing the challenges posed by the extinction of prime brokers like Genesis, which complicates spot borrowing as a hedge against CME futures longs. According to degentrading, “Unless market makers can frequently charge a bid/ask spread, they are effectively locking in a loss. Therefore, the sheer amount of CME basis trades has to be a minority. I would peg the figure at $1-2 billion max.” This leaves an estimated $7 billion in potential inflows, a figure he describes as “highly dependent on assumptions.”
Related Reading
Degentrading contrasts Ethereum’s position with that of Bitcoin, criticizing sentiments from analysts like Eric Balchunas. “Nothing in traditional finance is as exciting as tech. Bitcoin has the branding of digital gold or millennial gold. Gold’s market cap is approximately $15 trillion,” he notes. In contrast, Ethereum is seen as a decentralized global settlement layer or world computer, with the US stock market already valued at $50 trillion. This, he argues, sets a much higher ceiling for Ethereum.
He further explains that in his discussions with traditional finance (tradfi) professionals, there is more enthusiasm for ETH and even SOL compared to BTC. “People are much more excited about ETH or SOL for that matter. Hence, I would peg the inflow conversion rate at half of Bitcoin’s, which translates to about $3-4 billion into ETH,” degentrading asserts.
One of the key points in degentrading’s argument is Ethereum’s relative illiquidity compared to Bitcoin. He highlights that while Ethereum is roughly one-third the size of Bitcoin, its liquidity is only about 10% of BTC. “This means that an influx of $3-4 billion will materially move ETH,” he emphasizes. This illiquidity could lead to significant price movements with relatively smaller capital inflows.
Addressing the market’s current positioning, degentrading points out the overall bleak sentiment on Crypto Twitter (CT), viewing it as the best technical setup for Ethereum. He notes, “On the cusp of the ETH ETF launch, you have people setting expectations for $500 million of inflows over six months. This is the BEST technical setup for ETH.”
Related Reading
An important factor in degentrading’s analysis is the anticipated conversion of Grayscale’s Ethereum Trust (ETHE) into an ETF. He suggests that ETHE will likely face much less selling pressure compared to the Grayscale Bitcoin Trust (GBTC) due to a lesser lender overhang. “ETHE will also likely face MUCH LESS selling pressure than GBTC because of the much lesser lender overhang,” he notes.
Impact Of Cash And Carry Trades
Andrew Kang responded to degentrading’s analysis, highlighting the involvement of large funds like Millennium, which owns $2 billion of the ETF. Kang points out that such funds engage in basis trades and are not long-only investment funds. “Millennium by itself owns $2 billion of the ETF. They are not a long-only investment fund. They do these types of basis trades. That’s only one fund from an old filing,” Kang stated.
Degentrading acknowledged this but emphasized the cost implications of holding a cash and carry position. He argued that the cost of holding such positions nets out significant amounts, which impacts the market maker’s profitability. “On that thought, the cost of holding a cash and carry would net out $300 million to Millennium and cost the market maker that amount, implying that the delta is borne by a naked delta on the futures,” degentrading retorted.
At press time, ETH traded at $3,362.90.
Featured image created with DALL·E, chart from TradingView.com


Reason to trust
![]()
Strict editorial policy that focuses on accuracy, relevance, and impartiality
Created by industry experts and meticulously reviewed
The highest standards in reporting and publishing
Strict editorial policy that focuses on accuracy, relevance, and impartiality
Morbi pretium leo et nisl aliquam mollis. Quisque arcu lorem, ultricies quis pellentesque nec, ullamcorper eu odio.
As Ethereum (ETH) continues to experience a significant price downturn, recording a 17% drop over the past month, key resistance levels have emerged as critical points for the second-largest cryptocurrency. Analysts suggest that these levels could ignite a potential trend reversal if reclaimed.
Ethereum Faces Potential Decline To $1,155
In a recent update shared on social media platform X (formerly Twitter), crypto analyst Ali Martinez highlighted two pivotal price points for Ethereum’s immediate future.
The first, set at $2,100, is seen as a necessary threshold for initiating a new upward trend. However, the $2,300 mark is regarded as a “more decisive” level that Ethereum must breach to confirm a bullish reversal.
Related Reading
Martinez’s analysis, based on the one-day chart seen below, indicates that if Ethereum fails to reclaim these levels, it may lead to a further decline.

The next target points to watch would be $1,600 and $1,155, levels that could indicate a new downtrend. Such a decline would represent additional losses of 12% and over 37%, respectively, marking a troubling continuation of Ethereum’s worst first quarter in its history.
In another post, the analyst also pointed out that the Ethereum price is facing a significant resistance wall between $2,200 and $2,580. On-chain data from the analytics firm IntoTheBlock reveals that approximately 12.43 million investors have bought about 66.18 million ETH within this price range.
A breakout above these levels could potentially generate bullish momentum for the cryptocurrency. However, bullish catalysts that could trigger a move above these levels remain scarce among experts.
ETH’s Largest Accumulation Zone Under Threat
Market intelligence firm Glassnode has indicated that ETH’s Cost Basis Distribution shows limited support near current prices. Weekly data suggests that addresses with a cost basis around $1,800 have not re-engaged. Many investors are reportedly selling at a loss, further adding to the current price uncertainty.
On March 28, several clusters of approximately 250,000 ETH with cost bases between $2,000 and $2,050 effectively vanished, indicating that some higher-cost holders are attempting to average down their positions.
However, Glassnode asserts that the overall Ethereum accumulation zone appears limited at current price levels, raising questions about future stabilization for the second largest cryptocurrency.
Related Reading
The largest accumulation zone below the current market price now sits at $1,537, where nearly 994,000 ETH was acquired. If the downtrend continues, this level is expected to serve as structural support in the near term, potentially providing a buffer against further declines.
ETH is currently trading at $1,830, down 12% for the week.
Featured image from DALL-E, chart from TradingView.com


A quant has revealed how Ethereum (ETH) saw a death cross in this indicator shortly before bearish momentum took the asset in full force.
Ethereum Formed A Death Cross In Funding Rates Earlier
In a CryptoQuant Quicktake post, an analyst has shared a chart for the Funding Rates of Ethereum. The “Funding Rates” refers to a metric that keeps track of the amount of periodic fee that traders on the derivatives market are exchanging between each other right now.
When the value of this indicator is positive, it means the long contract holders are paying a premium to the short investors in order to hold onto their positions. Such a trend suggests a bullish sentiment is shared by the majority of the derivatives traders.
On the other hand, the metric being under the zero mark implies a bearish mentality is dominant in the sector, as short holders are overwhelming the long ones.
Now, here is the chart for the Ethereum Funding Rates posted by the quant, which shows the trend in the 50-day and 200-day simple moving averages (SMAs) of the indicator over the last couple of years:

Looks like these two lines saw a crossover earlier in the year | Source: CryptoQuant
As displayed in the above graph, the 50-day SMA of the Ethereum Funding Rates crossed under the 200-day SMA in January of this year. This suggests that the optimism in the market witnessed a shift.
From the graph, it’s visible that since the crossover in the two SMAs of the indicator has emerged, the ETH price has been sharply moving down. The trend isn’t unique to the asset, as the wider cryptocurrency sector has also seen a similar pattern, with investors becoming risk-averse.
In the first half of last year, the Funding Rates observed the same type of crossover, and then, the Ethereum price followed up with a period of bearish action.
It wasn’t until the reverse crossover happened, with the 50-day SMA finding a break above the 200-day SMA, that bullish momentum returned in the cryptocurrency market. The same pattern was also seen back in 2023.
It’s possible that for constructive price action to return for Ethereum and other assets, a bullish crossover in the Funding Rates may once again have to take place. “When the speculators return and start using their greedy leverage, the crypto bull market will begin,” notes the analyst.
When this would happen, however, is anyone’s guess, as the 50-day and 200-day SMAs of the indicator are currently quite far apart. In 2024, the lines took many months before they crossed back, so it’s possible that it will take some time for the crossover to occur now as well.
ETH Price
Ethereum is moving to end the month of March on a red note as its price has fallen to the $1,800 level, after seeing a decline of almost 14% in the past week.
The trend in the ETH price over the last five days | Source: ETHUSDT on TradingView
Featured image from Dall-E, CryptoQuant.com, chart from TradingView.com
Editorial Process for bitcoinist is centered on delivering thoroughly researched, accurate, and unbiased content. We uphold strict sourcing standards, and each page undergoes diligent review by our team of top technology experts and seasoned editors. This process ensures the integrity, relevance, and value of our content for our readers.

Comparing current price action with past performances, Ethereum, the second-largest crypto asset, seems to have witnessed its worst-ever first quarter as it draws closer to its end. However, many investors are expressing interest in ETH’s prospects again, purchasing the asset in huge chunks.
Investors Buying The Ethereum’s Price Dip
Ethereum has continued to struggle to undergo a major upward move even as other digital assets make history in the ongoing market cycle. Despite the recent pullback in ETH’s price, Ali Martinez, a seasoned crypto analyst and trader, has highlighted a renewed bullish sentiment among investors.
Specifically, investors are seizing the opportunity to stack up on ETH in light of ongoing price correction, signaling interest and confidence in the asset’s long-term potential. This buying activity suggests that seasoned traders are considering the current drop as a strategic entry or buying point.
According to Ali Martinez, the development was spotted as Ethereum encountered a significant resistance wall between the $2,200 and $2,580 price mark. Examining the data from IntoTheBlock, the expert reported that over 12.43 million investors purchased a massive portion of 66.18 million ETH within the $2,200 and $2,580 price zones.
These kinds of accumulation show that both retail and institutional investors are hopeful about the market. Should this substantial buying activity extend, Ali Martinez is confident that bullish momentum might build up for ETH, leading to a break above the zone.

Market analyst and trader CryptoELITES predicts a robust upswing for ETH to new all-time highs in the upcoming weeks. CryptoELITES prediction is based on past price trends in which ETH witnessed a massive rally after a lengthy period of downward movements.
Delving into the recent price action, the expert believes ETH’s correction has reached a bottom similar to the 2017 and 2021 bull market cycles. With the altcoin potentially reaching a bottom, CryptoELITES anticipates an over 700% upsurge in 2025.
A 700% surge will bring the altcoin’s price to the $15,000 milestone before the ongoing bull market cycle completes. Given that Ethereum is mirroring past trends, a possible price reversal could be on the horizon.
ETH Eyeing A Breakout From Key Chart Pattern
While ETH is facing volatility, it is presently at a critical junction that might determine its next move. Jonathan Carter, a crypto and technical analyst, reveals that Ethereum is holding above the lower boundary of a Descending Triangle formation after navigating its price in the 4-hour time frame.
At this zone, the asset might muster enough momentum for a rebound. Carter expects a bounce from the current support zone to push ETH toward key resistance levels at $1,950, $2,080, $2,230, and $2,320. However, if the altcoin falls below the support, the price may drop further to the downside.
Featured image from Pexels, chart from Tradingview.com
Editorial Process for bitcoinist is centered on delivering thoroughly researched, accurate, and unbiased content. We uphold strict sourcing standards, and each page undergoes diligent review by our team of top technology experts and seasoned editors. This process ensures the integrity, relevance, and value of our content for our readers.
Is CZ’s April Fool’s Joke a Crypto Reality or Just Fun?

XRP Bulls Fight Back—Is a Major Move Coming?

A Make or Break Situation As Ripple Crypto Flirts Around $2

CFTC’s Crypto Market Overhaul Under New Chair Brian Quintenz

$2,300 Emerges As The Most Crucial Resistance

Solana (SOL) Holds Steady After Decline—Breakout or More Downside?

2.52 Million Altcoins Are Ruining Crypto’s Future

Animoca Brands Valuation Tanks 75% In Two Years, Here’s Why

Crypto exchange BingX hacked for $43 million

Are The Big Players Losing Interest?

Hong Kong’s Securities Association Tips Authorities On Crypto Self-Regulation

Coinbase cbBTC Set to go Live on Solana
2.52 Million Altcoins Are Ruining Crypto’s Future
Animoca Brands Valuation Tanks 75% In Two Years, Here’s Why
Crypto exchange BingX hacked for $43 million
Are The Big Players Losing Interest?
Hong Kong’s Securities Association Tips Authorities On Crypto Self-Regulation
Coinbase cbBTC Set to go Live on Solana
-

 Bitcoin23 hours ago
US Macroeconomic Indicators This Week: NFP, JOLTS, & More
-

 Market23 hours ago
Don’t Fall for These Common Crypto Scams
-
 Bitcoin16 hours ago
Strategy Adds 22,048 BTC for Nearly $2 Billion
-
 Market21 hours ago
Strategic Move for Trump Family in Crypto
-

 Market16 hours ago
BNB Breaks Below $605 As Bullish Momentum Fades – What’s Next?
-

 Market20 hours ago
Top Crypto Airdrops to Watch in the First Week of April
-
 Market15 hours ago
Trump Family Gets Most WLFI Revenue, Causing Corruption Fears
-
 Altcoin20 hours ago
$33 Million Inflows Signal Market Bounce