
Market
Optimism (OP) Falls Below $2.05, Signaling Bearish Trend

Optimism (OP) saw a bearish trend of -35% in June, sparking growing fear in the market and hesitation among investors.
This analysis will guide you in understanding and monitoring key indicators from both the technical and fundamental analysis of Optimism.
Technical Analysis of Optimism
Optimism is currently showing a bearish trend on the 4-hour chart. The 100-period Exponential Moving Average (EMA), represented by the blue line, acts as a dynamic resistance level, and the price is currently below this line, indicating ongoing bearish momentum.
The 200-period EMA, represented by the green line, also has a significant resistance level, and the price is well below it, further reinforcing the bearish sentiment. Additionally, the Relative Strength Index (RSI) is below 40, which suggests that selling pressure remains dominant.
Read More: Optimism vs. Arbitrum: Ethereum Layer-2 Rollups Compared
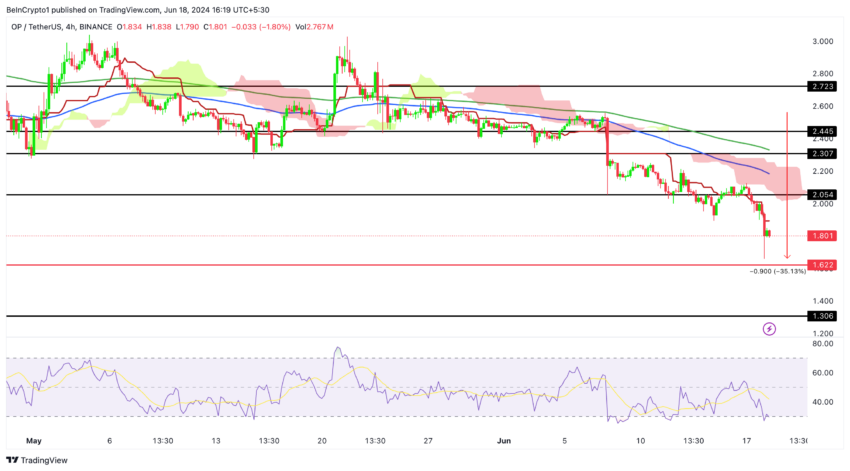
The Ichimoku Cloud provides further insight into the bearish outlook. The cloud is shaded in green and red, and the price is currently below it, signaling continued downward momentum.
The cloud’s red color further confirms this bearish trend. Key support levels to monitor are $1.622 and $1.306, with major resistance levels at $2.054, $2.307, $2.445, and $2.723. The RSI being below 40 indicates that the market sentiment is still bearish.
The overall trend for Optimism (OP/USDT) on the 4-hour chart remains bearish, as indicated by the price’s position below both the 100 EMA and 200 EMA and the Ichimoku Cloud, signaling downward momentum. Traders should be cautious and watch for potential rebounds at the support levels of $1.801 and $1.622 or further declines if these levels are breached.
Conversely, a break above the $2.05 resistance level and the Ichimoku Cloud could mean a potential bullish reversal.
Analysis of Optimism Profitability Metrics
Understanding the economic sentiment and behavior of participants within the Optimism blockchain network is essential for making informed decisions.
To do this, we look at the profitability of active addresses on the network. These active addresses are divided into three categories based on whether they are making a profit or loss: out of the money (addresses that are currently incurring losses), at the money (addresses that are breaking even), and in the money (addresses that are currently making a profit).
In June, the percentage of addresses losing money fluctuated a lot. It reached a high of 58.52% on June 8 and a low of 16.23% on June 5. From June 1 to June 7, this percentage rose from 15.12% to 56.22%, with a big jump on June 7.
By June 17, this percentage had decreased to around 48%, showing that fewer addresses were losing money compared to the peak on June 8.
Read More: What Is Optimism (OP)
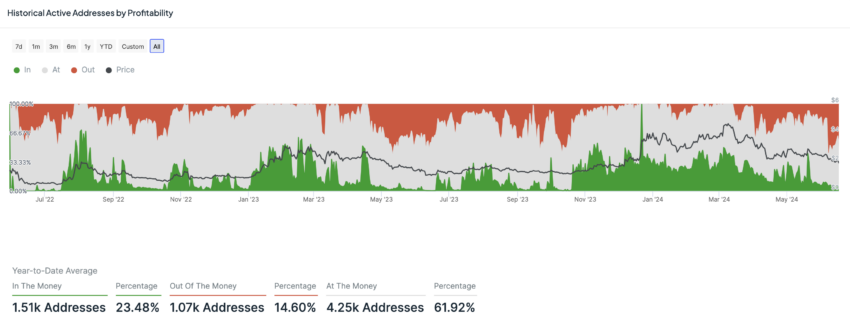
The percentage of addresses breaking even showed various trends, ranging from 35.60% on June 8 to 77.12% on June 16. From June 1 to June 7, the percentage dropped from 78.50% to 37.61%, with a sharp decline on June 7. After reaching a low of 37%, the percentage climbed back up to 57% on June 16 and settled at 47% on June 17.
The percentage of addresses making a profit changed moderately throughout June. On June 5, the peak was 10.24%, meaning only 10% of active addresses were in profit at the trading price range of $2 – $2.90. From June 1, the percentage increased from 6.37% to 10.24% on June 5, then decreased to 5.35% on June 17.
When a high percentage of addresses are losing money, it indicates that many participants are facing losses. This can lead to increased sell pressure, where more people might sell their holdings to cut losses, leading to bearish market sentiment. Fluctuations in the percentage of addresses breaking even suggest periods of uncertainty or stability.
Strategic Recommendations
As highlighted in the analysis, both the fundamental and technical outlooks are bearish. For a potential reversal to a bullish trend, OP must rise above the critical resistance level of $2.05. This level is essential to monitor, as breaking it could signal a shift in market sentiment. Additionally, traders should watch the 4-hour Ichimoku Cloud. If OP breaks through the cloud to the upside, it could mark the end of the current bearish trend and the start of a bullish phase.
In the event that the Optimism price fails to break the $2.05, the bearish continuation could be confirmed. Monitoring the profitability of active addresses is a good way to understand if there is significant pain in the market. Buying during extreme pain can be a strategic move for long-term holders, especially since we are in a crypto bull market that is not over yet.
Disclaimer
In line with the Trust Project guidelines, this price analysis article is for informational purposes only and should not be considered financial or investment advice. BeInCrypto is committed to accurate, unbiased reporting, but market conditions are subject to change without notice. Always conduct your own research and consult with a professional before making any financial decisions. Please note that our Terms and Conditions, Privacy Policy, and Disclaimers have been updated.


Aayush Jindal, a luminary in the world of financial markets, whose expertise spans over 15 illustrious years in the realms of Forex and cryptocurrency trading. Renowned for his unparalleled proficiency in providing technical analysis, Aayush is a trusted advisor and senior market expert to investors worldwide, guiding them through the intricate landscapes of modern finance with his keen insights and astute chart analysis.
From a young age, Aayush exhibited a natural aptitude for deciphering complex systems and unraveling patterns. Fueled by an insatiable curiosity for understanding market dynamics, he embarked on a journey that would lead him to become one of the foremost authorities in the fields of Forex and crypto trading. With a meticulous eye for detail and an unwavering commitment to excellence, Aayush honed his craft over the years, mastering the art of technical analysis and chart interpretation.
As a software engineer, Aayush harnesses the power of technology to optimize trading strategies and develop innovative solutions for navigating the volatile waters of financial markets. His background in software engineering has equipped him with a unique skill set, enabling him to leverage cutting-edge tools and algorithms to gain a competitive edge in an ever-evolving landscape.
In addition to his roles in finance and technology, Aayush serves as the director of a prestigious IT company, where he spearheads initiatives aimed at driving digital innovation and transformation. Under his visionary leadership, the company has flourished, cementing its position as a leader in the tech industry and paving the way for groundbreaking advancements in software development and IT solutions.
Despite his demanding professional commitments, Aayush is a firm believer in the importance of work-life balance. An avid traveler and adventurer, he finds solace in exploring new destinations, immersing himself in different cultures, and forging lasting memories along the way. Whether he’s trekking through the Himalayas, diving in the azure waters of the Maldives, or experiencing the vibrant energy of bustling metropolises, Aayush embraces every opportunity to broaden his horizons and create unforgettable experiences.
Aayush’s journey to success is marked by a relentless pursuit of excellence and a steadfast commitment to continuous learning and growth. His academic achievements are a testament to his dedication and passion for excellence, having completed his software engineering with honors and excelling in every department.
At his core, Aayush is driven by a profound passion for analyzing markets and uncovering profitable opportunities amidst volatility. Whether he’s poring over price charts, identifying key support and resistance levels, or providing insightful analysis to his clients and followers, Aayush’s unwavering dedication to his craft sets him apart as a true industry leader and a beacon of inspiration to aspiring traders around the globe.
In a world where uncertainty reigns supreme, Aayush Jindal stands as a guiding light, illuminating the path to financial success with his unparalleled expertise, unwavering integrity, and boundless enthusiasm for the markets.

Global investment management firm VanEck has officially registered a statutory trust in Delaware for Binance’s BNB (BNB) exchange-traded fund (ETF).
This move marks the first attempt to launch a spot BNB ETF in the United States. It could potentially open new avenues for institutional and retail investors to gain exposure to the asset through a regulated investment vehicle.
VanEck Moves Forward with BNB ETF
The trust was registered on March 31 under the name “VanEck BNB ETF” with filing number 10148820. It was recorded on Delaware’s official state website.

The proposed BNB ETF would track the price of BNB. It is the native cryptocurrency of the BNB Chain ecosystem, developed by the cryptocurrency exchange Binance.
As per the latest data, BNB ranks as the fifth-largest cryptocurrency by market capitalization at $87.1 billion. Despite its significant market position, both BNB’s price and the broader cryptocurrency market have faced some challenges recently.
Over the past month, the altcoin’s value has declined 2.2%. At the time of writing, BNB was trading at $598. This represented a 1.7% dip in the last 24 hours, according to data from BeInCrypto.

While the trust filing hasn’t yet led to a price uptick, the community remains optimistic about the prospects of BNB, especially with this new development.
“Send BNB to the moon now,” an analyst posted on X (formerly Twitter).
The filing comes just weeks after VanEck made a similar move for Avalanche (AVAX). On March 10, VanEck registered a trust for an AVAX-focused ETF.
This was quickly followed by the filing of an S-1 registration statement with the US Securities and Exchange Commission (SEC). Given this precedent, a similar S-1 filing for a BNB ETF could follow soon.
“A big step toward bringing BNB to US institutional investors!” another analyst wrote.
Meanwhile, the industry has seen an influx of crypto fund applications at the SEC following the election of a pro-crypto administration. In fact, a recent survey revealed that 71% of ETF investors are bullish on crypto and plan to increase their allocations to cryptocurrency ETFs in the next 12 months.
“Three-quarters of allocators expect to increase their investment in cryptocurrency-focused ETFs over the next 12 months, with demand highest in Asia (80%), and the US (76%), in contrast to Europe (59%),” the survey revealed.
This growing interest in crypto ETFs could drive further demand for assets like BNB, making the VanEck BNB ETF a potentially significant product in the market.
Disclaimer
In adherence to the Trust Project guidelines, BeInCrypto is committed to unbiased, transparent reporting. This news article aims to provide accurate, timely information. However, readers are advised to verify facts independently and consult with a professional before making any decisions based on this content. Please note that our Terms and Conditions, Privacy Policy, and Disclaimers have been updated.

XRP price started a fresh decline from the $2.20 zone. The price is now consolidating and might face hurdles near the $2.120 level.
- XRP price started a fresh decline after it failed to clear the $2.20 resistance zone.
- The price is now trading below $2.150 and the 100-hourly Simple Moving Average.
- There is a connecting bearish trend line forming with resistance at $2.120 on the hourly chart of the XRP/USD pair (data source from Kraken).
- The pair might extend losses if it fails to clear the $2.20 resistance zone.
XRP Price Faces Rejection
XRP price failed to continue higher above the $2.20 resistance zone and reacted to the downside, like Bitcoin and Ethereum. The price declined below the $2.150 and $2.120 levels.
The bears were able to push the price below the 50% Fib retracement level of the recovery wave from the $2.023 swing low to the $2.199 high. There is also a connecting bearish trend line forming with resistance at $2.120 on the hourly chart of the XRP/USD pair.
The price is now trading below $2.150 and the 100-hourly Simple Moving Average. However, the bulls are now active near the $2.10 support level. They are protecting the 61.8% Fib retracement level of the recovery wave from the $2.023 swing low to the $2.199 high.

On the upside, the price might face resistance near the $2.120 level and the trend line zone. The first major resistance is near the $2.150 level. The next resistance is $2.20. A clear move above the $2.20 resistance might send the price toward the $2.240 resistance. Any more gains might send the price toward the $2.2650 resistance or even $2.2880 in the near term. The next major hurdle for the bulls might be $2.320.
Another Decline?
If XRP fails to clear the $2.150 resistance zone, it could start another decline. Initial support on the downside is near the $2.10 level. The next major support is near the $2.0650 level.
If there is a downside break and a close below the $2.0650 level, the price might continue to decline toward the $2.020 support. The next major support sits near the $2.00 zone.
Technical Indicators
Hourly MACD – The MACD for XRP/USD is now gaining pace in the bearish zone.
Hourly RSI (Relative Strength Index) – The RSI for XRP/USD is now below the 50 level.
Major Support Levels – $2.10 and $2.050.
Major Resistance Levels – $2.120 and $2.20.

Kraken Obtains Restricted Dealer Registration in Canada

Lummis Confirms Treasury Probes Direct Buys

Franklin Templeton Eyes Crypto ETP Launch In Europe After BlackRock & 21Shares

What’s Fueling The Shibarium Boost?

BNB Price Faces More Downside—Can Bulls Step In?

Tokenized Gold Market Cap Tops $1.2 Billion as Gold Prices Surge

2.52 Million Altcoins Are Ruining Crypto’s Future

Animoca Brands Valuation Tanks 75% In Two Years, Here’s Why

Crypto exchange BingX hacked for $43 million

Are The Big Players Losing Interest?

Hong Kong’s Securities Association Tips Authorities On Crypto Self-Regulation

Coinbase cbBTC Set to go Live on Solana
2.52 Million Altcoins Are Ruining Crypto’s Future
Animoca Brands Valuation Tanks 75% In Two Years, Here’s Why
Crypto exchange BingX hacked for $43 million
Are The Big Players Losing Interest?
Hong Kong’s Securities Association Tips Authorities On Crypto Self-Regulation
Coinbase cbBTC Set to go Live on Solana
-
 Altcoin21 hours ago
XRP Price to $27? Expert Predicts Exact Timeline for the Next Massive Surge
-

 Altcoin24 hours ago
Binance Update Sparks 50% Decline For Solana Meme Coin ACT: Details
-

 Market21 hours ago
Ethereum Struggles to Break Out as Bear Trend Fades
-

 Market20 hours ago
How Did UPCX Lose $70 Million in a UPC Hack?
-

 Market24 hours ago
Bitcoin Stuck in Place as Tariffs and Charts Point Both Ways
-
 Market23 hours ago
Wintermute Sells ACT Tokens Due To Binance Limit Changes
-

 Market14 hours ago
Analyst Reveals ‘Worst Case Scenario’ With Head And Shoulders Formation
-

 Market22 hours ago
Binance Megadrop Launches KernelDAO