
Market
Litecoin (LTC) Fundamentals Indicate Bullish Momentum

From June 1 to June 16, Litecoin’s blockchain experienced significant activity, indicating strong bullish fundamentals.
The following analysis delves into the observed trends, highlighting the most noteworthy changes during this period.
Litecoin Address Growth Analysis
The period from June 1 to June 16 witnessed important activity in the Litecoin blockchain, as indicated by the growth in the total number of addresses. Below is a detailed analysis of the observed trends, highlighting the most significant changes during this period.
This indicator refers to the cumulative number of unique addresses that have been created on the Litecoin blockchain.
The number of total addresses on the Litecoin blockchain consistently increased from 283.80 million on June 1 to 287.42 million by June 16. This represents a growth of approximately 1.28% over the 16-day period.
Read More: Litecoin: A Complete Guide to What it is And How it Works
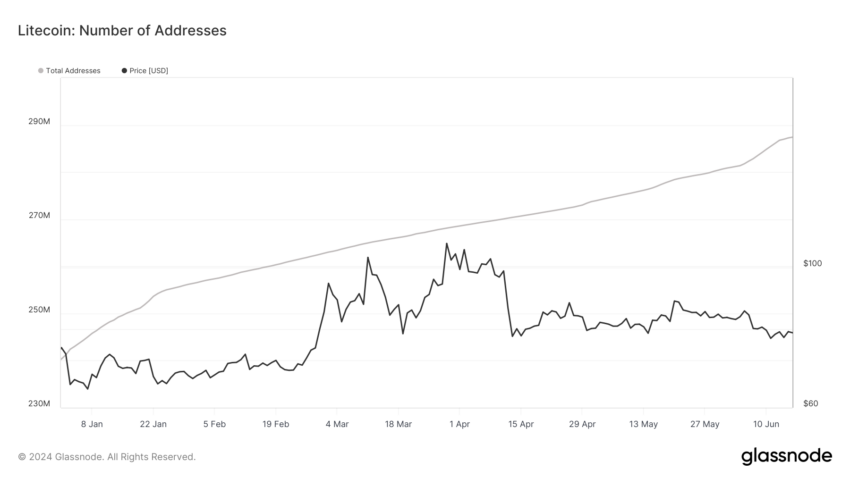
Between June 3 and June 4, we saw a significant change in the number of addresses. On June 3, there were 284.43 million addresses, which jumped to 284.9 million by June 4. Marking an increase of 511,527 addresses. This day saw the largest single-day increase, indicating a substantial influx of new users or addresses, likely linked to specific events or heightened network activity.
Another notable change occurred between June 12 and June 13. The number of addresses increased from 286.11 million on June 12 to 286.7 million on June 13. An increase of 650,128 addresses. This represents the second-largest increase in the dataset, suggesting another period of heightened activity.
From June 15 to June 16, the number of addresses rose from 287.25 million to 287.41 million, an increase of 165,306 addresses. Although smaller than the previous spikes, this increase indicates sustained interest and growth in the network towards the end of the period.
The consistent increase in total addresses is a positive indicator of market sentiment. It suggests growing trust and interest in the Litecoin network. The steady growth of addresses is a crucial adoption metric, reflecting increased usage and engagement.
HODLers are accumulating again
The HODLer Net Position Change indicator measures the net movement of Litecoin holdings by long-term investors (HODLers). It provides insights into these investors’ behavior by tracking whether they are accumulating (buying) or distributing (selling) their Litecoin holdings. This metric excludes lost coins, focusing only on actual movements, making it a precise tool to understand the active holdings in the market.
- Positive Values: Indicate net accumulation by HODLers, suggesting bullish sentiment and confidence in the long term. value.
- Negative Values: Indicate net distribution by HODLers, suggesting bearish sentiment or profit-taking behavior.
The HODLer Net Position Change metric provides insight into the behavior of long-term Litecoin holders. Over the observed period from May 29, 2024, to June 16, 2024, the metric shows positive values, indicating net accumulation rather than selling. However, the daily net position changes fluctuate.
Read More: How To Buy Litecoin (LTC) and Everything You Need To Know
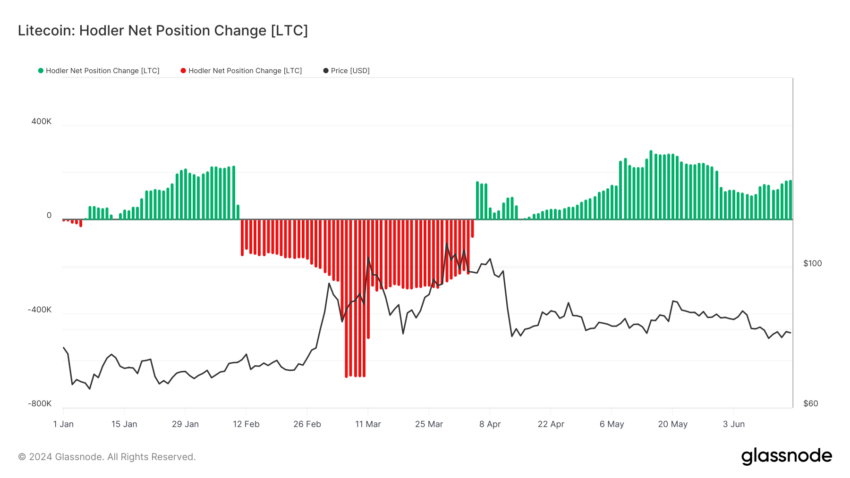
The metric remained positive throughout the period, which indicates that HODLers were generally accumulating Litecoin, reflecting a bullish sentiment among long-term investors.
From May 29 to June 7, the HODLer Net Position Change values decreased noticeably, dropping from 228,717.03 to 104,604.04. This decrease suggests a reduction in the accumulation rate or potential minor selling by HODLers during this period.
The fundamental outlook for LTC is looking bullish. The recent downtrend in Litecoin’s price, dropping from a local high of $85 on June 6 to $75. This is mainly due to Bitcoin’s price action and its impact on LTC and the broader crypto market. Litecoin has just broken through some major technical indicators, signaling that it might be a good time to buy, given the strong fundamentals.
Buying in the $71 – $75 range seems prudent, assuming the local low is around this area. If Bitcoin rebounds to $68,000, we could see Litecoin climbing back to $80.
Disclaimer
In line with the Trust Project guidelines, this price analysis article is for informational purposes only and should not be considered financial or investment advice. BeInCrypto is committed to accurate, unbiased reporting, but market conditions are subject to change without notice. Always conduct your own research and consult with a professional before making any financial decisions. Please note that our Terms and Conditions, Privacy Policy, and Disclaimers have been updated.


Ripple (XRP) price has experienced a significant rally, rising 51.33% in the last seven days and an impressive 109.09% over the past month. This strong momentum has propelled XRP into a bullish phase, with key indicators like EMA lines supporting its upward trajectory.
However, signs of weakening momentum, such as a declining RSI and negative CMF, suggest that caution may be warranted. Whether XRP continues to push higher or faces a steep correction will depend on how the market reacts to these shifting dynamics.
XRP RSI Is Below The Overbought Zone
XRP’s RSI has dropped to 60 after nearly hitting 90 on November 16 and staying above 70 between November 15 and November 17.
This decline indicates that Ripple has moved out of the overbought zone, where intense buying pressure previously drove its price higher. The drop suggests that the market is cooling off, with traders potentially taking profits after the strong rally.
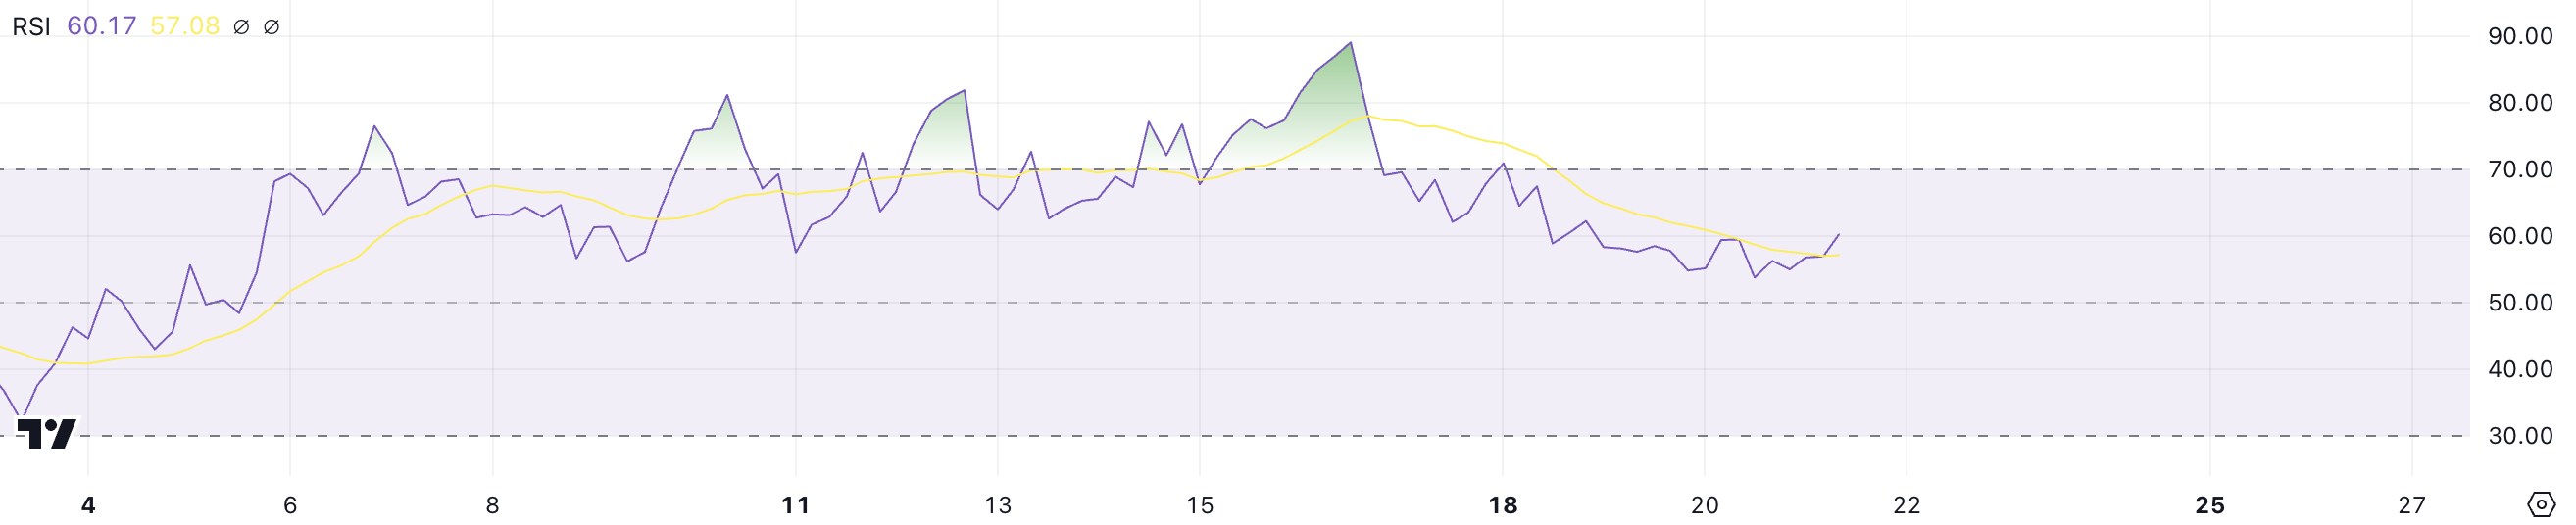
The RSI measures the speed and magnitude of price changes, with values above 70 indicating overbought conditions and below 30 signaling oversold levels. At 60, XRP’s RSI reflects a still-positive momentum but shows a more balanced sentiment compared to the previous surge.
While the uptrend remains intact, the lower RSI could indicate a slower pace of gains, with the possibility of consolidation as the market stabilizes. If buying pressure returns, XRP price could extend its upward movement, but a further decline in RSI might signal a weakening bullish momentum.
Ripple CMF Is Now Negative After Staying Positive For 14 Days
XRP Chaikin Money Flow (CMF) is currently at -0.12, after showing positive levels between November 5 and November 19. That is also its lowest level since October 31. This shift into negative territory reflects increased selling pressure and a potential outflow of capital from the asset.
The transition from positive CMF values earlier this month signals a weakening in bullish momentum as more market participants reduce exposure to Ripple.
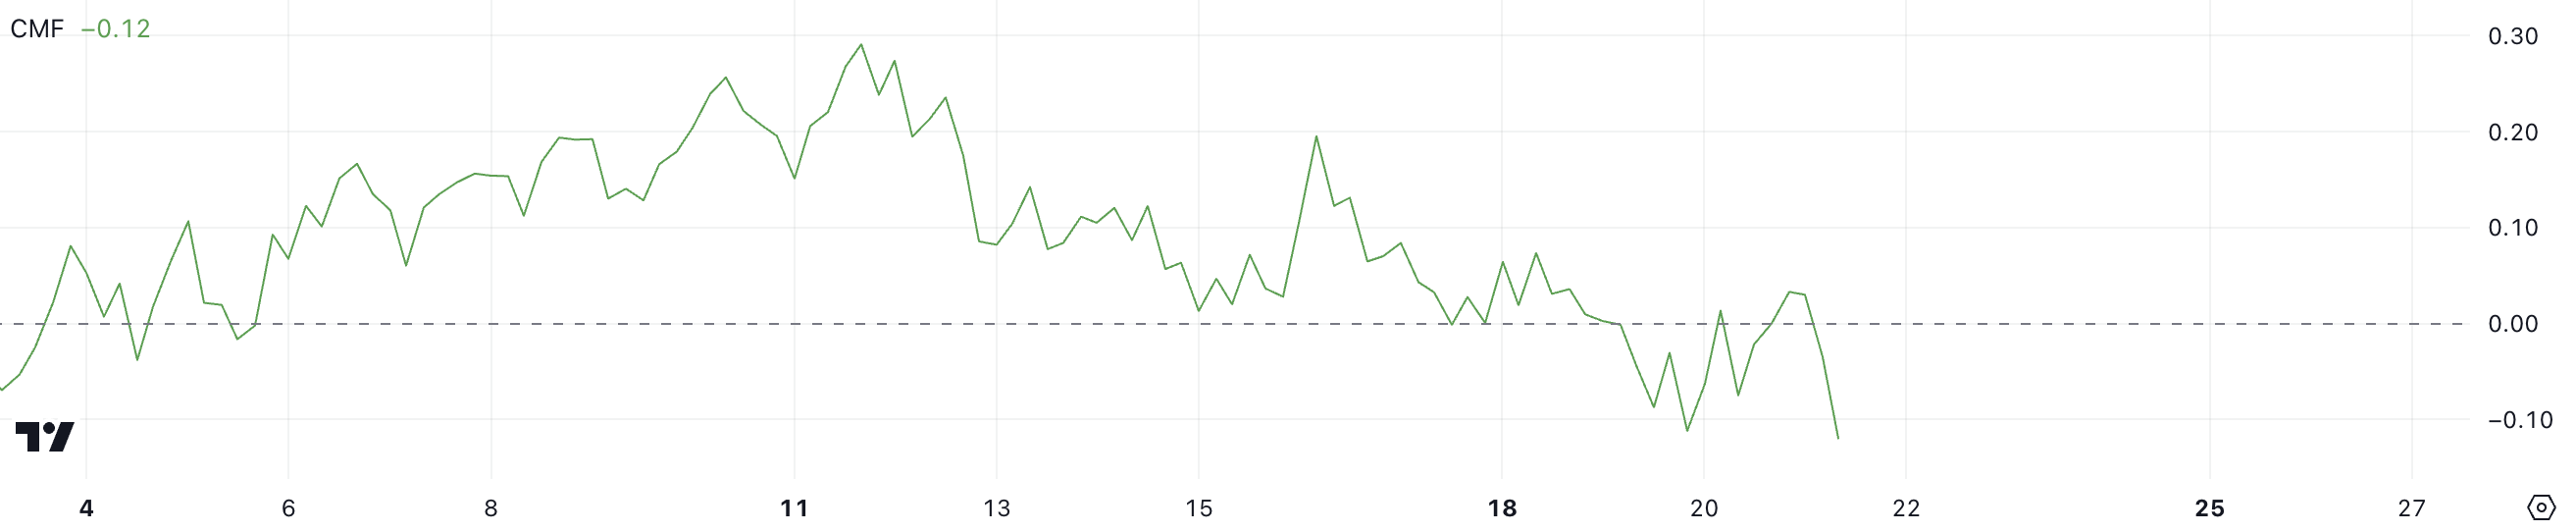
The CMF measures the volume and flow of money into or out of an asset, with positive values indicating capital inflow (bullish) and negative values showing capital outflow (bearish).
XRP’s CMF at -0.12 suggests that bearish sentiment is beginning to gain traction, potentially putting pressure on its price despite the recent uptrend. If the CMF remains negative or declines further, it could indicate sustained selling pressure, challenging Ripple’s ability to continue its upward movement.
Ripple Price Prediction: Biggest Price Since 2021?
XRP’s EMA lines currently display a bullish setup, with short-term lines positioned above the long-term lines and the price trading above all of them.
However, the narrowing distance between the price and some of these lines suggests a potential slowdown in bullish momentum. This could signal that the uptrend is weakening, leaving XRP price vulnerable to a shift in market sentiment.
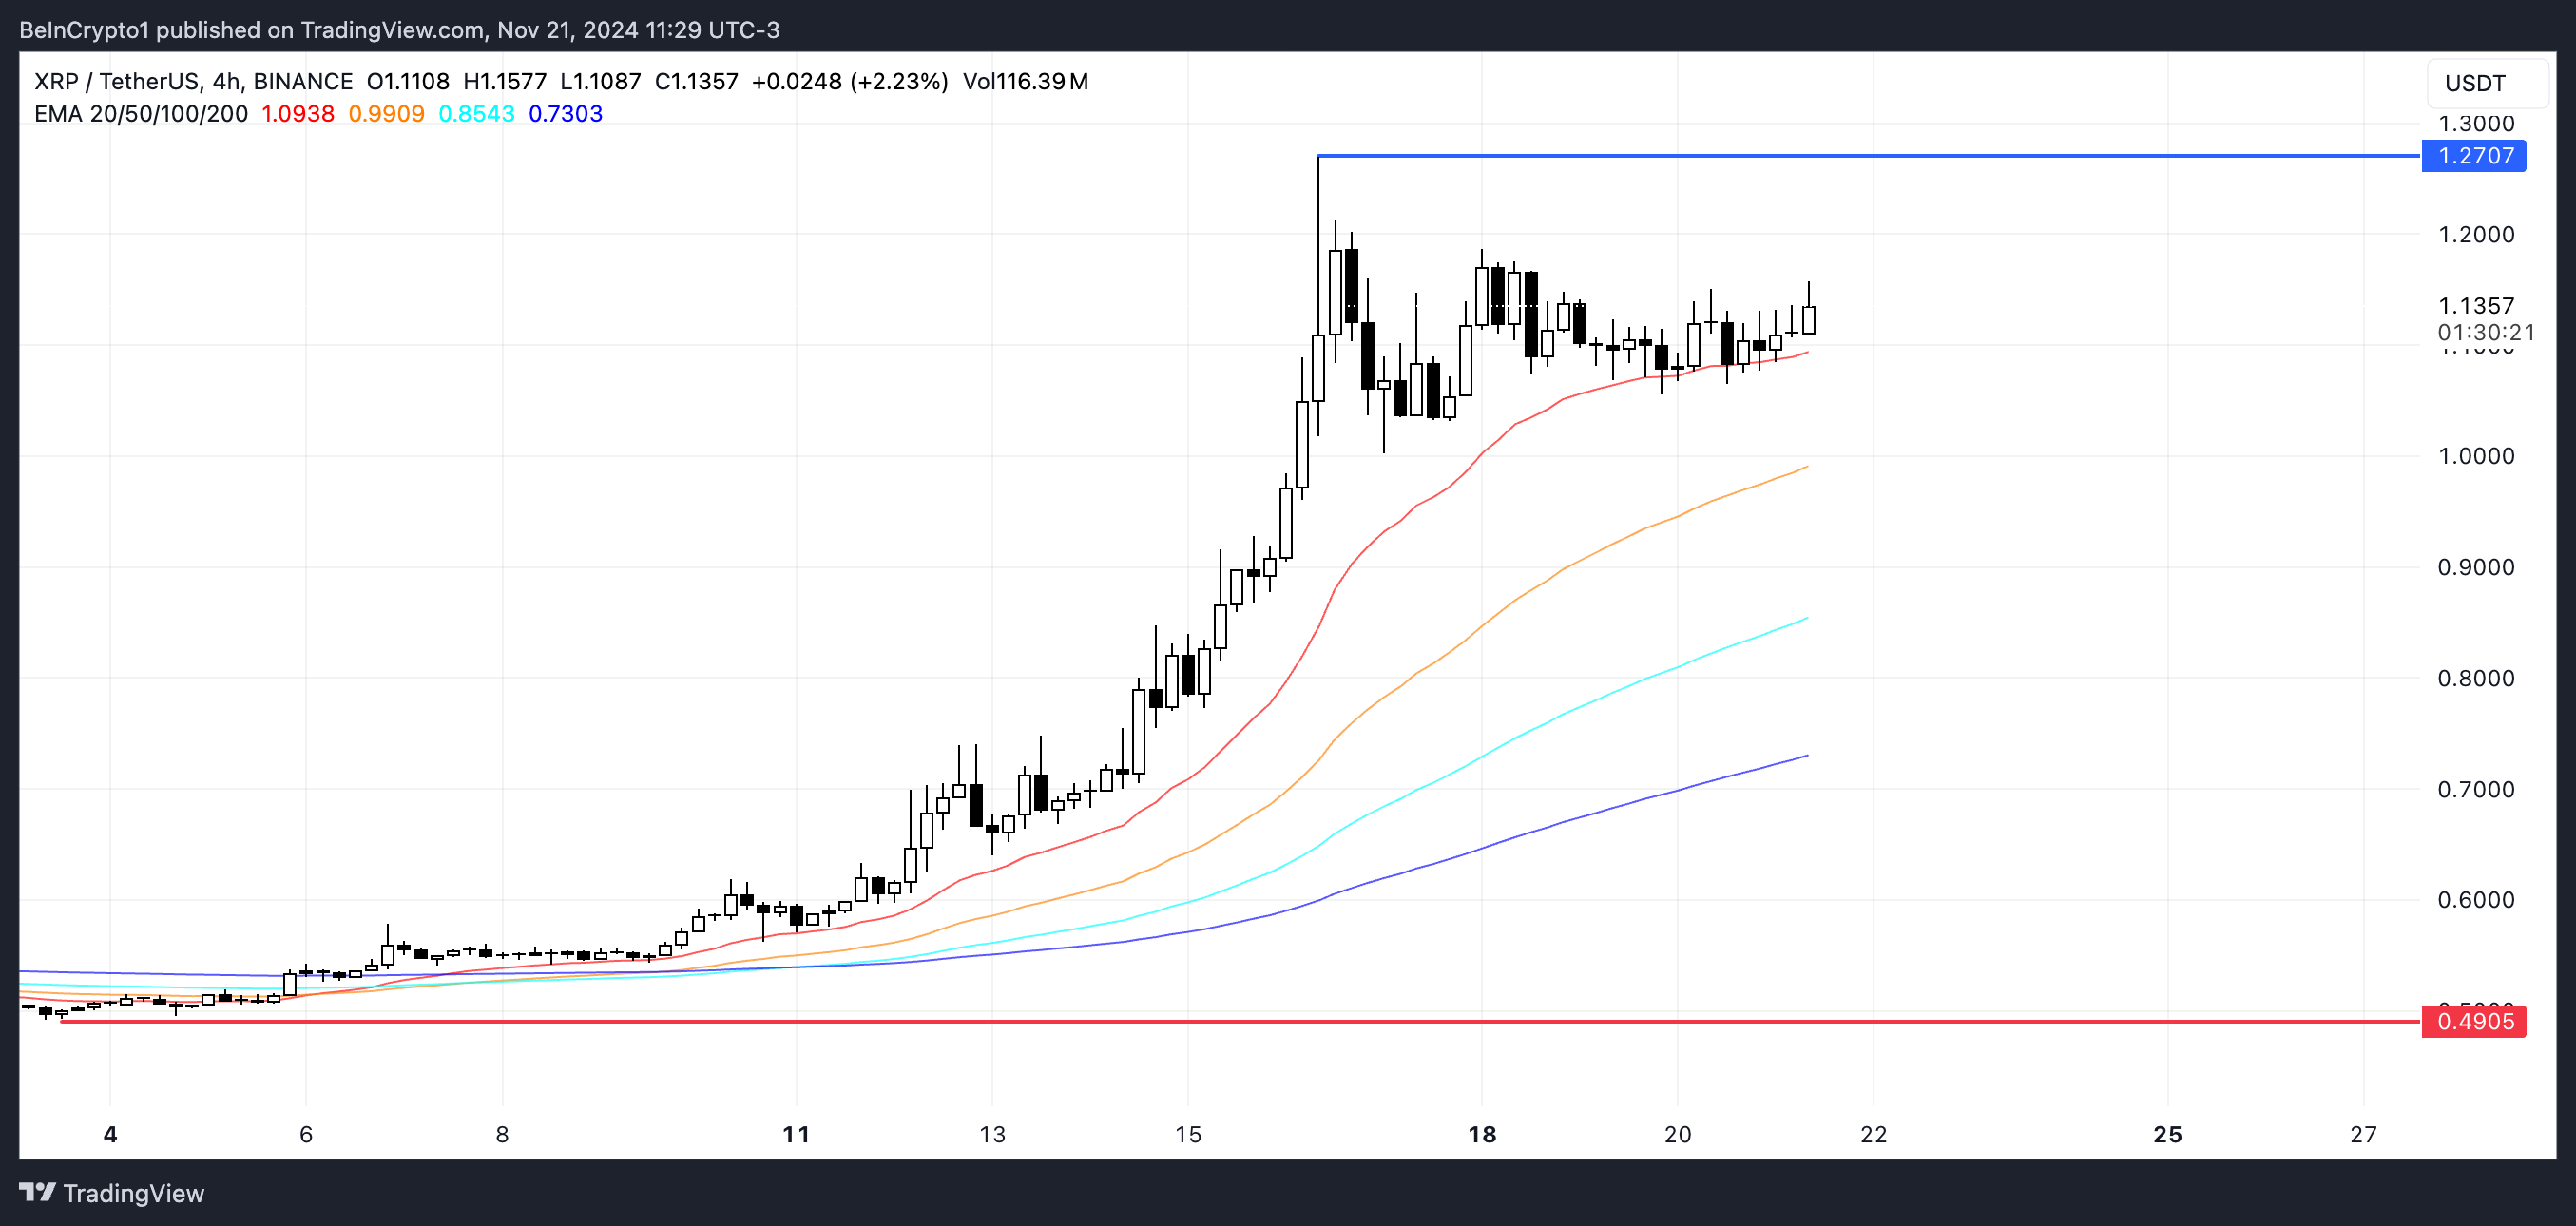
If a downtrend emerges, as indicated by the weakening RSI and negative CMF, Ripple price could face significant pressure and potentially drop to its support at $0.49, representing a substantial 56% correction.
On the other hand, if the uptrend regains strength, XRP could climb to test the $1.27 level and potentially break through to $1.30, which would mark its highest price since May 2021.
Disclaimer
In line with the Trust Project guidelines, this price analysis article is for informational purposes only and should not be considered financial or investment advice. BeInCrypto is committed to accurate, unbiased reporting, but market conditions are subject to change without notice. Always conduct your own research and consult with a professional before making any financial decisions. Please note that our Terms and Conditions, Privacy Policy, and Disclaimers have been updated.

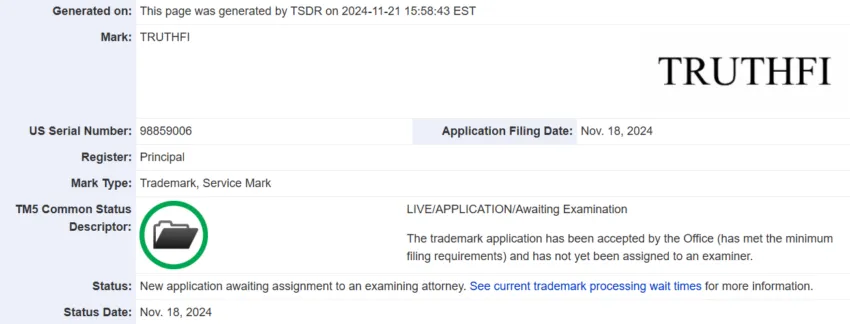
Trump Media & Technology Group is exploring the development of a crypto payment platform, as revealed by a recent trademark filing.
The application, submitted by Donald Trump’s social media company on Monday, outlines plans for a service named TruthFi. The proposed platform aims to offer crypto payments, financial custody, and digital asset trading.
Following the trademark announcement, Trump Media’s stock rose approximately 2%. At the time of writing, the stock was trading at $30.44, up by nearly 75% this year.
However, details about TruthFi remain scarce, including its timeline or operational specifics. This initiative suggests an effort by Trump Media to expand its business model beyond Truth Social.
The social media platform was established back in 2022, after Trump was banned from Facebook and X (formerly Twitter).
Nevertheless, launching a large-scale cryptocurrency platform could require Trump Media to acquire additional resources or partner with an established firm. This is because the firm currently has a small workforce of less than 40 employees.
“The filing, made with the USPTO on Monday, indicates that Trump Media plans to offer: Digital wallets, Cryptocurrency payment processing services, and A digital asset trading platform,” US Trademark Attorney Josh Gerben wrote on X (formerly Twitter).
As reported by BeInCrypto earlier, Trump Media is also in discussions to purchase the b2b crypto trading platform Bakkt. Shares in Bakkt surged by nearly 140% since the news earlier this week.
Meanwhile, the President-elect’s crypto plans seem to be in full swing even before he takes office in January. He is also reportedly considering the first-ever crypto advisor role for the White House, and interviewing several potential candidates.
Earlier today, the current SEC chair Gary Gensler announced his resignation before Trump’s term begins. Gensler’s resignation boosted the crypto market, as it signals a major change in the SEC’s regulatory stance.
Notably, XRP surged 7% to its highest value in three years. Bitcoin also neared $99,000, as the overall crypto market cap reached $3.4 trillion.
Disclaimer
In adherence to the Trust Project guidelines, BeInCrypto is committed to unbiased, transparent reporting. This news article aims to provide accurate, timely information. However, readers are advised to verify facts independently and consult with a professional before making any decisions based on this content. Please note that our Terms and Conditions, Privacy Policy, and Disclaimers have been updated.

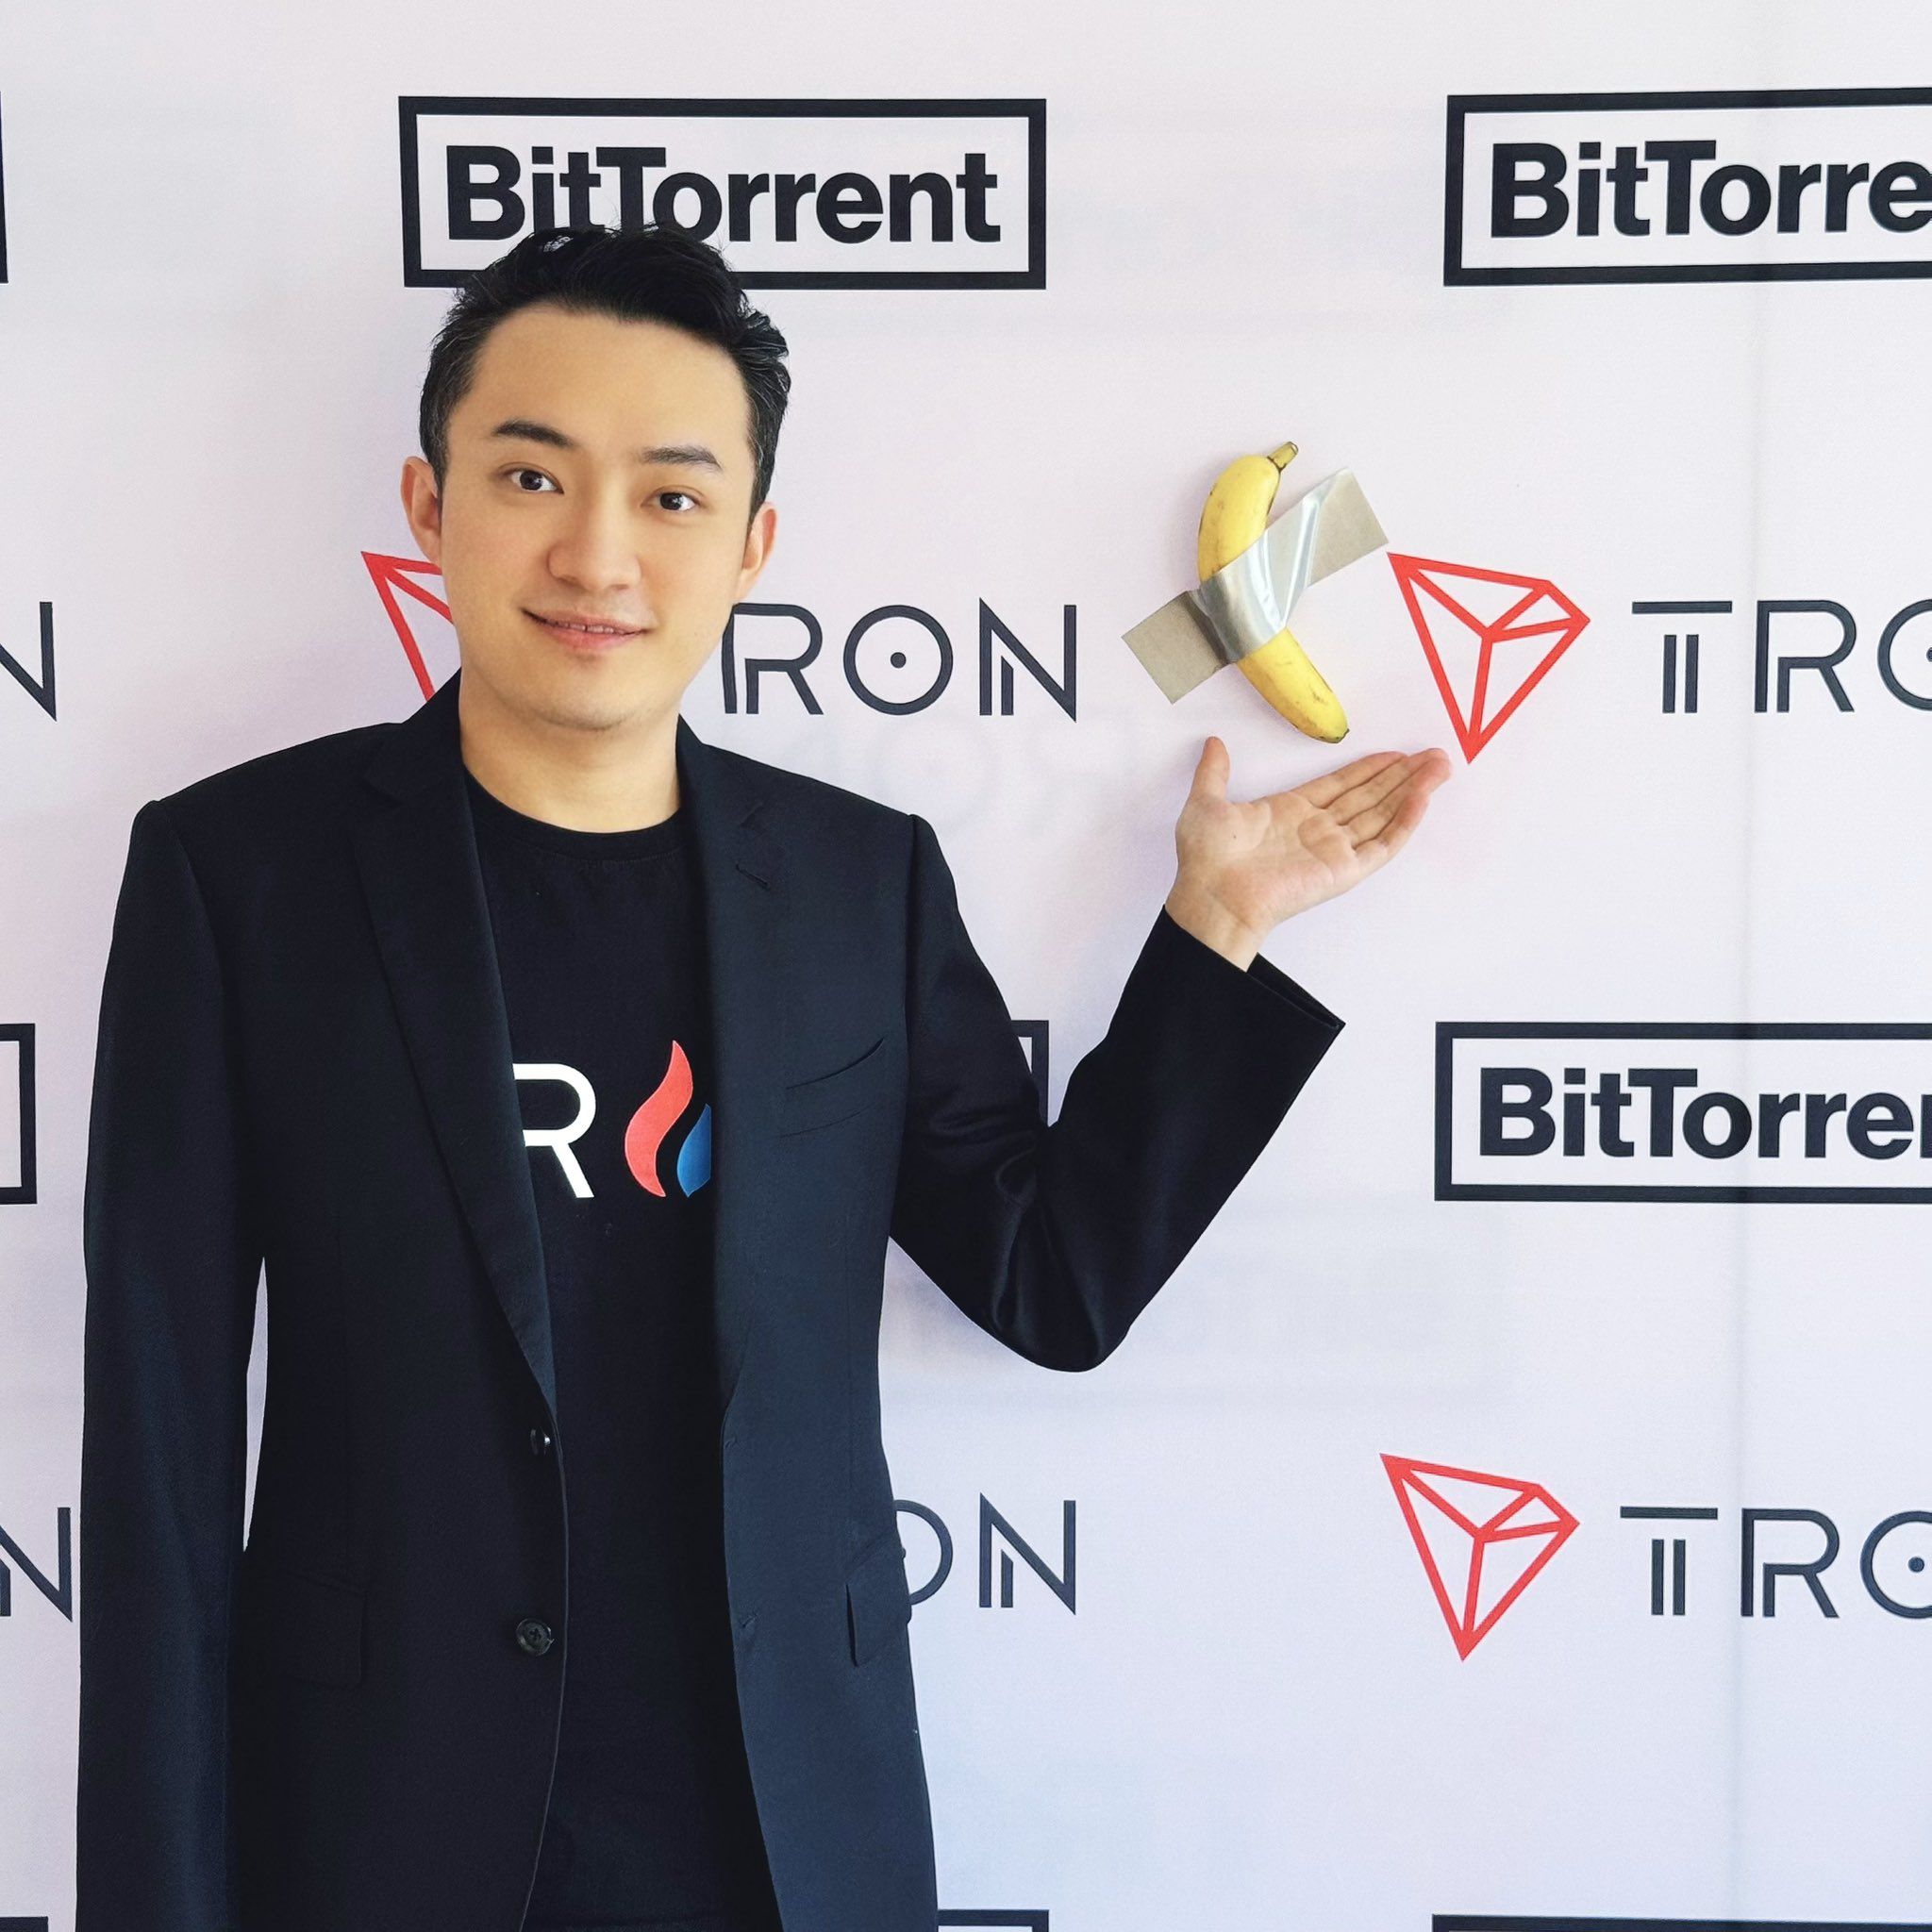
Justin Sun, founder of TRON and Poloniex CEO, has purchased the viral art piece Comedian—a banana duct-taped to a wall—for $6.2 million at Sotheby’s.
Following the purchase, Sun announced on X (formerly Twitter) that he plans to eat the artwork. This has ignited a frenzy of memes, commentary, and market reactions, even causing the crypto token Banana Gun to spike in value.
Crypto Reacts: Banana Gun on the Rise
Maurizio Cattelan’s Comedian gained international fame in 2019 when it was first displayed at Art Basel Miami. Its simplicity and absurdity—a banana taped to a wall—sparked debates about the nature of art. The so-called artwork became viral when performance artist David Datuna ate it in a stunt dubbed Hungry Artist.
Sun’s pledge to eat the $6.2 million fruit has also drawn parallels, adding another layer of humor to the piece’s history. The Tron founder even said he’s willing to donate the banana to Elon Musk and send it to Mars.
Meanwhile, several users even recreated their own version of Comedian and shared it on social media. One fan followed up by taping bananas around the Massachusetts Institute of Technology (MIT) campus, encouraging others to “tape all over the world” and start a movement.
What they are campaigning for, precisely, remains to be seen.
“In the coming days, I will personally eat the banana as part of this unique artistic experience, honoring its place in both art history and popular culture. Stay tuned,” Sun said on X.
The ripple effects of Sun’s purchase eventually trickled beyond the confines of art and humor and into crypto markets. The token Banana Gun, which shares its name with the theme, surged nearly 16% following the news. Traders and enthusiasts, ever attuned to cultural moments, appear to have seized the chance to capitalize on the buzz.

Sun’s acquisition and the banana’s virality bring to mind another recent development in the art-crypto nexus. Earlier this week, Ethereum co-founder Vitalik Buterin allegedly minted 400 Patron NFTs. This development sparked hopes of a resurgence for the NFT market.
This aged well…. $BANANA is an insane project. For me, this is in the same league as $ZIG. Fundamentals are truly insane. No matter which narrative will cook next, $BANANA will profit from it,” said one trader on X.
The combination of Sun’s high-profile purchase and the market’s reaction to Banana Gun demonstrates how art, humor, and technology continue to blur boundaries. Whether Sun’s banana-eating spectacle will leave a lasting impact or peel away (pun intended) into meme history, one thing is certain—the intersection of crypto and culture remains as unexpected as ever.
Disclaimer
In adherence to the Trust Project guidelines, BeInCrypto is committed to unbiased, transparent reporting. This news article aims to provide accurate, timely information. However, readers are advised to verify facts independently and consult with a professional before making any decisions based on this content. Please note that our Terms and Conditions, Privacy Policy, and Disclaimers have been updated.

Ripple (XRP) Price Hits 109% Monthly Gain as Indicators Weaken

Ethereum Sees Neutral Netflow On Binance: What Does This Signal?
Trump Media Files Trademark for Crypto Platform TruthFi

UK to unveil crypto and stablecoin regulatory framework early next year

Banana Gun Rises After Justin Sun’s $6.2 Million Art Purchase
Cardano (ADA) Price Hits 41% Weekly Growth, $1 Target in Sight

2.52 Million Altcoins Are Ruining Crypto’s Future

Animoca Brands Valuation Tanks 75% In Two Years, Here’s Why

Crypto exchange BingX hacked for $43 million

Are The Big Players Losing Interest?

Hong Kong’s Securities Association Tips Authorities On Crypto Self-Regulation

Coinbase cbBTC Set to go Live on Solana
2.52 Million Altcoins Are Ruining Crypto’s Future
Animoca Brands Valuation Tanks 75% In Two Years, Here’s Why
Crypto exchange BingX hacked for $43 million
Are The Big Players Losing Interest?
Hong Kong’s Securities Association Tips Authorities On Crypto Self-Regulation
Coinbase cbBTC Set to go Live on Solana
-

 Market20 hours ago
This is Why MoonPay Shattered Solana Transaction Records
-

 Ethereum17 hours ago
Fundraising platform JustGiving accepts over 60 cryptocurrencies including Bitcoin, Ethereum
-
 Regulation23 hours ago
BitClave Investors Get $4.6M Back In US SEC Settlement Distribution
-

 Market23 hours ago
Nvidia Q3 Revenue Soars 95% to $35.1B, Beats Estimates
-

 Market22 hours ago
Dogecoin (DOGE) Price Momentum Weakens Despite Rally
-

 Altcoin22 hours ago
Crypto Analyst Says Dogecoin Price Has Entered Parabolic Surge To $23.36. Here Are The Reasons Why
-

 Market21 hours ago
Steady Climb Toward New Highs
-

 Market24 hours ago
RENDER Price Soars 48%, But Whale Activity Declines