
Market
Missed Pepe and Book of Meme? SolJu could be the next hit


-
Meme coins have a market cap of over $60 billion.
-
Tokens like Pepe and Bonk have made many millionaires.
-
SolJu could be the next big thing in the meme coin industry.
Meme coins have done well this year, as they outperformed most mainstream coins like Bitcoin, Ether, and Ripple. Some, like Pepe and Book of Meme (BOME) have surged to a record high while the total market cap of all coins has soared to over $60 billion. SolJu, an upcoming Solana meme coin, could be the next big thing in the industry.
Why meme coins soared
There are three main reasons why meme coins have done well this year. First, most of these tokens soared as a sense of greed spread in the market. The fear and greed index has mostly been in the green this year as investors anticipated rate cuts by central banks like the Federal Reserve and the ECB.
Second, meme coins jumped because of Bitcoin’s performance. Bitcoin, the biggest crypto in the world, jumped to a record high in March as investors cheered the approval of Bitcoin ETFs by the Federal Reserve. Since then, these funds have seen inflows of over 800k Bitcoins and the trend may continue.
The focus now shifts to the upcoming approval of Ethereum ETFs. In a statement last week, Gary Gensler predicted that these approvals will happen later this year.
Meme coins tend to do well when Bitcoin is thriving because of their cheaper prices. As a result, most investors buy them instead of the highly expensive coins like Bitcoin, Litecoin, and Bitcoin Cash.
Additionally, the concept of meme trading has rebounded as evidenced by companies like GameStop and AMC. Also, traders are being incentivised to buy meme coins by activities in social media.
SolJu could be the next big thing
Now, focus among meme crypto investors has shifted to SolJu, a new Solana meme coin that will be launched on Tuesday.
This is a meme coin that has been inspired by the success of Beercoin, a token whose market cap jumped to over $300 million recently.
Its name is derived from Sol – for Solana – and Soju, a popular South Korean spirit. As such, the hope is that the token will be a social platform where Solju holders will gather and form a makeshift gathering with beer and food.
SolJu will forego the popular route of a token sale. Instead, the developers are planning a fair sale, where all tokens will be released and then the market discovery will help to determine its value.
The initial supply of the token will be 100 million tokens while the initial liquidity will be $12,000. The starting price will be $0.00012, giving it room to grow in the coming months.
After the launch, the developers aim to boost its price through exchange listings, games, and partnerships in the crypto community. You can learn more about SolJu here.


Ethereum’s transaction fees have dropped to their lowest point over four years, marking a significant shift in on-chain activity.
The decline comes as the network faces mounting challenges, including falling market performance and weakening fundamentals.
Ethereum Faces Declining Fees and Inflation Concerns
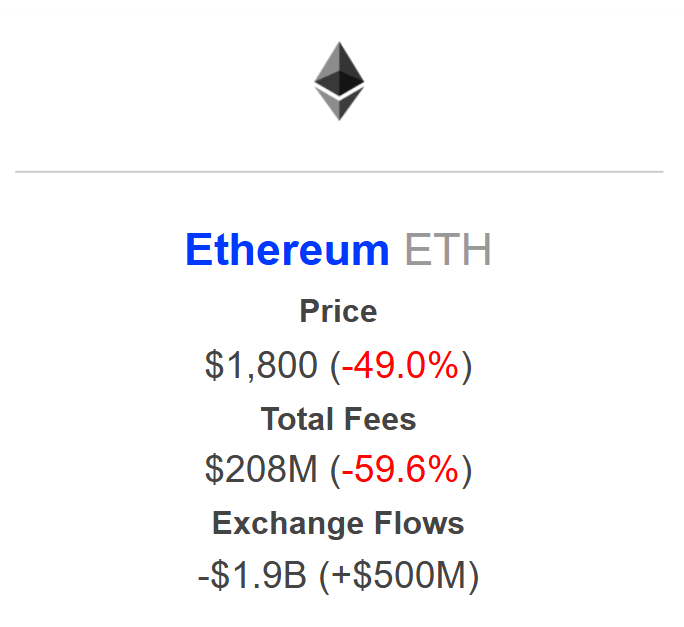
According to IntoTheBlock, Ethereum’s total transaction fees dropped by nearly 60% in Q1 2025, falling to roughly $208 million as of April 4. The firm noted that this was their lowest level since 2020.
“Total ETH fees decreased to their lowest level since 2020 this quarter, primarily driven by the gas limit increase and transactions moving to L2s,” IntoTheBlock stated.
Several factors have contributed to this decline. The biggest driver is the adoption of Layer-2 networks, especially Coinbase’s Base. Ethereum’s Dencun upgrade, which launched in March 2024, made transactions on these scaling layers much cheaper.
As a result, more users are bypassing Ethereum’s mainnet and shifting to faster, cost-effective alternatives. According to L2Beat, Base currently processes over 80 transactions per second, leading all other Layer-2 networks.
Despite the benefits of lower fees, Ethereum’s underlying metrics are showing signs of strain.
Michael Nadeau, founder of The DeFi Report, flagged a steep drop in ETH burn rates. He noted that ETH burned through major platforms like Uniswap, Tether, MetaMask, and 1inch, which collapsed by more than 95% since November 2024.
Nadeau explained that fading retail enthusiasm and the slower-than-expected scaling from L2s are contributing to Ethereum’s reduced deflationary pressure.
“ETH’s annualized inflation is now 0.75%. We should expect it to continue to rise, exceeding BTC inflation. We should also expect Ethereum’s fundamentals to continue to erode over the next year,” he added.
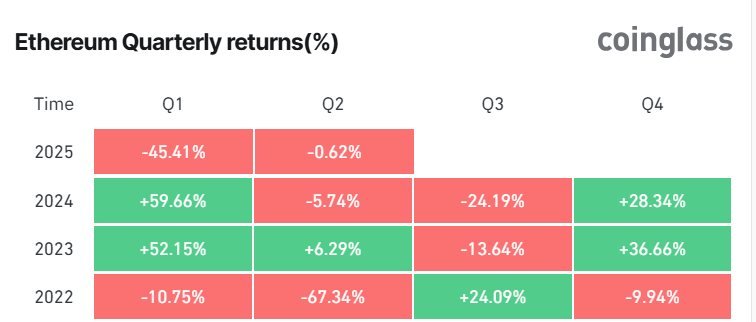
Meanwhile, the network’s financial performance reflects these concerns. ETH’s price fell over 45% in Q1 2025, marking its worst quarterly performance since 2022.
In comparison to Bitcoin, Ethereum has also underperformed, losing 39% of its value against BTC this year. That drop has pushed the ETH/BTC ratio to its lowest point in nearly five years.
Still, long-term investors are not backing down. IntoTheBlock pointed out that Ethereum whales accumulated over 130,000 ETH as the price dipped below $1,800—its lowest since November 2024—signaling strong buy-the-dip sentiment.
Beyond that, industry experts believe the upcoming Pectra upgrade, scheduled for May, could give the asset a fresh start.
According to them, Pectra can help restore confidence and drive renewed growth across the Ethereum ecosystem with its improved wallet functionality and user experience.
Disclaimer
In adherence to the Trust Project guidelines, BeInCrypto is committed to unbiased, transparent reporting. This news article aims to provide accurate, timely information. However, readers are advised to verify facts independently and consult with a professional before making any decisions based on this content. Please note that our Terms and Conditions, Privacy Policy, and Disclaimers have been updated.

Pi Network has been the subject of investor frustration due to its delayed mainnet launch and lack of Binance listing. Amidst all this, the token recently hit a new low before recovering sharply.
After a significant decline, the altcoin has surged by 36%, leaving investors to wonder if this marks the beginning of a reversal.
Pi Network Investors Are Optimistic
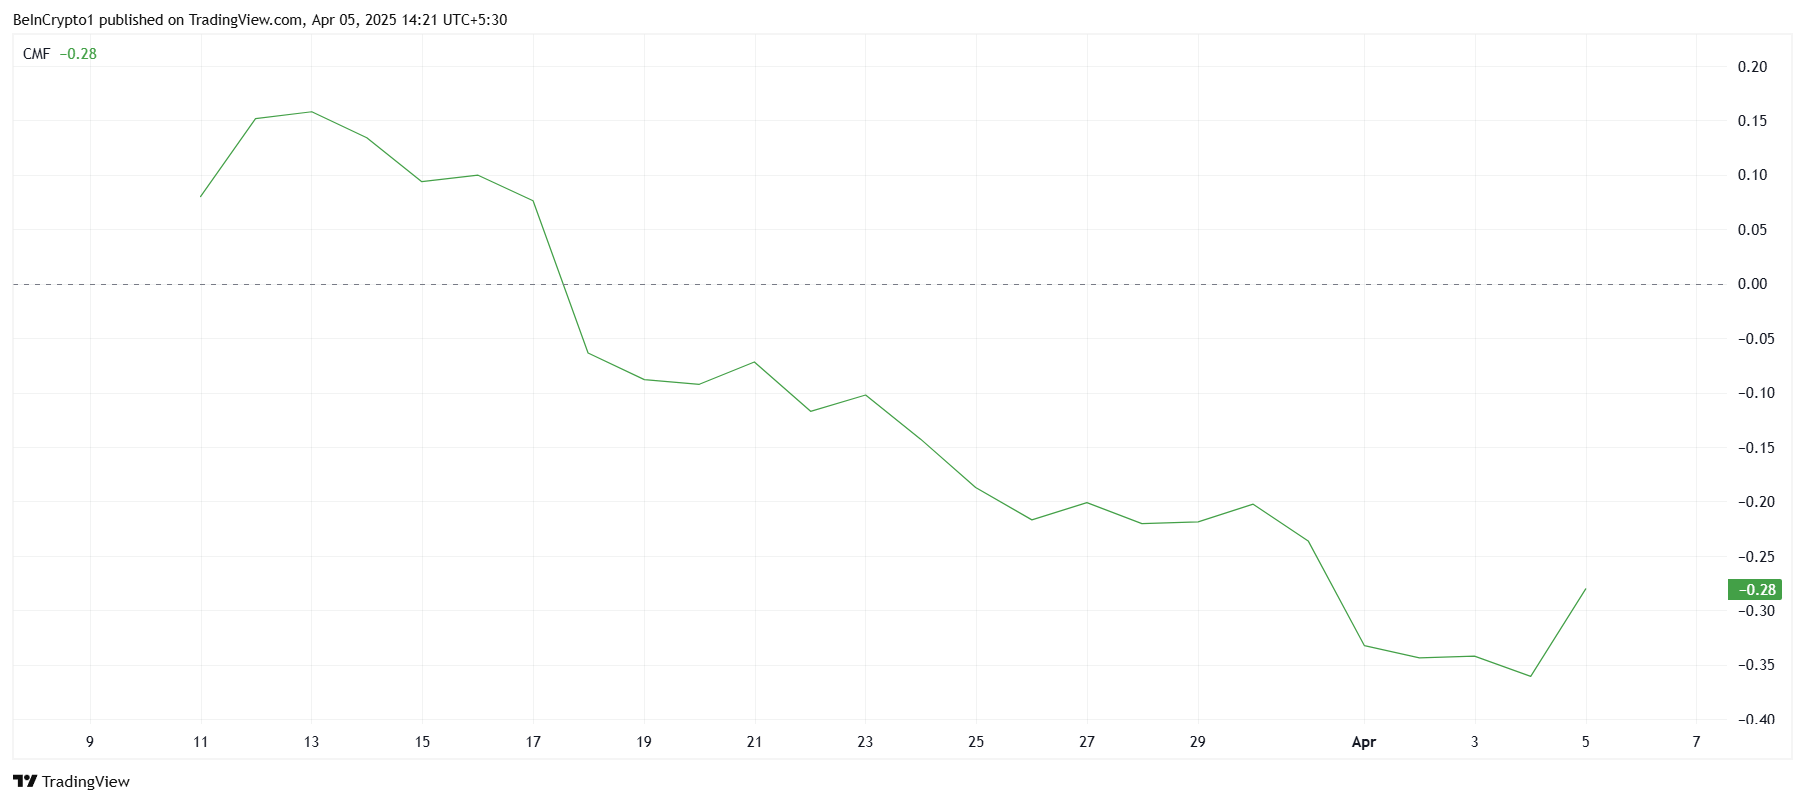
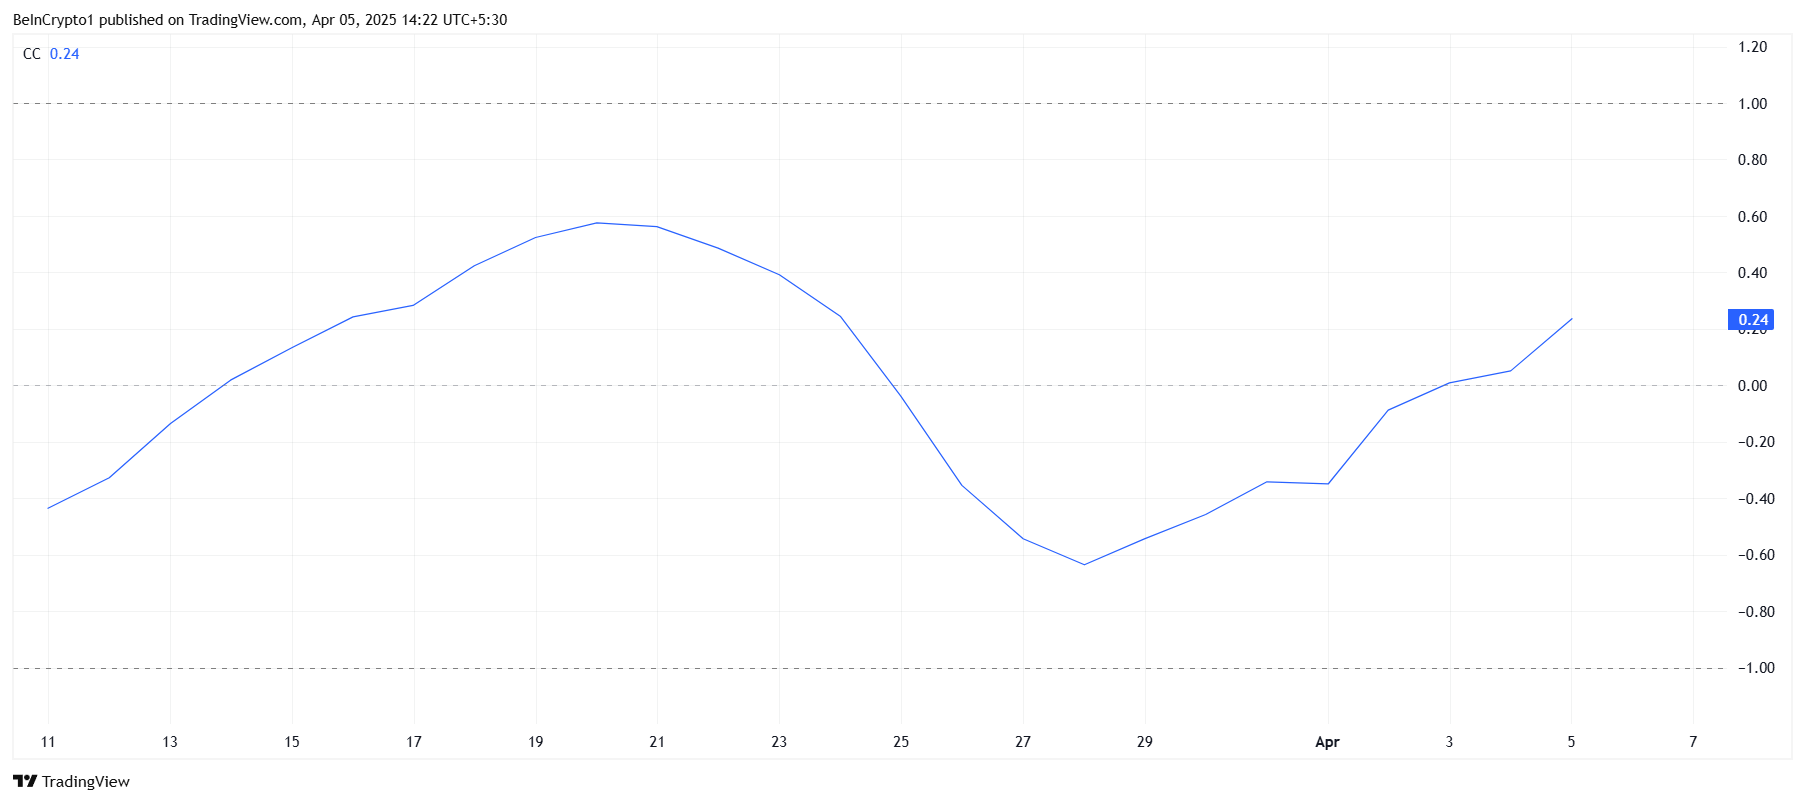
The Chaikin Money Flow (CMF) indicator is showing an uptick, signaling positive inflows into Pi Network at the time of writing. This shift suggests that investor confidence is returning, likely due to the altcoin hitting what seems to be its market bottom. With market conditions expected to improve, Pi Network appears to be positioned for a potential rally, with investors looking to capitalize on its current price.
Owing to the prolonged downtrend, these positive inflows indicate that market sentiment may be shifting. Investors who were previously hesitant may now be more willing to re-enter the market and seek profit.
Pi Network’s correlation with Bitcoin has also shown signs of improvement, with the current correlation at 0.24. Although still low, this improvement suggests that Pi Network may begin to follow Bitcoin’s price movements. If Bitcoin experiences a significant rally, Pi Network could follow suit, benefiting from the broader market’s bullish momentum.
This increasing correlation could be crucial for Pi Network, as it indicates a stronger alignment with the larger crypto market. If Bitcoin’s price begins to surge, Pi Network’s recovery could gain additional momentum.
PI Price Is Bouncing Back
Pi Network’s price fell to a new all-time low of $0.40 during an intra-day low, marking a significant dip for the token. However, it quickly recovered, posting a 36% gain and reaching an intra-day high of $0.71.
This price movement shows that the altcoin is capable of rapid reversals, but it remains to be seen if this momentum will continue.
Given the positive indicators, Pi Network may continue its upward trajectory, potentially reaching the $0.87 level and even $1.00. These price points would represent a substantial recovery from its recent lows and may help restore investor confidence in the altcoin’s long-term viability.
However, the key factor will be whether it can maintain its upward movement.
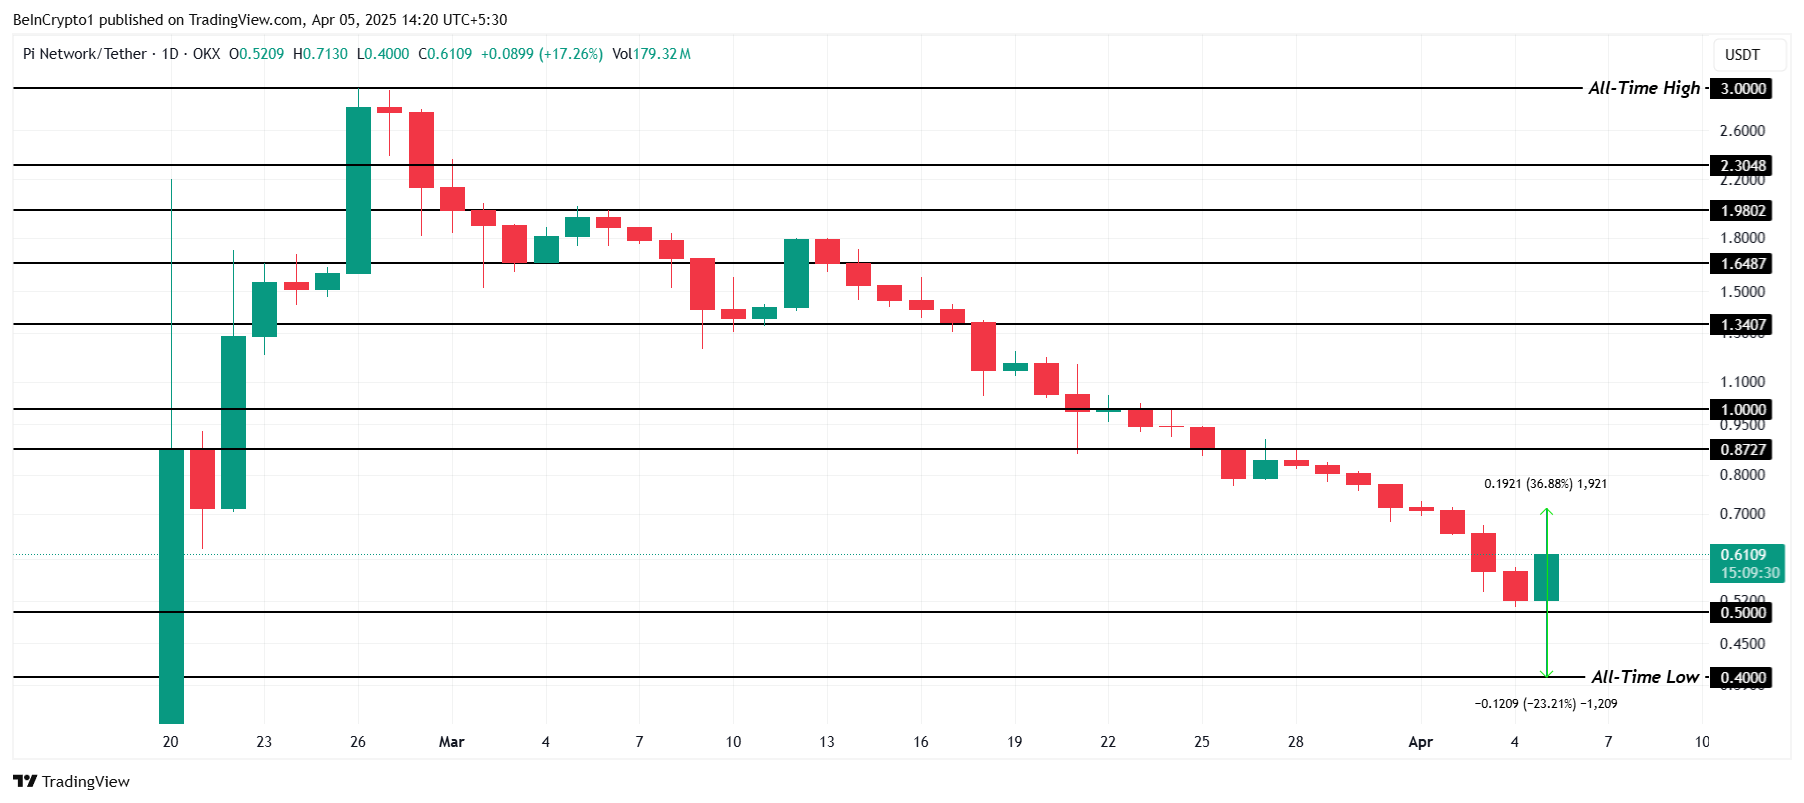
On the other hand, if bearish signals persist and Pi Network loses the support of $0.50, the altcoin may fall back to $0.40 or lower, invalidating the current bullish outlook. This scenario could bring further declines, extending the downtrend that investors have been watching closely.
Disclaimer
In line with the Trust Project guidelines, this price analysis article is for informational purposes only and should not be considered financial or investment advice. BeInCrypto is committed to accurate, unbiased reporting, but market conditions are subject to change without notice. Always conduct your own research and consult with a professional before making any financial decisions. Please note that our Terms and Conditions, Privacy Policy, and Disclaimers have been updated.
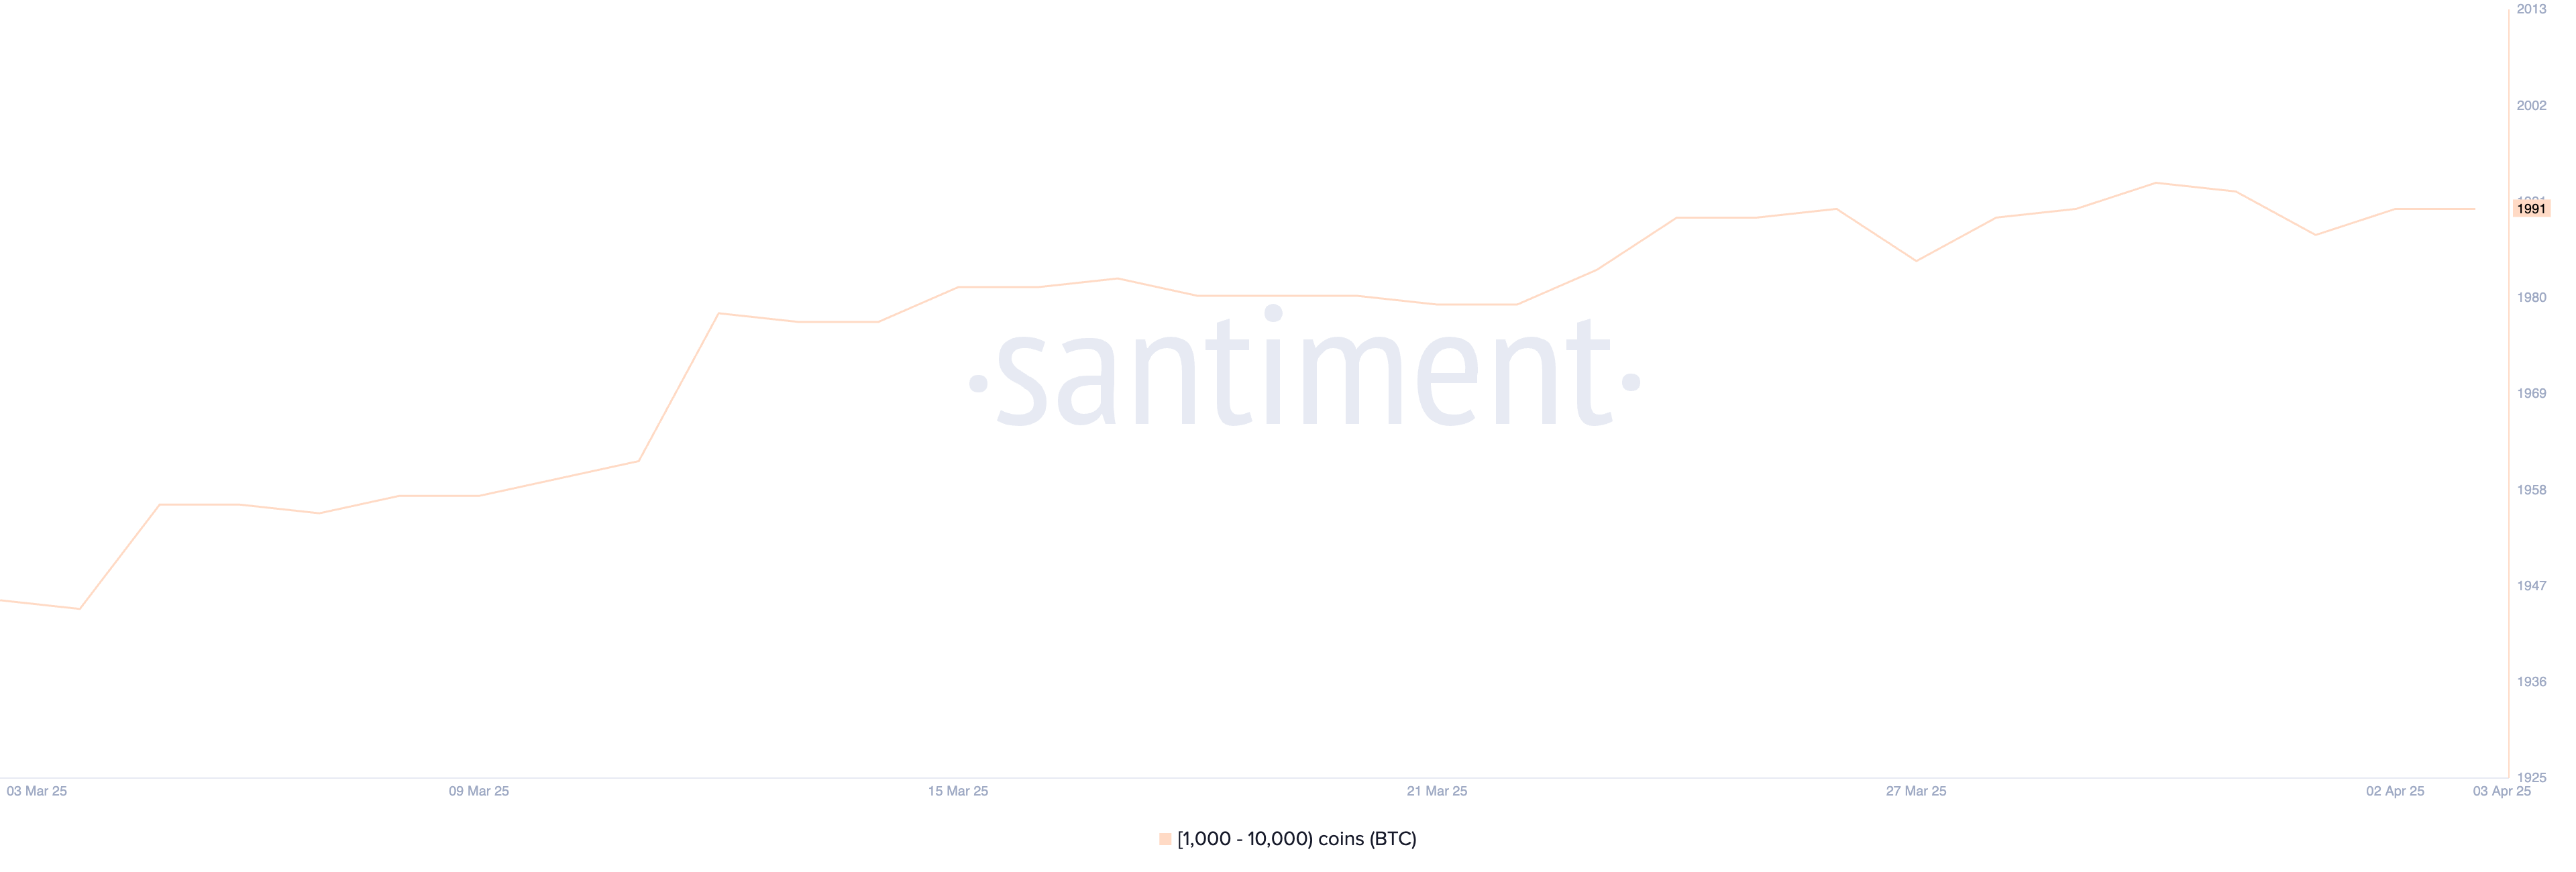
Bitcoin (BTC) continues to hover in a state of uncertainty as both whale activity and technical indicators point to a market lacking strong conviction. Large holders have remained inactive for over a week, with the number of whale wallets holding between 1,000 and 10,000 BTC steady at 1,991 since March 24.
Meanwhile, technical charts like the Ichimoku Cloud and EMA lines offer a mixed outlook, reflecting hesitation in both bullish and bearish directions. As BTC trades near key support and resistance levels, the coming days could determine whether April brings a breakout or deeper correction.
Bitcoin Whales Aren’t Accumulating
The number of Bitcoin whales—wallets holding between 1,000 and 10,000 BTC—currently stands at 1,991, a figure that has remained remarkably steady since March 24.
This level of consistency in large holder activity suggests that major players are neither aggressively accumulating nor offloading their positions.
Given the size of these holdings, even minor shifts in whale behavior can significantly impact the market. This stability is particularly noteworthy given recent volatility across the broader crypto market.
Tracking Bitcoin whales is crucial because these large holders often have the power to influence price action through their buying or selling decisions.
When whales accumulate BTC, it can signal confidence in future price appreciation, while large-scale selling can indicate upcoming downward pressure. The fact that the number of whales has remained stable for the last 11 days may suggest a period of consolidation, where big investors are waiting for a clearer macro or market signal before making their next move.
This could imply that major players see the current BTC price as fair value, potentially leading to a tightening of price action in the short term before a breakout in either direction.
BTC Ichimoku Cloud Shows A Mixed Picture
The current Ichimoku Cloud setup for Bitcoin shows a mixed but slightly cautious sentiment.
The price recently dipped below the red baseline (Kijun-sen), and despite a brief push into the cloud, it was rejected and fell back below it—indicating that bullish momentum lacked follow-through.
The blue conversion line (Tenkan-sen) is now trending downward and has crossed below the baseline, which often reflects short-term bearish momentum. Meanwhile, the Leading Span A (green cloud boundary) is starting to flatten, while Leading Span B (red boundary) remains relatively horizontal, forming a thin and neutral cloud ahead.
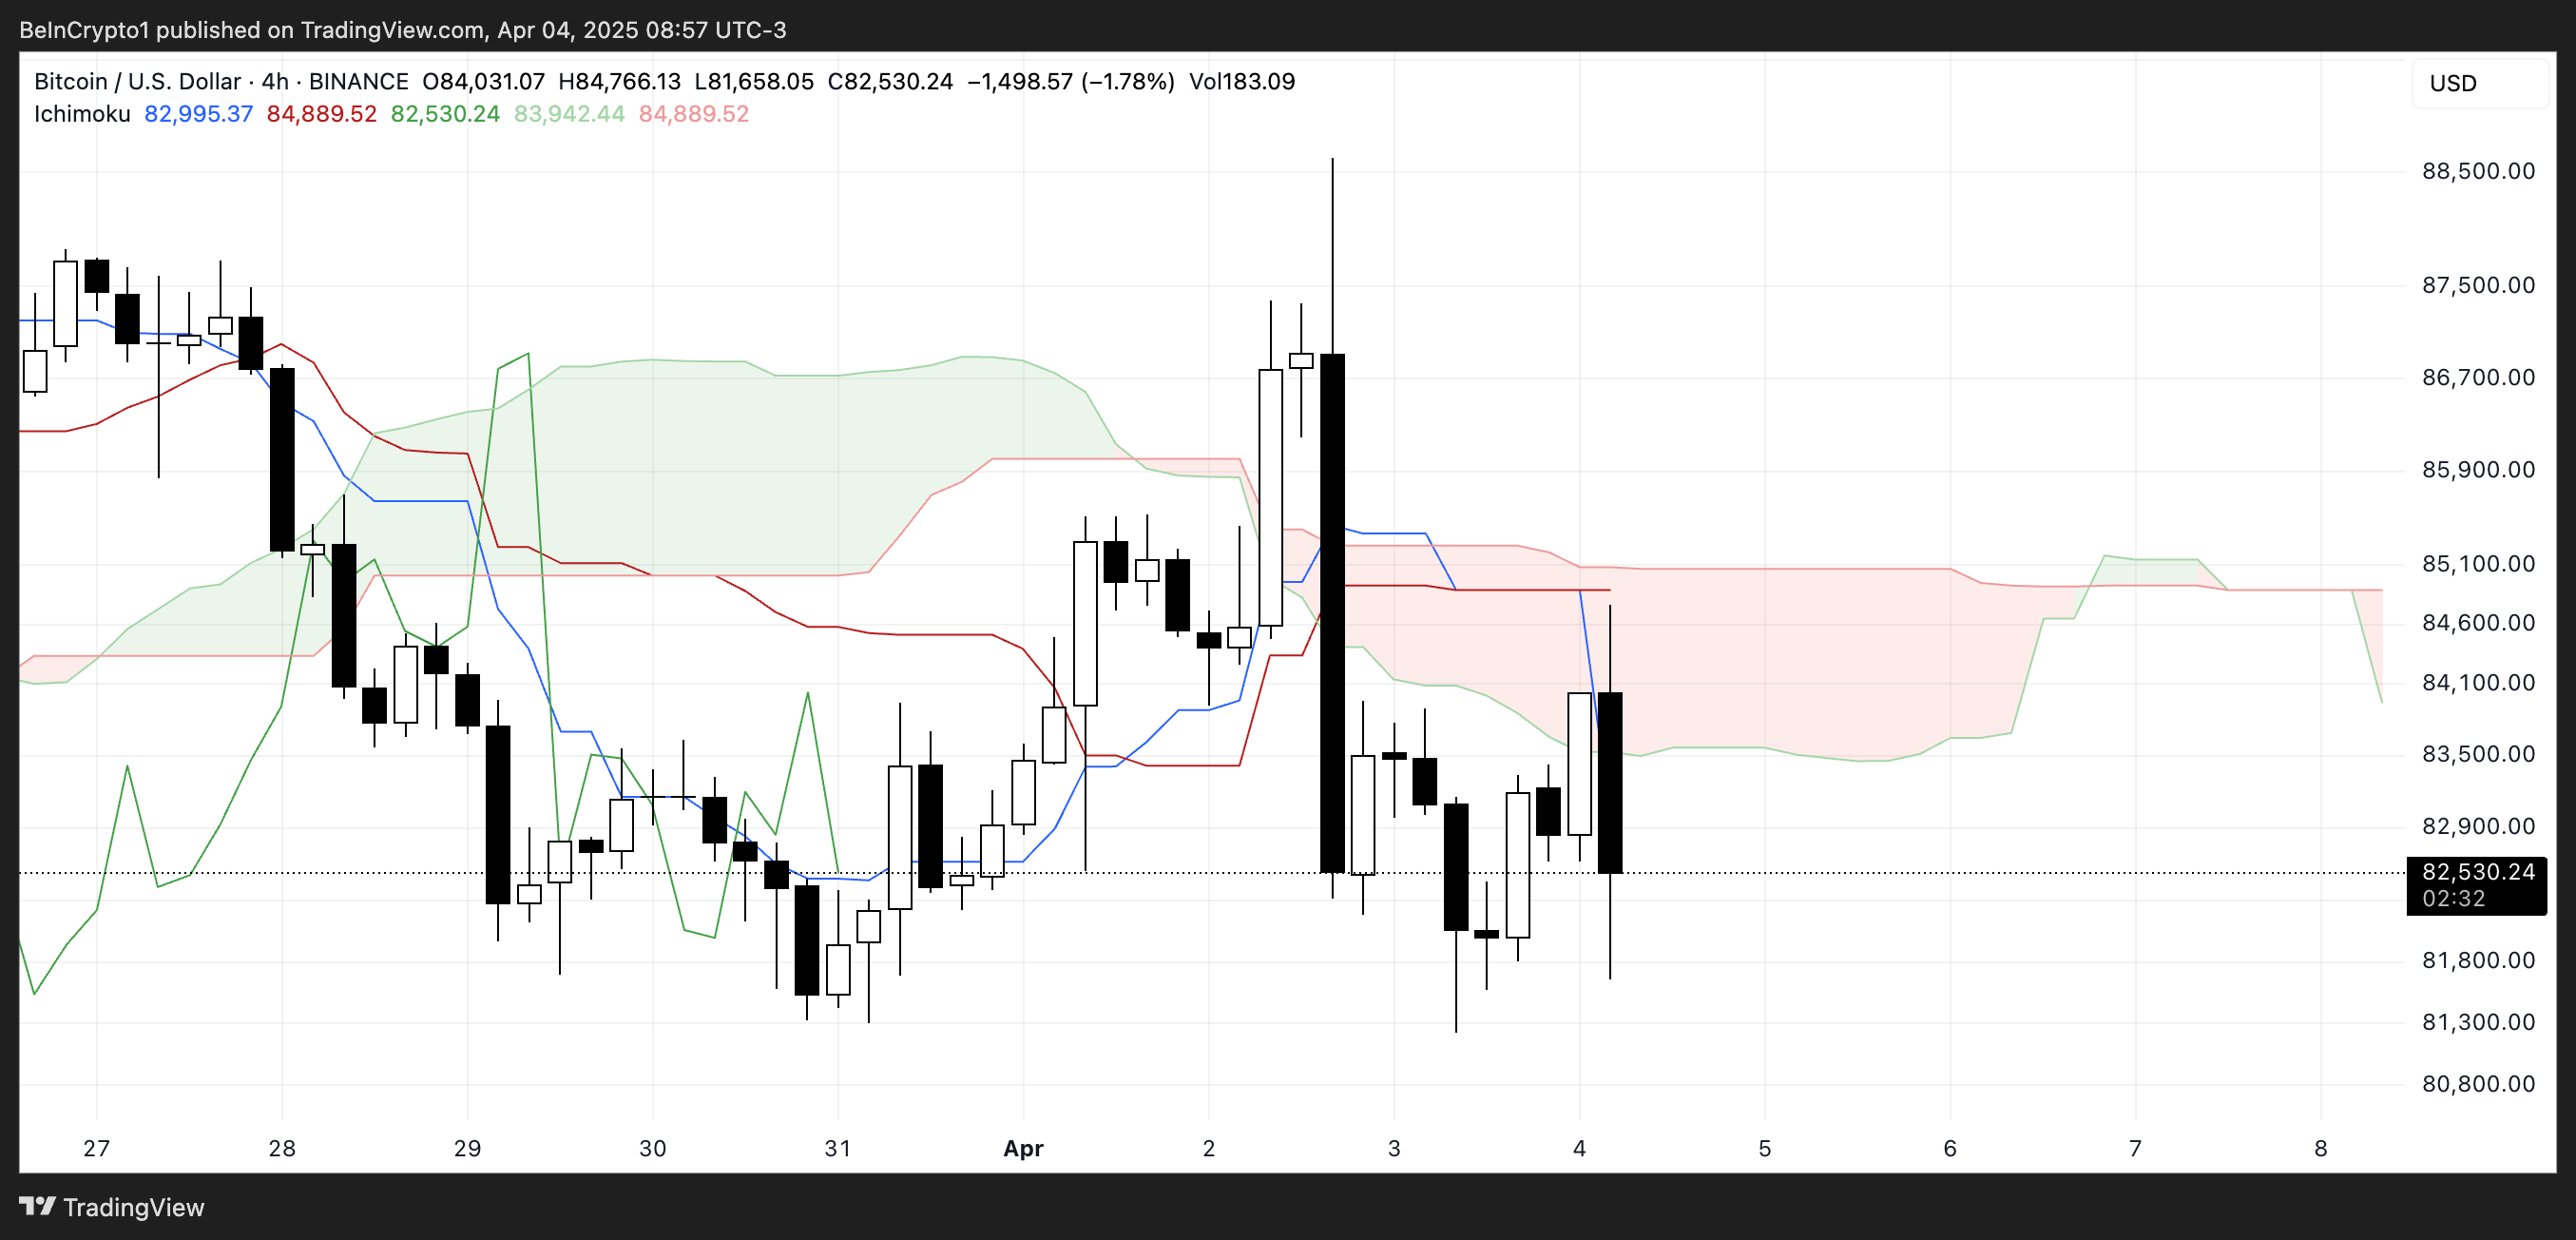
This type of thin, flat cloud suggests indecision in the market and a lack of strong trending momentum. The price hovering just below the cloud further reinforces the idea that BTC is in a consolidation phase rather than a clear trend.
If the price can break back above the cloud and maintain that level, it could signal renewed bullish strength.
However, continued rejection at the cloud and pressure from the falling Tenkan-sen could keep BTC in a corrective or sideways structure. For now, the Ichimoku setup reflects uncertainty, with no dominant trend confirmed in either direction.
Will Bitcoin Rise Back To $88,000 In April?
Bitcoin’s EMA structure still leans bearish overall, with longer-term EMAs positioned above the shorter-term ones. However, the recent upward movement in the short-term EMAs suggests that a rebound could be forming.
If this short-term strength develops into a sustained move, Bitcoin could first test the resistance at $85,103. A successful break above this level may signal a shift in momentum, opening the door to higher targets at $87,489. Recently, Standard Chartered predicted that BTC is likely to break $88,500 this weekend.
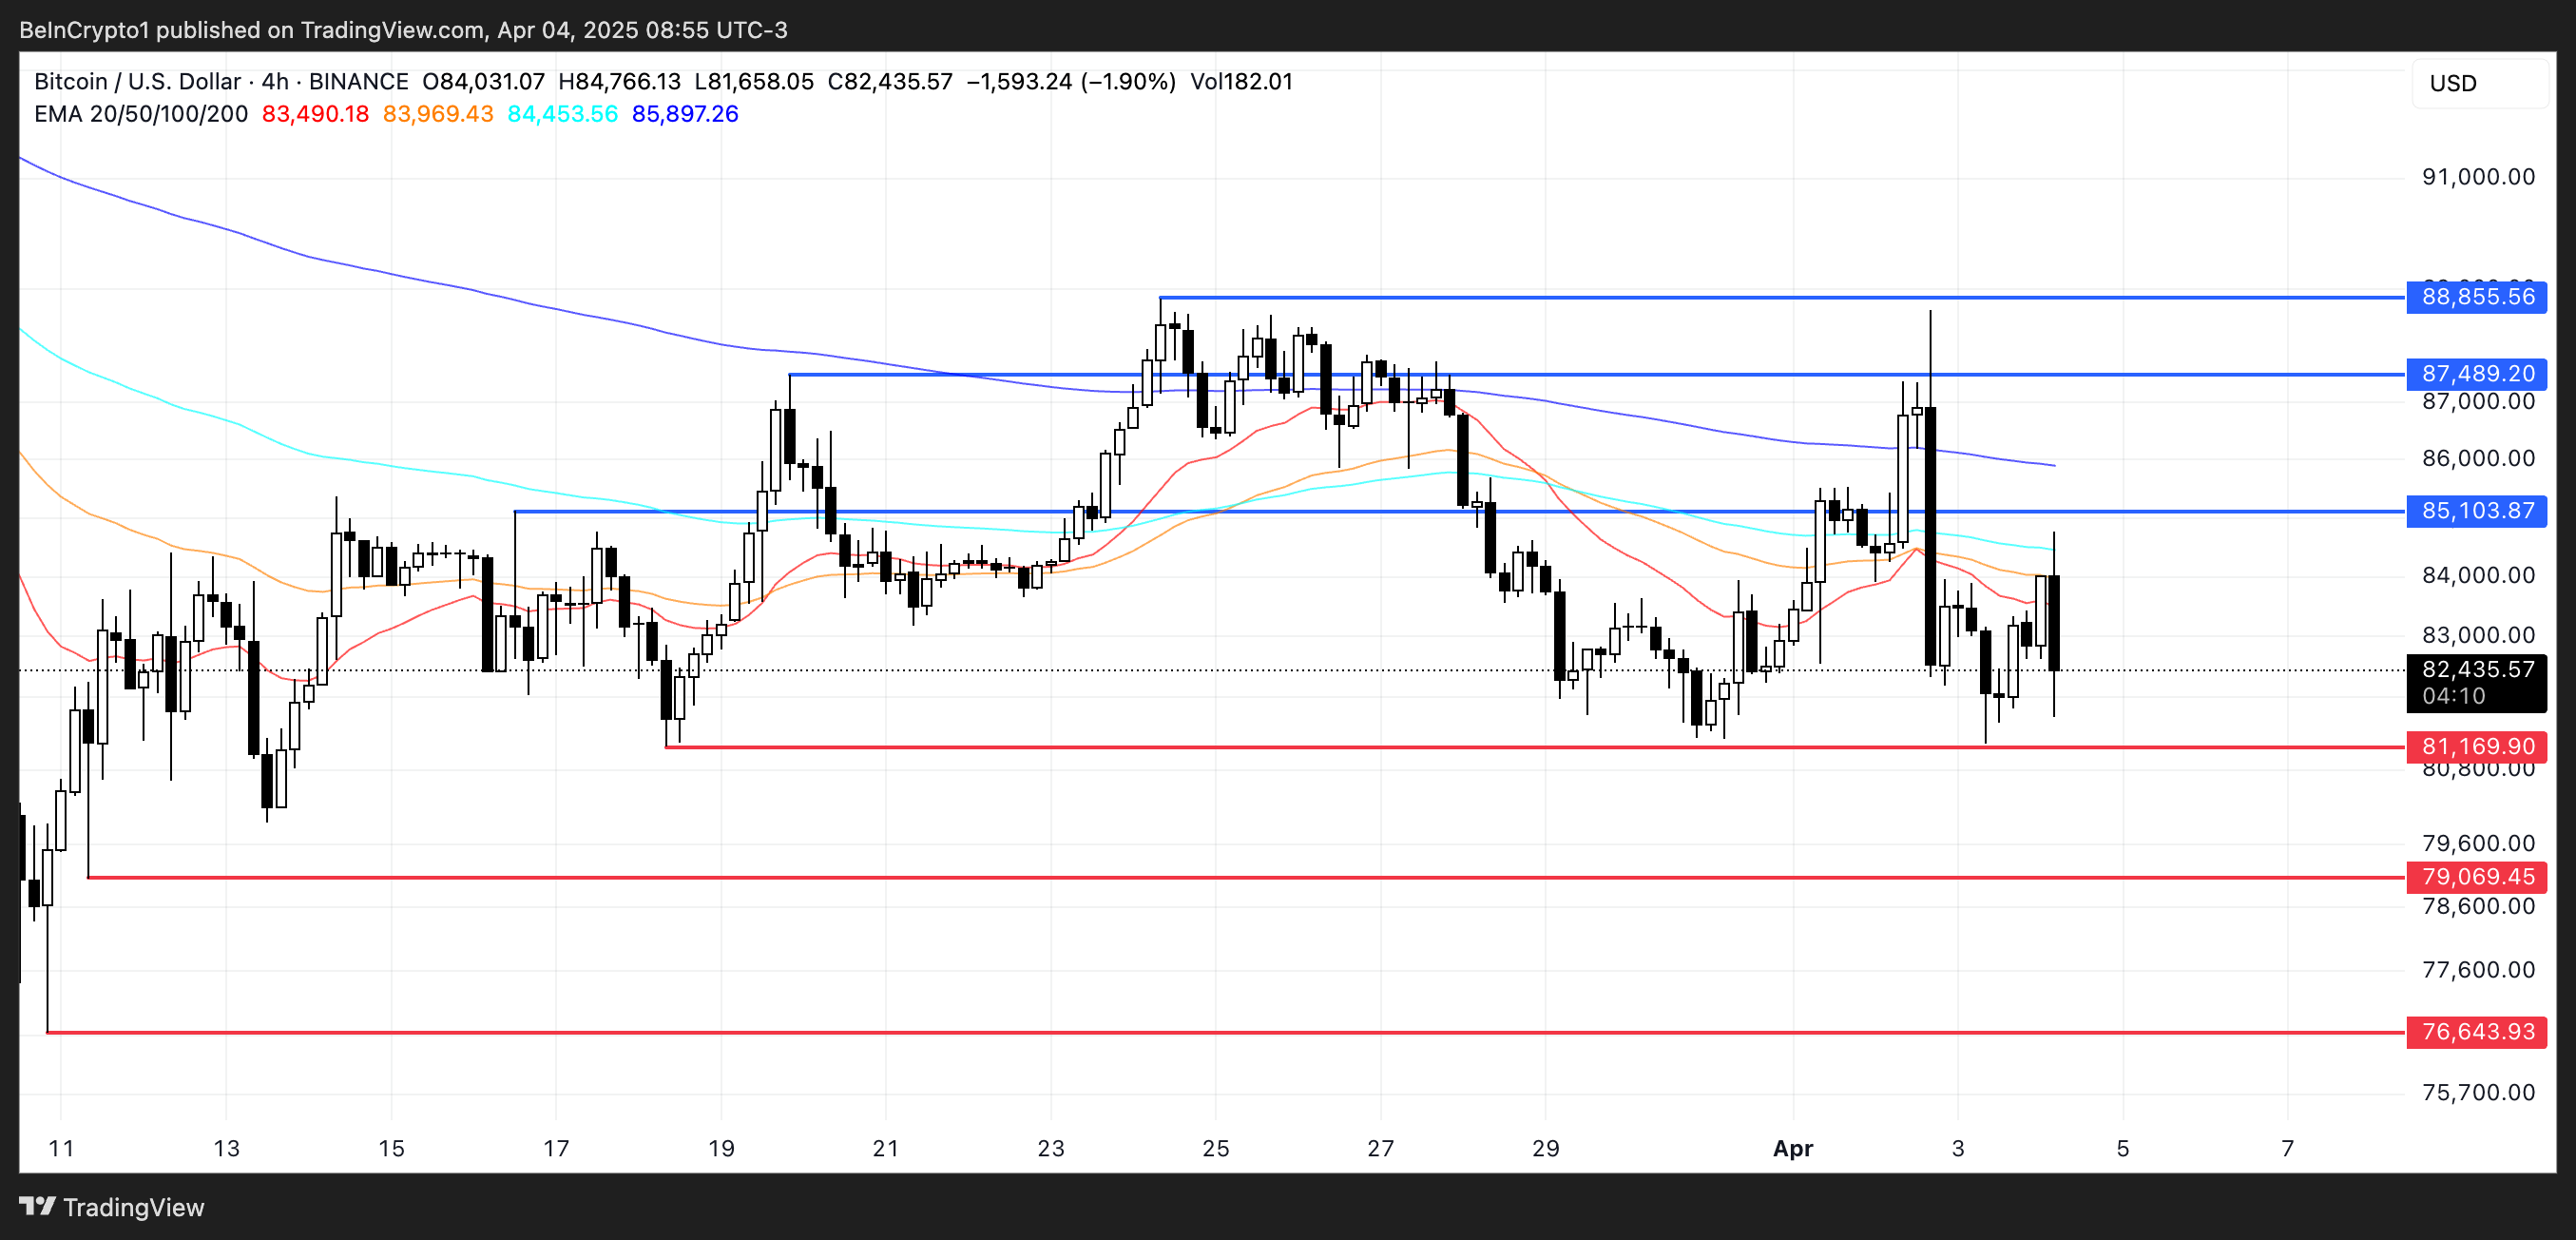
If bullish pressure remains strong beyond that point, Bitcoin price could push even further to challenge $88,855, a level that would mark a more convincing recovery from the recent pullback.
“(…) After Wednesday’s volatility, BTC has rebounded more than 4% and remains firmly above $79,000, with a key support level forming at $80,000 and slightly higher daily exchange volumes, which is a positive sign. On top of this, Bitcoin ETF flows suggest sentiment remains strong, with $220 million inflows on “Tariff Day”, April 2.,” Nic Puckrin, crypto analyst, investor, and founder of The Coin Bureau, told BeInCrypto.
However, if Bitcoin fails to build enough momentum for this rebound, downside risks remain. The first key level to watch is the support at $81,169.
As the trade war between China and the US escalates, a drop below this level could see BTC falling under the psychological $80,000 mark, with the next target around $79,069. If this zone is also lost, the bearish trend could intensify, sending BTC further down toward $76,643.
Disclaimer
In line with the Trust Project guidelines, this price analysis article is for informational purposes only and should not be considered financial or investment advice. BeInCrypto is committed to accurate, unbiased reporting, but market conditions are subject to change without notice. Always conduct your own research and consult with a professional before making any financial decisions. Please note that our Terms and Conditions, Privacy Policy, and Disclaimers have been updated.

Ethereum Transaction Fees Hit Lowest Level Since 2020

Pi Network Hits New Low, Then Rallies 36%—What’s Next?

Ethereum Risks 15% Drop If It Doesn’t Reclaim Key Resistance

Bitcoin Hovers Over $80,000 as Whale Activity Drops

Big-Money Traders Buying ETH Dip

Pi Network on Free Fall, 4 Reasons Pi Coin Price Going to $0.1

2.52 Million Altcoins Are Ruining Crypto’s Future

Animoca Brands Valuation Tanks 75% In Two Years, Here’s Why

Crypto exchange BingX hacked for $43 million

Are The Big Players Losing Interest?

Hong Kong’s Securities Association Tips Authorities On Crypto Self-Regulation

Coinbase cbBTC Set to go Live on Solana
2.52 Million Altcoins Are Ruining Crypto’s Future
Animoca Brands Valuation Tanks 75% In Two Years, Here’s Why
Crypto exchange BingX hacked for $43 million
Are The Big Players Losing Interest?
Hong Kong’s Securities Association Tips Authorities On Crypto Self-Regulation
Coinbase cbBTC Set to go Live on Solana
-

 Bitcoin23 hours ago
Bitcoin Drops as China Escalates Trade War With 34% Tariff on US
-

 Market23 hours ago
Bitcoin is Far From a Bear Market But not Altcoins, Analysts Claim
-

 Market21 hours ago
XRP Price Vulnerable To Falling Below $2 After 18% Decline
-

 Bitcoin22 hours ago
Why Bitcoin Is Gaining Appeal Amid Falling US Treasury Yields
-
 Altcoin15 hours ago
Analyst Predicts XRP Price To Reach Double Digits By July 21 Cycle Peak
-

 Market20 hours ago
Will the SEC Approve Grayscale’s Solana ETF?
-

 Ethereum18 hours ago
Ethereum Whales Buy the Dip – Over 130K ETH Added In A Single Day
-

 Bitcoin18 hours ago
Vitalik’s L2 Roadmap, XRP Unlock and More