
Market
Filecoin (FIL) Price Eyes $6: Reasons Behind the Forecast

Despite closing near a weekly low, Filecoin (FIL) exhibits signs of recovery contrary to market sentiment. Trading at $5.38, FIL has lost 16.31% of its value over the past seven days.
From an on-chain standpoint, the token may be unable to revisit its all-time high. However, indicators reveal that a run to a higher price looks feasible.
Filecoin Volume Falls
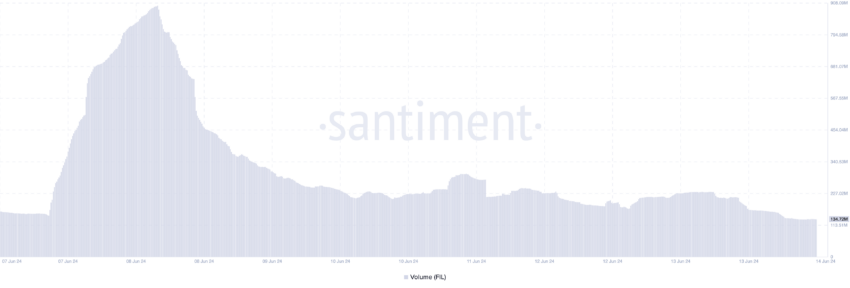
BeInCrypto evaluates Filecoin’s volume. Volume refers to the value of cryptocurrency traded within a given period, including both buying and selling. As of this writing, FIL’s volume was $134.97 million, down from a peak of $899.10 million on June 8.
Typically, rising prices and rising volumes indicate strength for the uptrend. However, a falling price and a declining volume suggest that sellers are getting weak and exhausted. Therefore, a reversal to the upside may be near for FIL.
The technical overview of the token on the daily chart shows that a buy signal may have appeared. This is because of the indications shown by the Tom DeMark (TD) Sequential. The TD Sequential is a technical tool designed to spot trend exhaustion and potential price reversal.
Read more: Filecoin (FIL) Price Prediction 2024/2025/2030
In a bearish setup, the last candle closes lower than the four before. However, a bullish setup appears if the last candlestick closes higher than the previous four, and that was the case with FIL.
FIL Price Prediction:
Furthermore, the Money Flow Index (MFI) gave credence to the forecast. The MFI reading is between 0 and 100. It measures buying and selling pressure and also spots overbought and oversold regions.
When the MFI drops below 20, it means a cryptocurrency is oversold. On the other hand, a reading above 80 means the asset involved is overbought. On June 12, the MFI was in an oversold region, suggesting that liquidity had flown out of the FIL market.
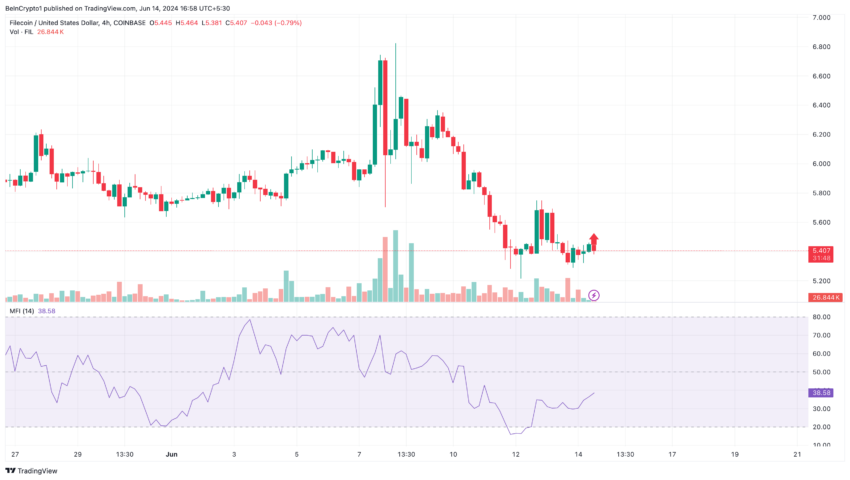
However, as of this writing, the reading has increased. This means that buying pressure is increasing, which may lead to a price increase.
What targets can Filecoin’s price reach? For one, the cryptocurrency’s price may not be near the value it reached in February. However. the Fibonacci Indicator can tell where support and resistance lie, which will help spot possible price levels for FIL in the short term.
If the bullish setup is validated, FIL may produce green candlesticks lasting one to four days. If this happens, the price target will be around $6.07. The Awesome Oscillator (AO) also backed this.
Read more: Filecoin Staking: How To Get Started
The AO shows measures if momentum is increasing or falling. As of this writing, the AO reading shows that Filecoin is exiting the bearish momentum. Should the reading rise to the positive region, the $6 prediction may come to pass.
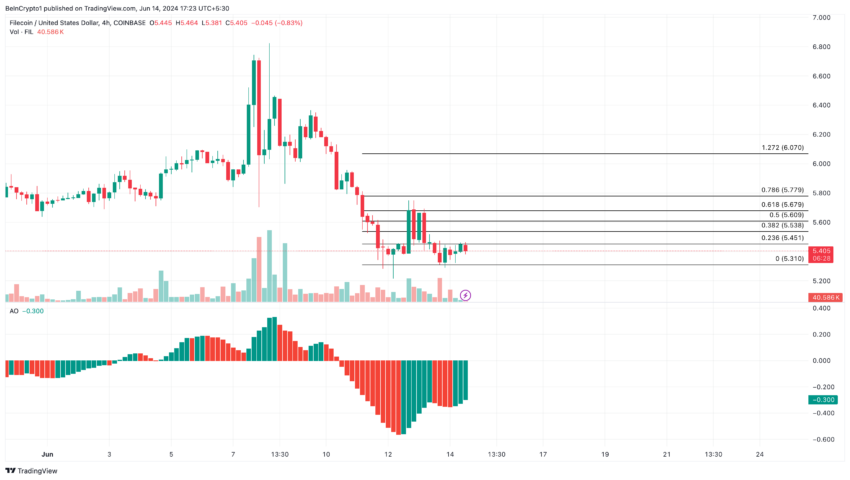
However, traders should watch the $5.77 resistance, where the $0.786 Fibonacci Retracement is. Failure to break through this resistance may invalidate the prediction. As such, FIL may drop to $5.31.
The post Filecoin (FIL) Price Eyes $6: Reasons Behind the Forecast appeared first on BeInCrypto.


Crypto investor Raoul Pal has shared a bullish outlook for Solana (SOL), suggesting the altcoin could see further gains despite recently reaching a new all-time high. His prediction coincides with two new ETF filings featuring SOL, which could increase the cryptocurrency’s demand and visibility in mainstream markets.
For investors, this forecast aligns with Solana’s expanding ecosystem and growth. The key question remains: How high can SOL rise before hitting the ceiling of this bull cycle?
Pal Expects Solana to Continue Climbing
Pal’s comment after SOL’s price climbed above its previous peak of $260. According to the investor, who is also the founder of Real Vision, a crypto education platform, the rally is far from over, suggesting that the recent hike could be the start of another incredible run.
“SOL — been quite the ride so far from the low to new all time highs. Plenty more to go,” Pal shared on X.
Furthermore, this Raoul Pal Solana prediction might not surprise market observers. Since the FTX collapse in 2022, Pal has consistently argued that Solana was undervalued, especially after it plunged to as low as $8.
What makes this forecast even more intriguing is its timing. It coincides with two notable developments in the institutional space: asset management giants VanEck and 21Shares filing for Solana-based ETFs.
These filings signify the growing institutional interest in Solana, potentially driving demand and reinforcing the bullish sentiment around its price potential.
Besides institutional developments, retail investors are also contributing to Solana’s growing momentum. According to Token Terminal, Solana’s monthly active users have seen a significant increase, reaching 134.60 million.
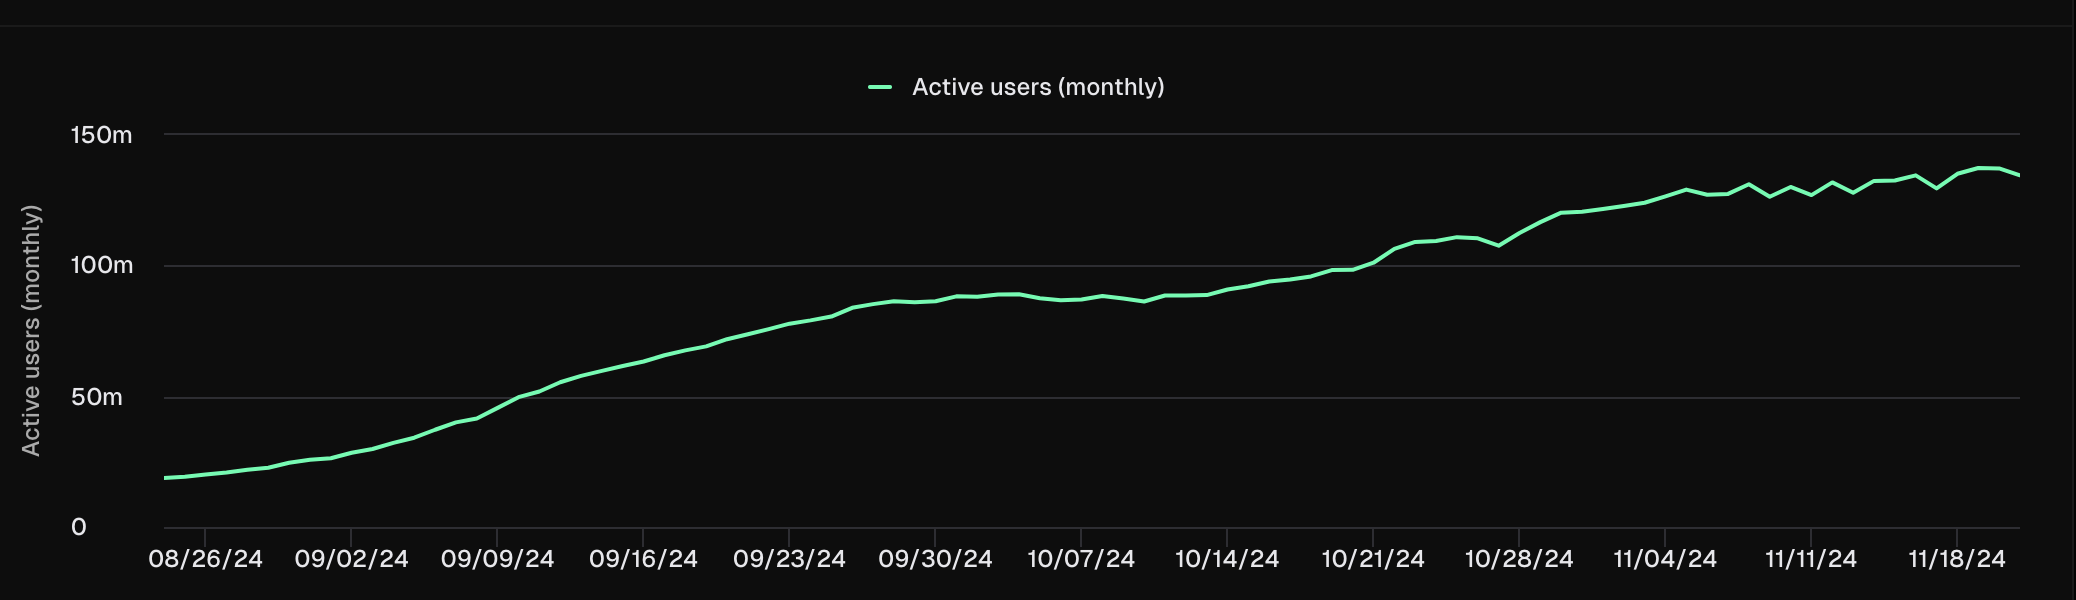
This uptick reflects a rise in the number of addresses actively transacting with SOL, suggesting a broad-based interest in the ecosystem.
Such sustained growth in active users typically suggests healthy network activity and adoption — both of which are bullish indicators for the altcoin’s long-term outlook.
SOL Price Prediction: $300 Looks Feasible
On the daily chart, Solana’s price, currently at $258.81, rallied due to the formation of an inverse head-and-shoulders pattern. An inverse head and shoulders is a bullish chart pattern indicating a potential reversal from a downtrend to an uptrend
Furthermore, a neckline connects the highs of the two troughs and serves as a key resistance level. When the price breaks above this neckline, it confirms the reversal, often accompanied by increased volume.
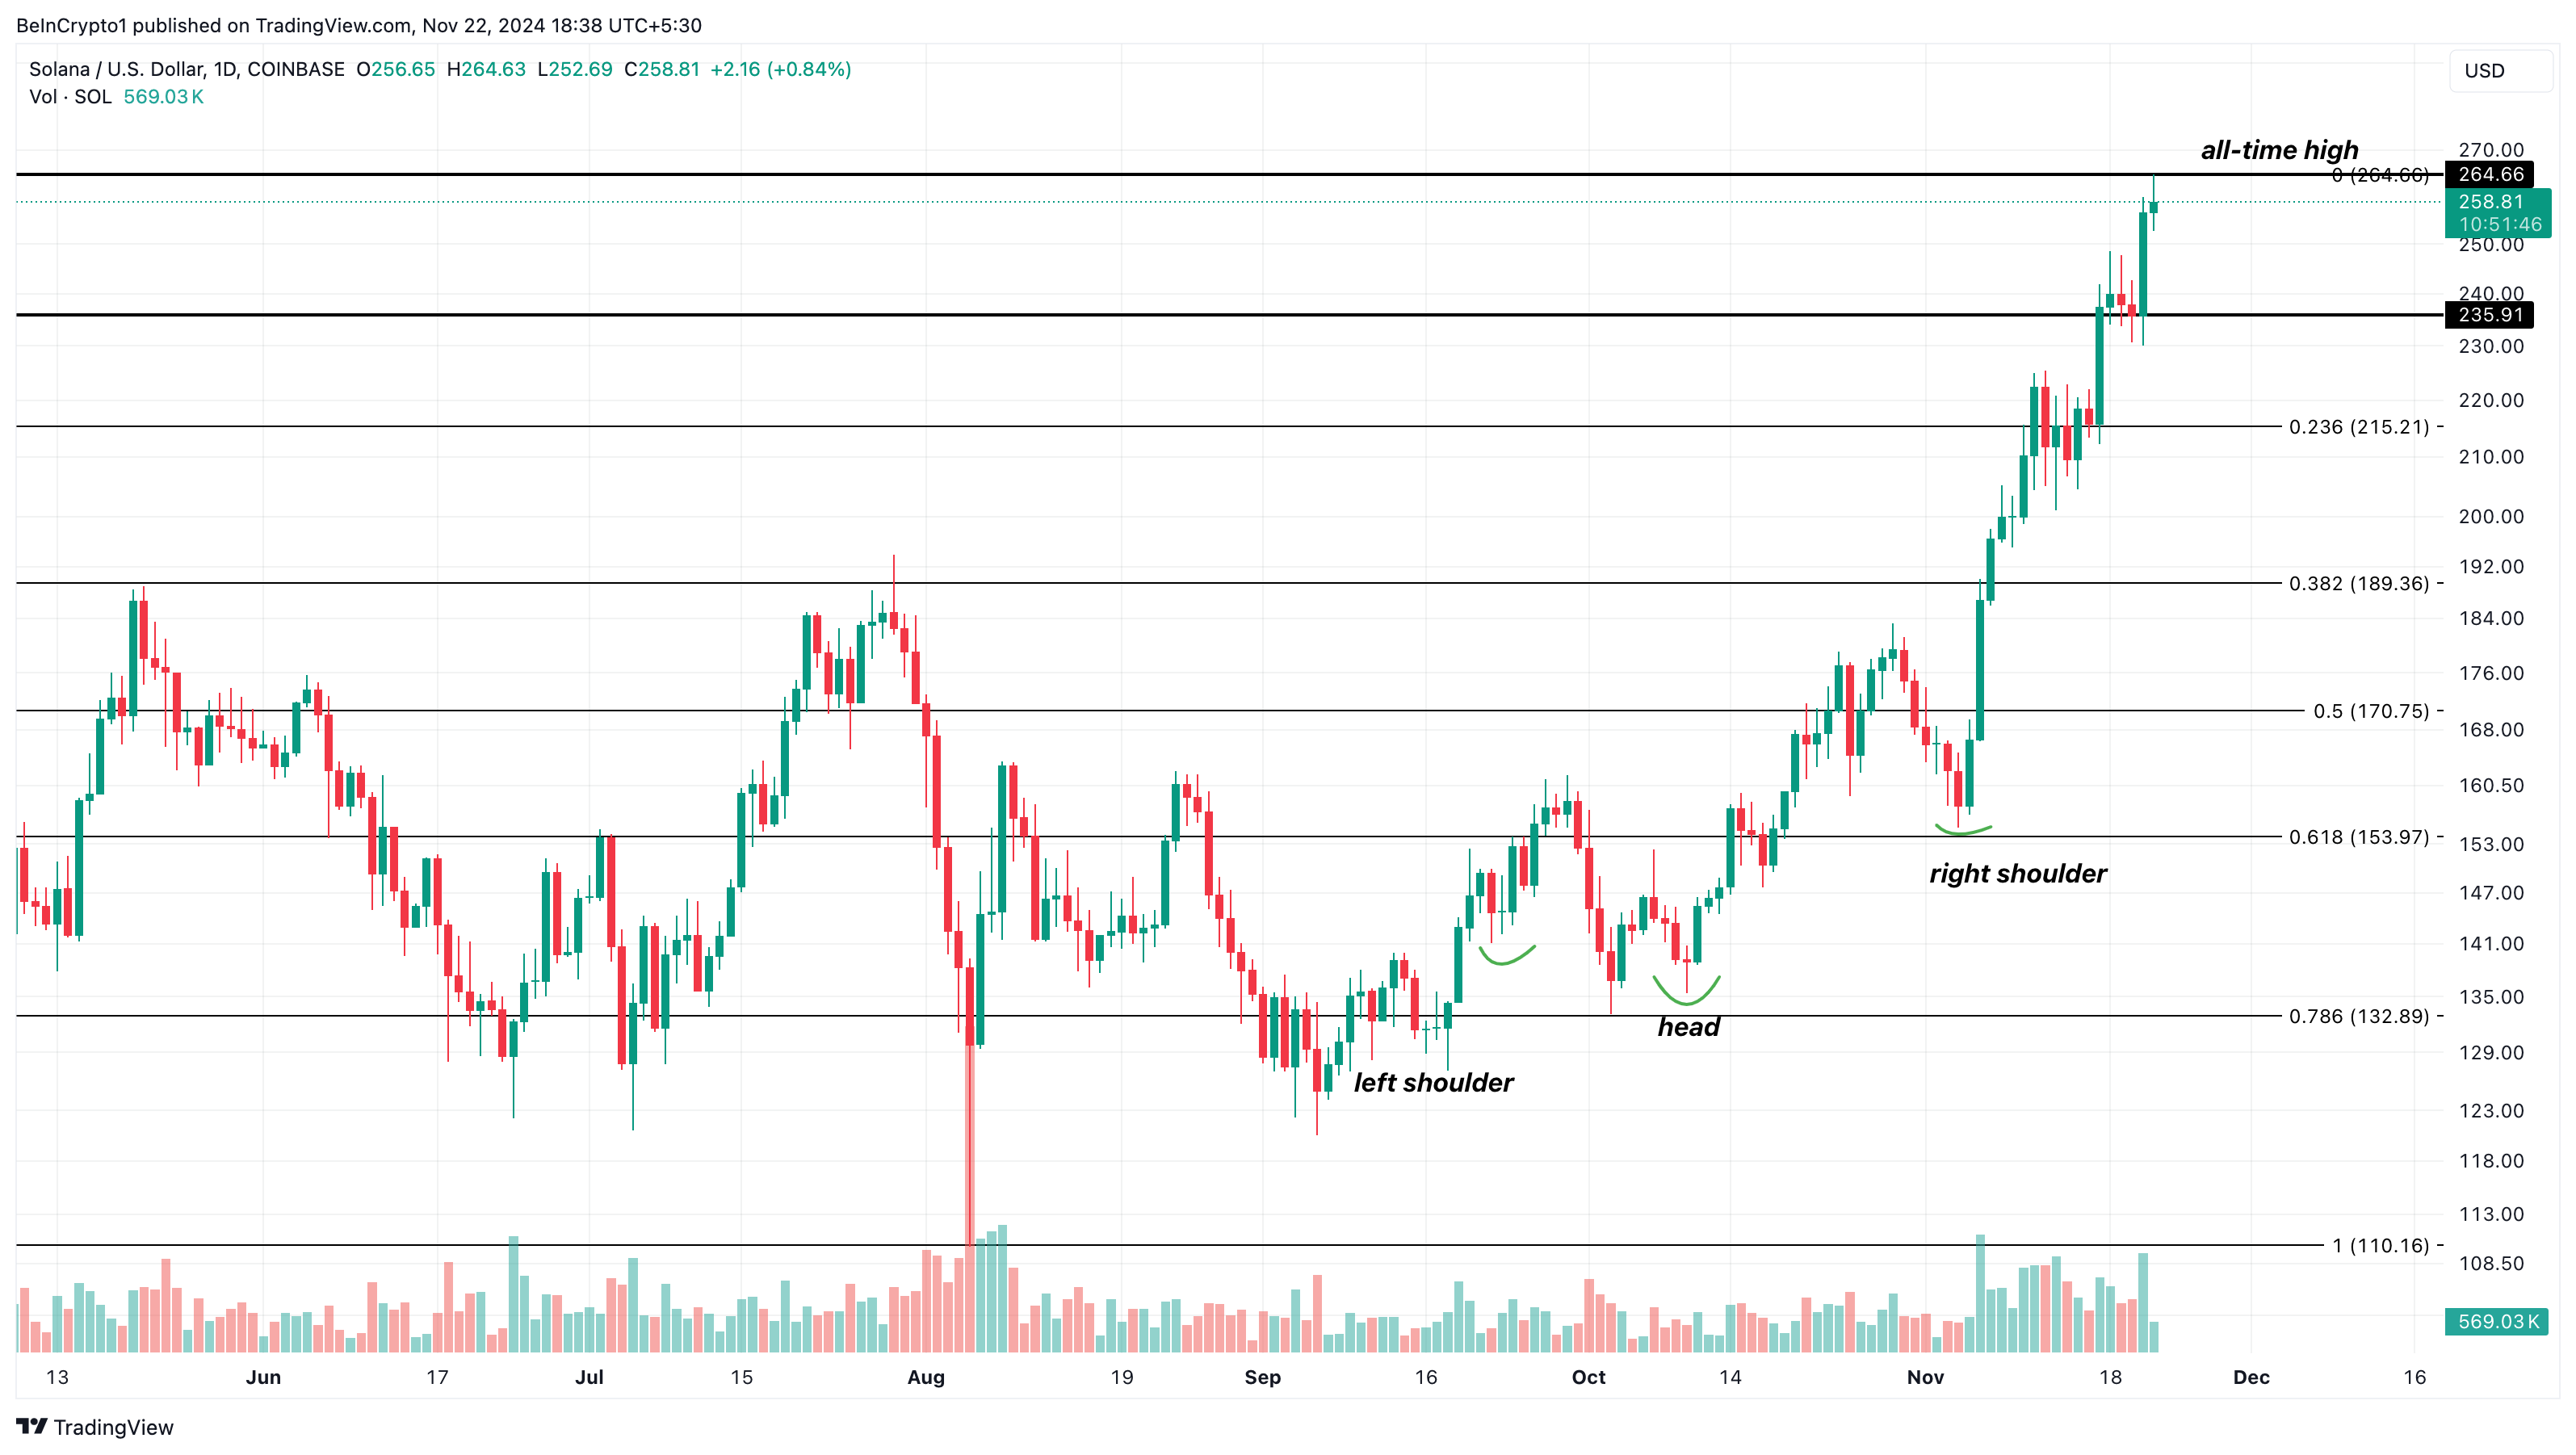
As seen below, SOL’s price has broken out of the pattern. Should buying pressure increase, the altcoin could climb as high as $300 in the short term.
However, a breakdown below the $235.91 support could invalidate the thesis. In that scenario, the cryptocurrency could decline to $215.21.
Disclaimer
In line with the Trust Project guidelines, this price analysis article is for informational purposes only and should not be considered financial or investment advice. BeInCrypto is committed to accurate, unbiased reporting, but market conditions are subject to change without notice. Always conduct your own research and consult with a professional before making any financial decisions. Please note that our Terms and Conditions, Privacy Policy, and Disclaimers have been updated.
Stellar (XLM) price has surged more than 20% in the last 24 hours and is up an impressive 124.86% over the past seven days, reaching $0.30, its highest price since December 2021. This rapid ascent reflects strong bullish momentum, supported by key indicators like RSI, which remains in the overbought zone.
However, the relatively weak CMF suggests that the current trend may not yet have the strength to sustain further gains without renewed capital inflows. Whether XLM can push toward a $10 billion market cap or face a potential correction will depend on how well it holds key support levels in the days ahead.
XLM RSI Is In The Overbought Zone
Stellar RSI is 74.10, rising sharply from below 60 just a day ago. This increase signals strong bullish momentum, pushing XLM into the overbought zone, where RSI values above 70 indicate heightened buying activity.
While an RSI above 70 often suggests that a correction could be on the horizon, it also reflects strong market enthusiasm driving the current uptrend.
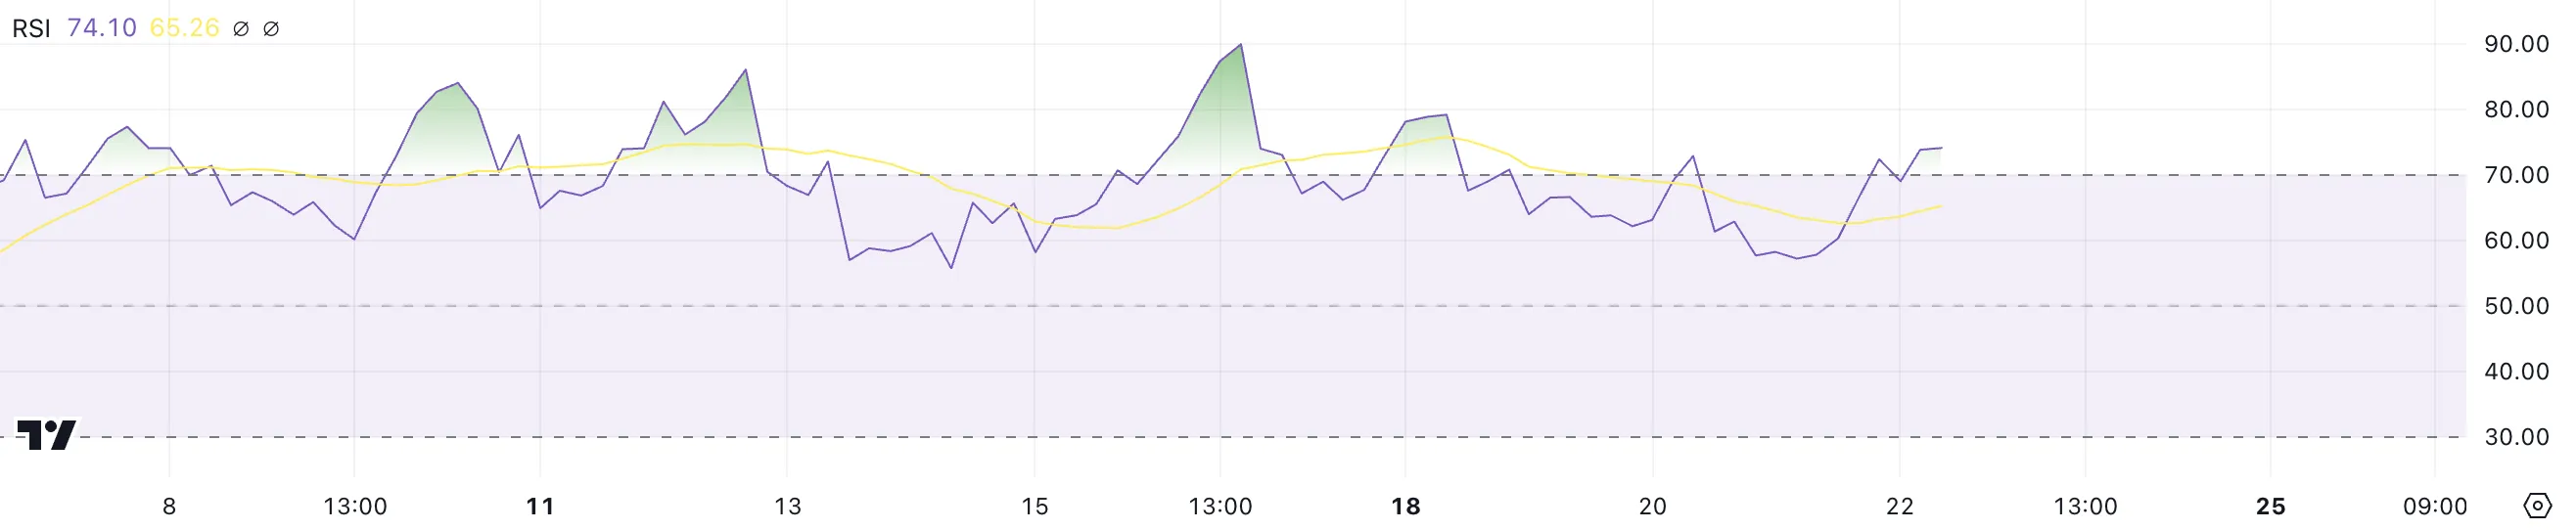
The RSI measures the speed and magnitude of price movements, with values above 70 signaling overbought conditions and below 30 indicating oversold levels. Historically, Stellar has experienced periods where its RSI remained above 70 for several days, during which the price continued to climb before eventually correcting.
This suggests that while caution is warranted, the current overbought conditions do not necessarily mean an immediate reversal, as the rally could still have room to grow before cooling off.
Stellar CMF Is Positive But Not That Strong Yet
XLM currently has a CMF of 0.06, recovering from -0.10 just one day ago. This shift into positive territory indicates an inflow of capital back into the asset, suggesting renewed buying pressure after recent selling activity.
However, the relatively low CMF value highlights that the inflow is not yet as strong as it was during earlier periods of significant bullish momentum.
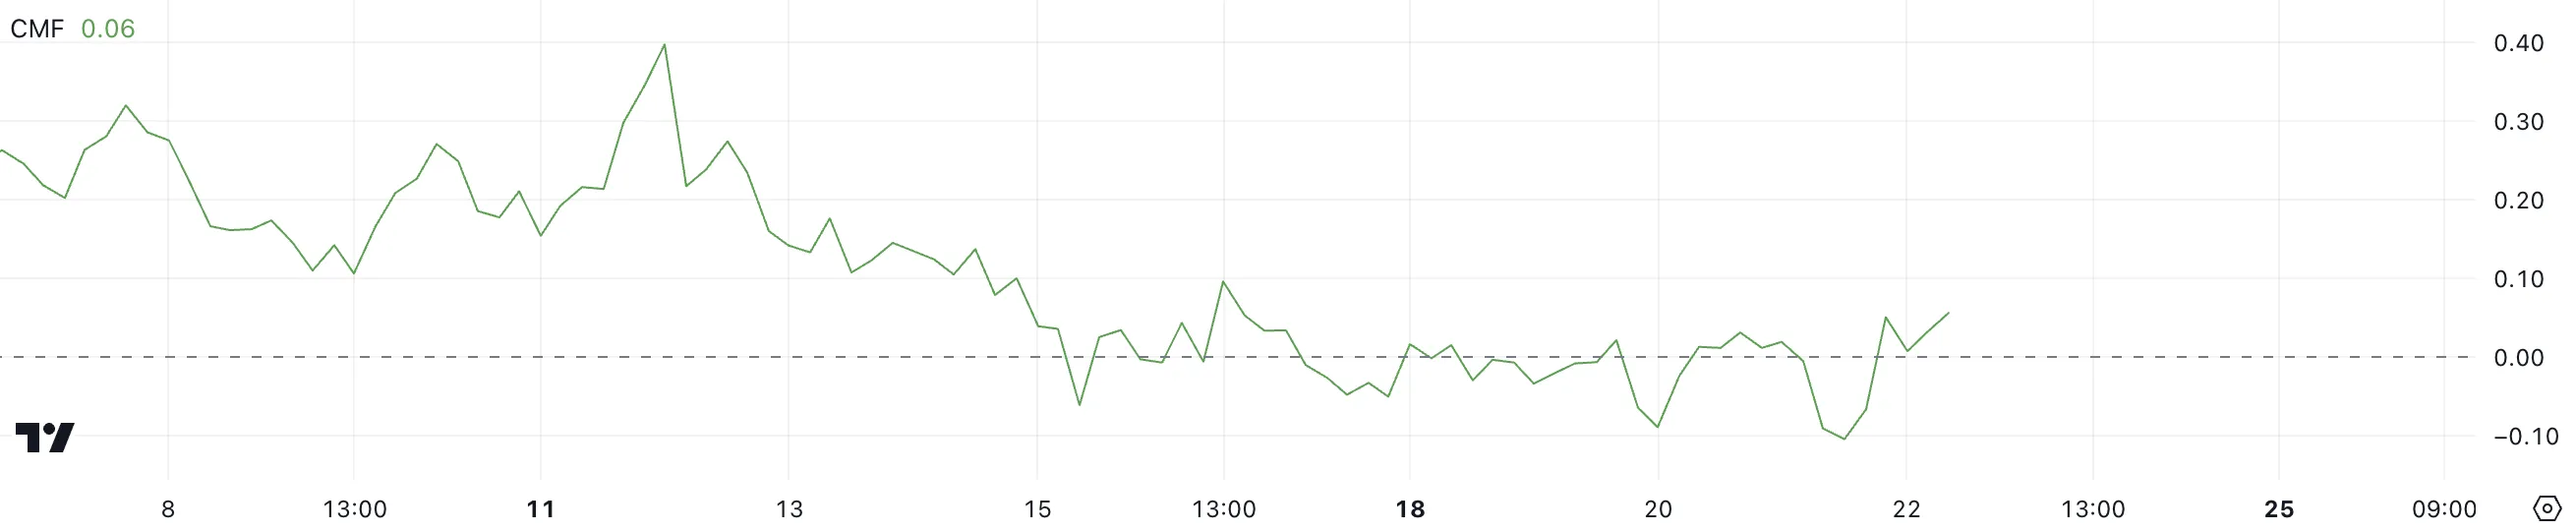
The Chaikin Money Flow (CMF) measures the volume and direction of money flow, with positive values indicating capital inflows (bullish) and negative values reflecting outflows (bearish).
While XLM’s CMF turning positive is a good sign for its short-term trend, it remains far below the levels seen in mid-November when the CMF peaked at 0.40 and stayed above 0.10 for almost a week.
XLM Price Prediction: Can Stellar Reach The $10 Billion Market Cap Threshold?
If Stellar maintains its current uptrend, it could rise further to test a market cap of $10 billion. Achieving this milestone would require a 15.7% increase in XLM price, signaling continued strong bullish momentum and renewed investor interest.
However, as indicated by the relatively weak CMF, the current trend may lack the strength to sustain this upward trajectory.
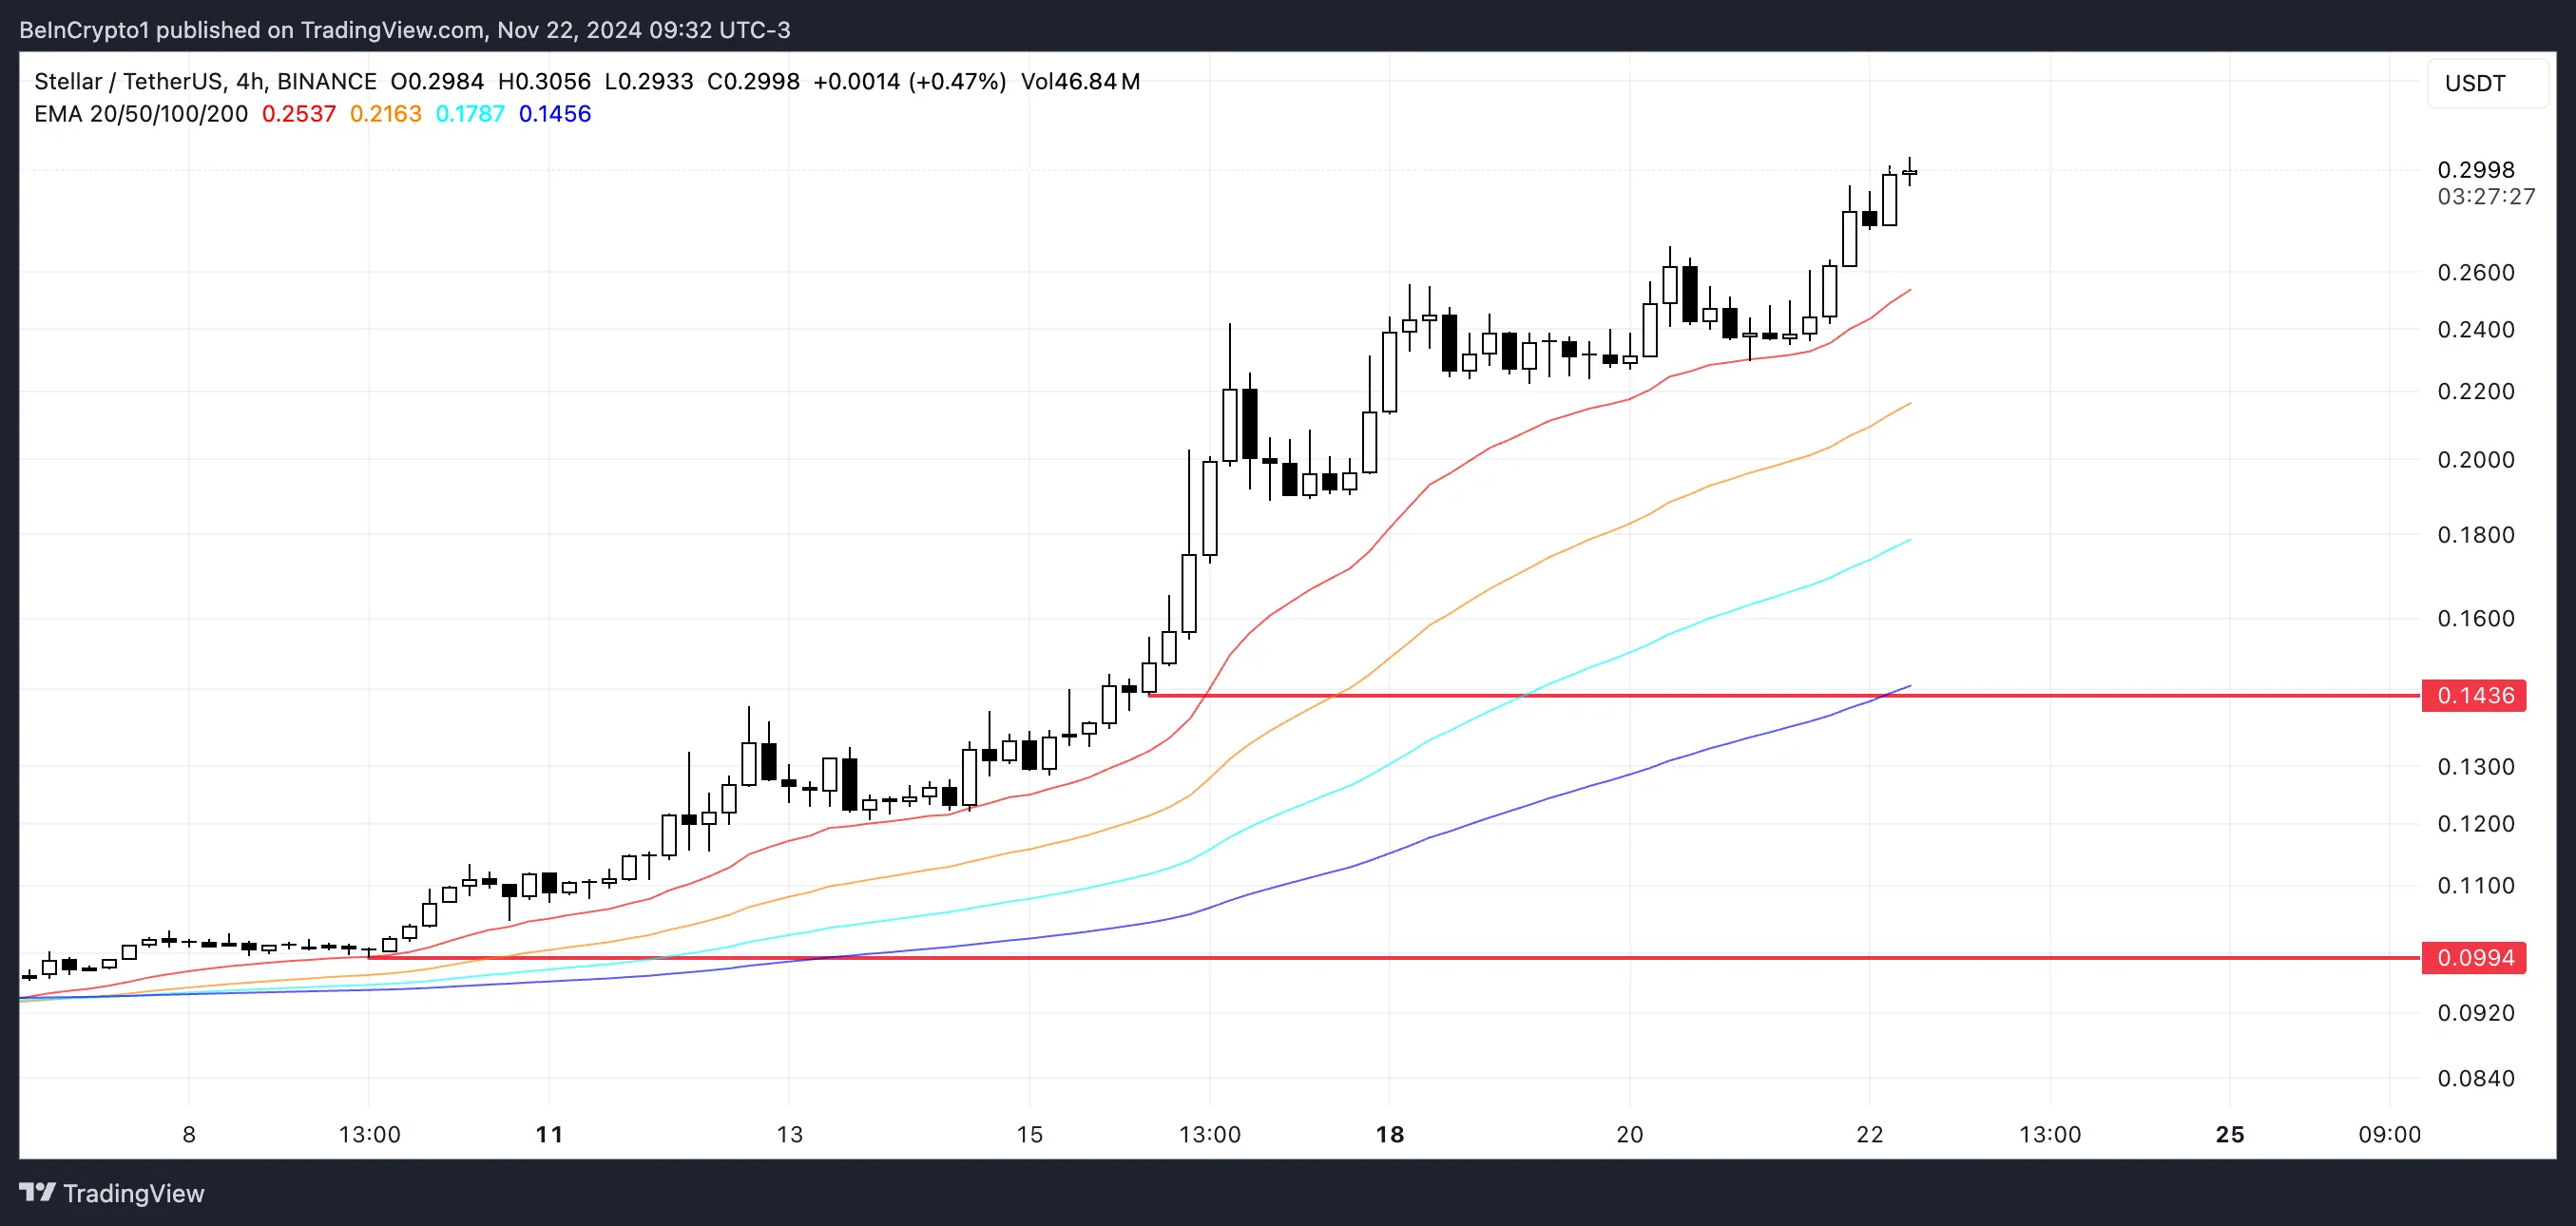
If the trend reverses, XLM price could first test its strongest nearby support at $0.14. Should this level fail, Stellar price could drop further to $0.0994, representing a steep 67% correction from recent highs.
Disclaimer
In line with the Trust Project guidelines, this price analysis article is for informational purposes only and should not be considered financial or investment advice. BeInCrypto is committed to accurate, unbiased reporting, but market conditions are subject to change without notice. Always conduct your own research and consult with a professional before making any financial decisions. Please note that our Terms and Conditions, Privacy Policy, and Disclaimers have been updated.
Some altcoins are setting themselves up to profit from the positive wave as the crypto market prepares for Bitcoin’s possible breakout above the $120,000 mark. Rexas Finance (RXS), SUI, and Solana (SOL) are being hailed by some industry insiders as particularly outstanding performers and ready to go ballistic during the anticipated Bitcoin rally.
Rexas Finance (RXS): The future of real-world asset tokenization
Rexas Finance provides creative ideas for real-world asset (RWA) tokenization. By letting users tokenize real estate, artwork, and other highly valuable assets, Rexas Finance is changing the crypto scene. The initiative has enormous market potential since the real estate sector alone is valued at around $379.7 trillion.
Rexas Finance attracts retail and institutional investors by lowering transaction costs, improving liquidity, and raising transparency. Rexas Finance, in Stage 6 of its presale, has raised $9.5 million with 166 million tokens sold as of writing, indicating 81.74% completion. In this stage, the token price is $0.080; from its initial $0.03 price two months ago, this shows an impressive 166% increase.
It will list on three tier-1 exchanges at $0.20 post-presale, providing a wider global reach and more potential for gains. Rexas Finance recently received a Certik audit, which is a sign of security and trustworthiness in blockchain initiatives, improving investor confidence. Furthermore, its inclusion on CoinGecko and CoinMarketCap improves visibility and accessibility.
The ongoing $1 million giveaway, which offers 20 winners $50,000 in RXS apiece, has piqued investor interest. Based on projections for RXS, price appreciation seems to be strong as adoption rises. Some analysts believe Rexas Finance, with features such as AI integration, DeFi utilities, and yield optimization, could be poised to go ballistic if Bitcoin rallies above $120,000.
SUI: Consistently Hitting new all-time highs
Rising 105% in the past two weeks, SUI is among the top-performing altcoins in the current bull run. As of writing, SUI trades at $3.72, just below its all-time high of $3.94, which it attained last weekend.
Reflecting increased investor demand and confidence, its Open Interest (OI) has lately topped $826 million. The Chaikin Money Flow (CMF) indicator of the token indicates significant inflows, highlighting its positive trend. With a constant tendency to new all-time highs, SUI’s upward trajectory exactly matches market expectations of a possible surge. Driven by its excellent foundations and growing market visibility, SUI is expected to rise sharply if Bitcoin crosses $120,000.
Solana (SOL): Poised for a new all-time high?
Riding a surge of positive momentum, Solana broke past the $240 barrier twice in the current bull run. SOL trading at $246.89 as of writing has increased 59.9% over the past month. With analysts predicting a surge to $600 or more, its market capitalization of $115 billion ranks it among the top four leading cryptocurrencies, recently flipping Binance Coin.
Technical indicators supporting this optimistic view include a declining triangle breakout and a cup-and-handle pattern. Solana-based decentralized exchanges (DEXs), which account for 33.59% of DEX trade activity as of November, support its bullishness even more. So, Solana might see significant inflows if Bitcoin crosses the $120,000 mark, increasing its price to new highs.
Conclusion
Rexas Finance, SUI, and Solana could be ready to go ballistic if Bitcoin surges past $120,000. Each altcoin has unique qualities and solid foundations that guarantee a place of strength in the next positive market phase. Although SUI and Solana present interesting development chances, Rexas Finance distinguishes itself with its innovative RWA tokenizing, unparalleled presale expansion, and rich possibilities.
For more information about Rexas Finance (RXS) visit the links below:
Website: https://rexas.com
Win $1 Million Giveaway: https://bit.ly/Rexas1M
Whitepaper: https://rexas.com/rexas-whitepaper.pdf
Twitter/X: https://x.com/rexasfinance
Telegram: https://t.me/rexasfinance
Deribit To Integrate Ethena USDe As Crypto Margin Collateral

Investors Says Rally Is Not Over

3 Reasons Why Secret Network (SCRT) Price Skyrockets 50% Today
Stellar (XLM) Price Climbs to Three-Year High

Dormant Ethereum Whale Dumps $224M Tokens, Has ETH Price Topped?

3 altcoins that could go ballistic if Bitcoin (BTC) crosses $120,000 mark

2.52 Million Altcoins Are Ruining Crypto’s Future

Animoca Brands Valuation Tanks 75% In Two Years, Here’s Why

Crypto exchange BingX hacked for $43 million

Are The Big Players Losing Interest?

Hong Kong’s Securities Association Tips Authorities On Crypto Self-Regulation

Coinbase cbBTC Set to go Live on Solana
2.52 Million Altcoins Are Ruining Crypto’s Future
Animoca Brands Valuation Tanks 75% In Two Years, Here’s Why
Crypto exchange BingX hacked for $43 million
Are The Big Players Losing Interest?
Hong Kong’s Securities Association Tips Authorities On Crypto Self-Regulation
Coinbase cbBTC Set to go Live on Solana
-

 Bitcoin23 hours ago
Marathon Digital Raises $1B to Expand Bitcoin Holdings
-

 Regulation18 hours ago
UK to unveil crypto and stablecoin regulatory framework early next year
-
 Market23 hours ago
ETH/BTC Ratio Plummets to 42-Month Low Amid Bitcoin Surge
-

 Ethereum21 hours ago
Analyst Reveals When The Ethereum Price Will Reach A New ATH, It’s Closer Than You Think
-

 Market20 hours ago
Why SUI Network Outage Did Not Cause a Price Crash
-
 Market19 hours ago
Cardano (ADA) Price Hits 41% Weekly Growth, $1 Target in Sight
-
 Market17 hours ago
Trump Media Files Trademark for Crypto Platform TruthFi
-
 Altcoin23 hours ago
5 Key Indicators To Watch For Ethereum Price Rally To $10K