
Market
Kaspa (KAS) Price Eyes All-Time High: Key On-Chain Metrics

In a previous analysis, BeInCrypto published a bullish forecast for Kaspa (KAS) when the price was trading at $0.14.
Subsequently, it reached a new all-time high of $0.194. Now trading between $0.16 and $0.17, this analysis serves as an update to the previous price prediction.
Kaspa Price Analysis: Bullish Outlook
KAS has experienced a 14% drawdown following Bitcoin’s price correction from $70,000 to $66,000. This moderate decline saw KAS falling from $0.194 to $0.150 before stabilizing between $0.160 and $0.170.
The price has broken below the key support level of $0.171, which is now a critical resistance level to monitor closely. KAS has tested the baseline support (in red) at $0.151 and $0.155, reinforcing this line as a strong support level.
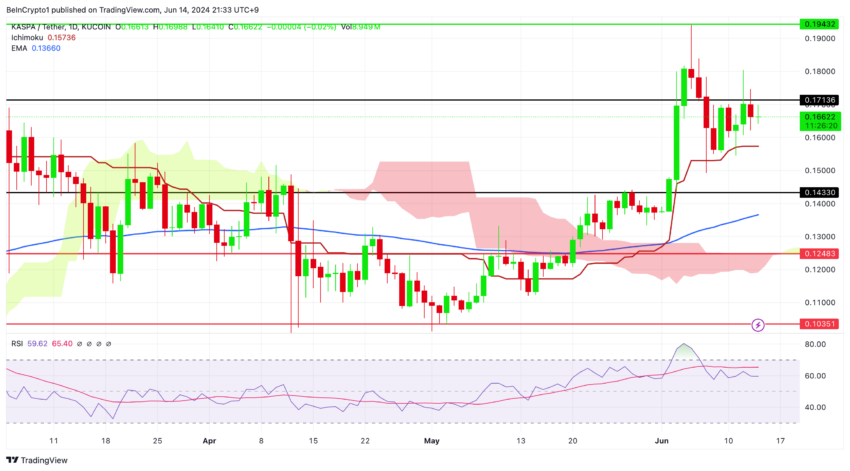
Despite the recent decline, the price outlook for KAS is not bearish. The price remains above the red baseline of the daily Ichimoku Cloud.
Read More: How To Buy KASPA And Everything You Need to Know
The Ichimoku Cloud is a technical analysis tool that displays support and resistance levels, trend direction, and momentum. It consists of multiple lines. The baseline represents the midpoint of the 26-day high and low prices. It is used to determine trend direction and potential support or resistance levels. All the support levels in the analysis are determined by the baseline.
The daily RSI (in violet) is around 60, which indicates the potential for a price drop if it starts to trend towards 50 or 40, underscoring a bearish trend.
An RSI below its 14-day average, shown in pink, could indicate potential for price appreciation. This could happen if KAS breaks above the $0.171 resistance level, potentially reaching new all-time highs.
Short-Term Holders HODLing: $0.20 Target Within Reach
This indicator segments the total circulating supply of Kaspa based on detention time, tracking the behavior of both short-term and long-term holders.
Analyzing the percentage of supply that has remained inactive for more than 3 months is crucial for understanding holding patterns and market sentiment among different holder groups.
The inactive supply metric for more than three months serves as a barometer for short-term holders’ market sentiment when compared to the inactive supply (%) that has been held for more than one year or two years.
A drop in this metric could signal increased risk, while a rise indicates growing demand from new investors.
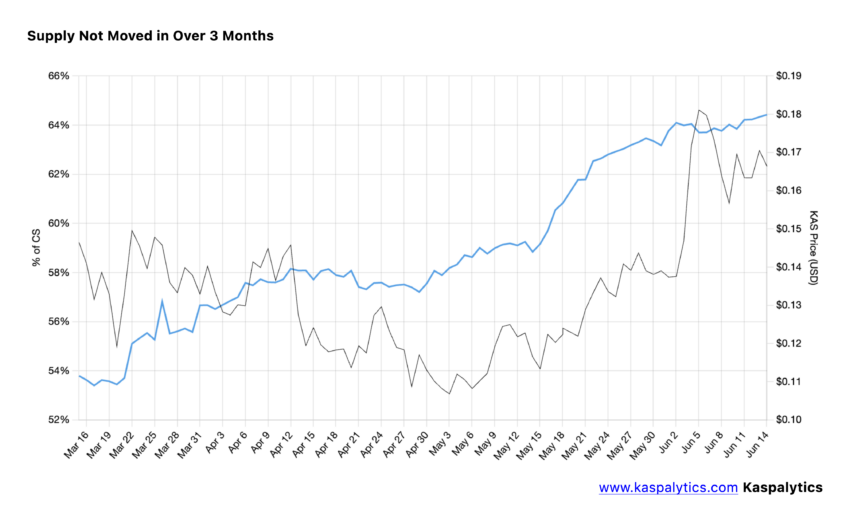
From May to the present, KAS Supply, which has been inactive for more than three months, has increased from 57.18% to 64.43% of the total circulating supply, signifying strong holding behavior from short-term holders.
This strengthens our bullish forecast for Kaspa. We anticipate the price breaking the all-time high and reaching the $0.20 – $0.30 range.
Analyzing the supply that has not been spent for more than one year and more than two years can provide a deeper understanding of Kaspa’s long-term holders’ behavior, especially in the context of recent price declines.
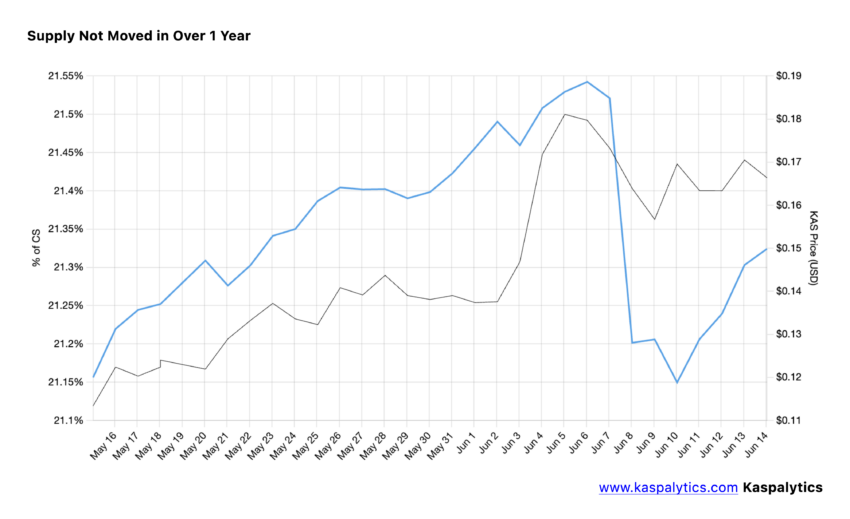
A slight drop from 21.5% to 21.2% of the total circulating supply. This minor decrease suggests some mid-term holders engage in profit-taking or risk management, but the overall holding pattern remains relatively stable.
KAS Price Prediction: $0.20 or $0.14 Next?
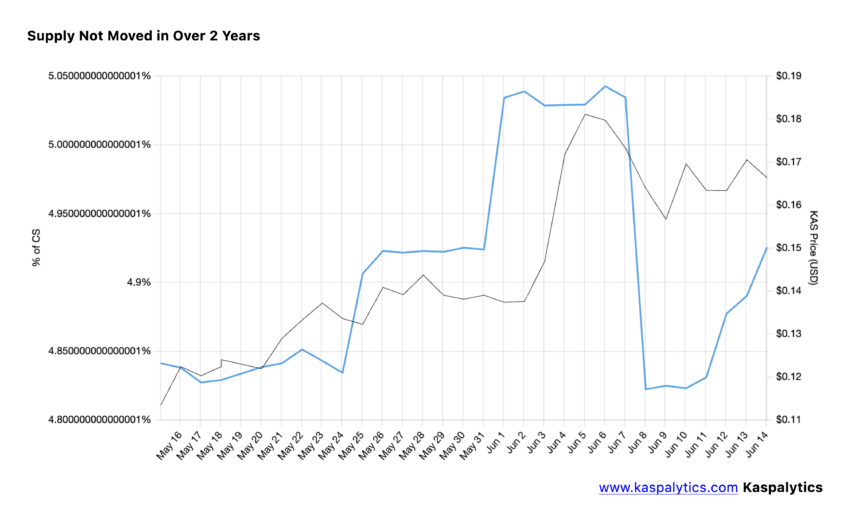
In addition to this, a similar slight drop was observed in the amount of Kaspa that had not been moved for more than two years, indicating profit-taking and risk-mitigation strategies by holders. Specifically, the supply held for over two years decreased from 5% to 4.8% of the total circulating supply, reflecting some level of selling activity among long-term holders.
Read More: Where To Buy Kaspa (KAS): 3 Best Platforms for 2024
The price of KAS has declined following the overall crypto market correction since June 7. Still, it remains resilient above the key support level, which is the Ichimoku baseline.
Should it sustain a break below this line, it could potentially reverse from a bullish to a bearish trend. In such a case, key support levels would be $0.143, $0.124.
Disclaimer
In line with the Trust Project guidelines, this price analysis article is for informational purposes only and should not be considered financial or investment advice. BeInCrypto is committed to accurate, unbiased reporting, but market conditions are subject to change without notice. Always conduct your own research and consult with a professional before making any financial decisions. Please note that our Terms and Conditions, Privacy Policy, and Disclaimers have been updated.


Artificial Intelligence (AI) is now the most dominant narrative in crypto, and some coins are capitalizing on it. TFUEL is nearing a $500 million market cap after an 18% rise in the last seven days, though it remains far below its 2021 peak. ZIG, up 15% in the past week, is closing in on its all-time high, fueled by strong market interest and its growing $200 million market cap.
Meanwhile, AKT, the fifth-largest AI-focused coin, has gained 22% this week and is on the verge of breaking the $1 billion market cap, highlighting its strong momentum and expanding role in decentralized cloud computing.
Theta Fuel (TFUEL)
TFUEL is the coin of Theta Network, a blockchain-powered video streaming platform. Its approach aims to lower streaming costs while improving content quality and expanding distribution reach.
TFUEL has gained 18% in the past seven days and is now approaching the $500 million market cap. Despite this recent growth, the altcoin remains significantly below its 2021 all-time high, sitting at just one-tenth of that peak value. This highlights both its potential for recovery and the challenges it faces in regaining former levels.
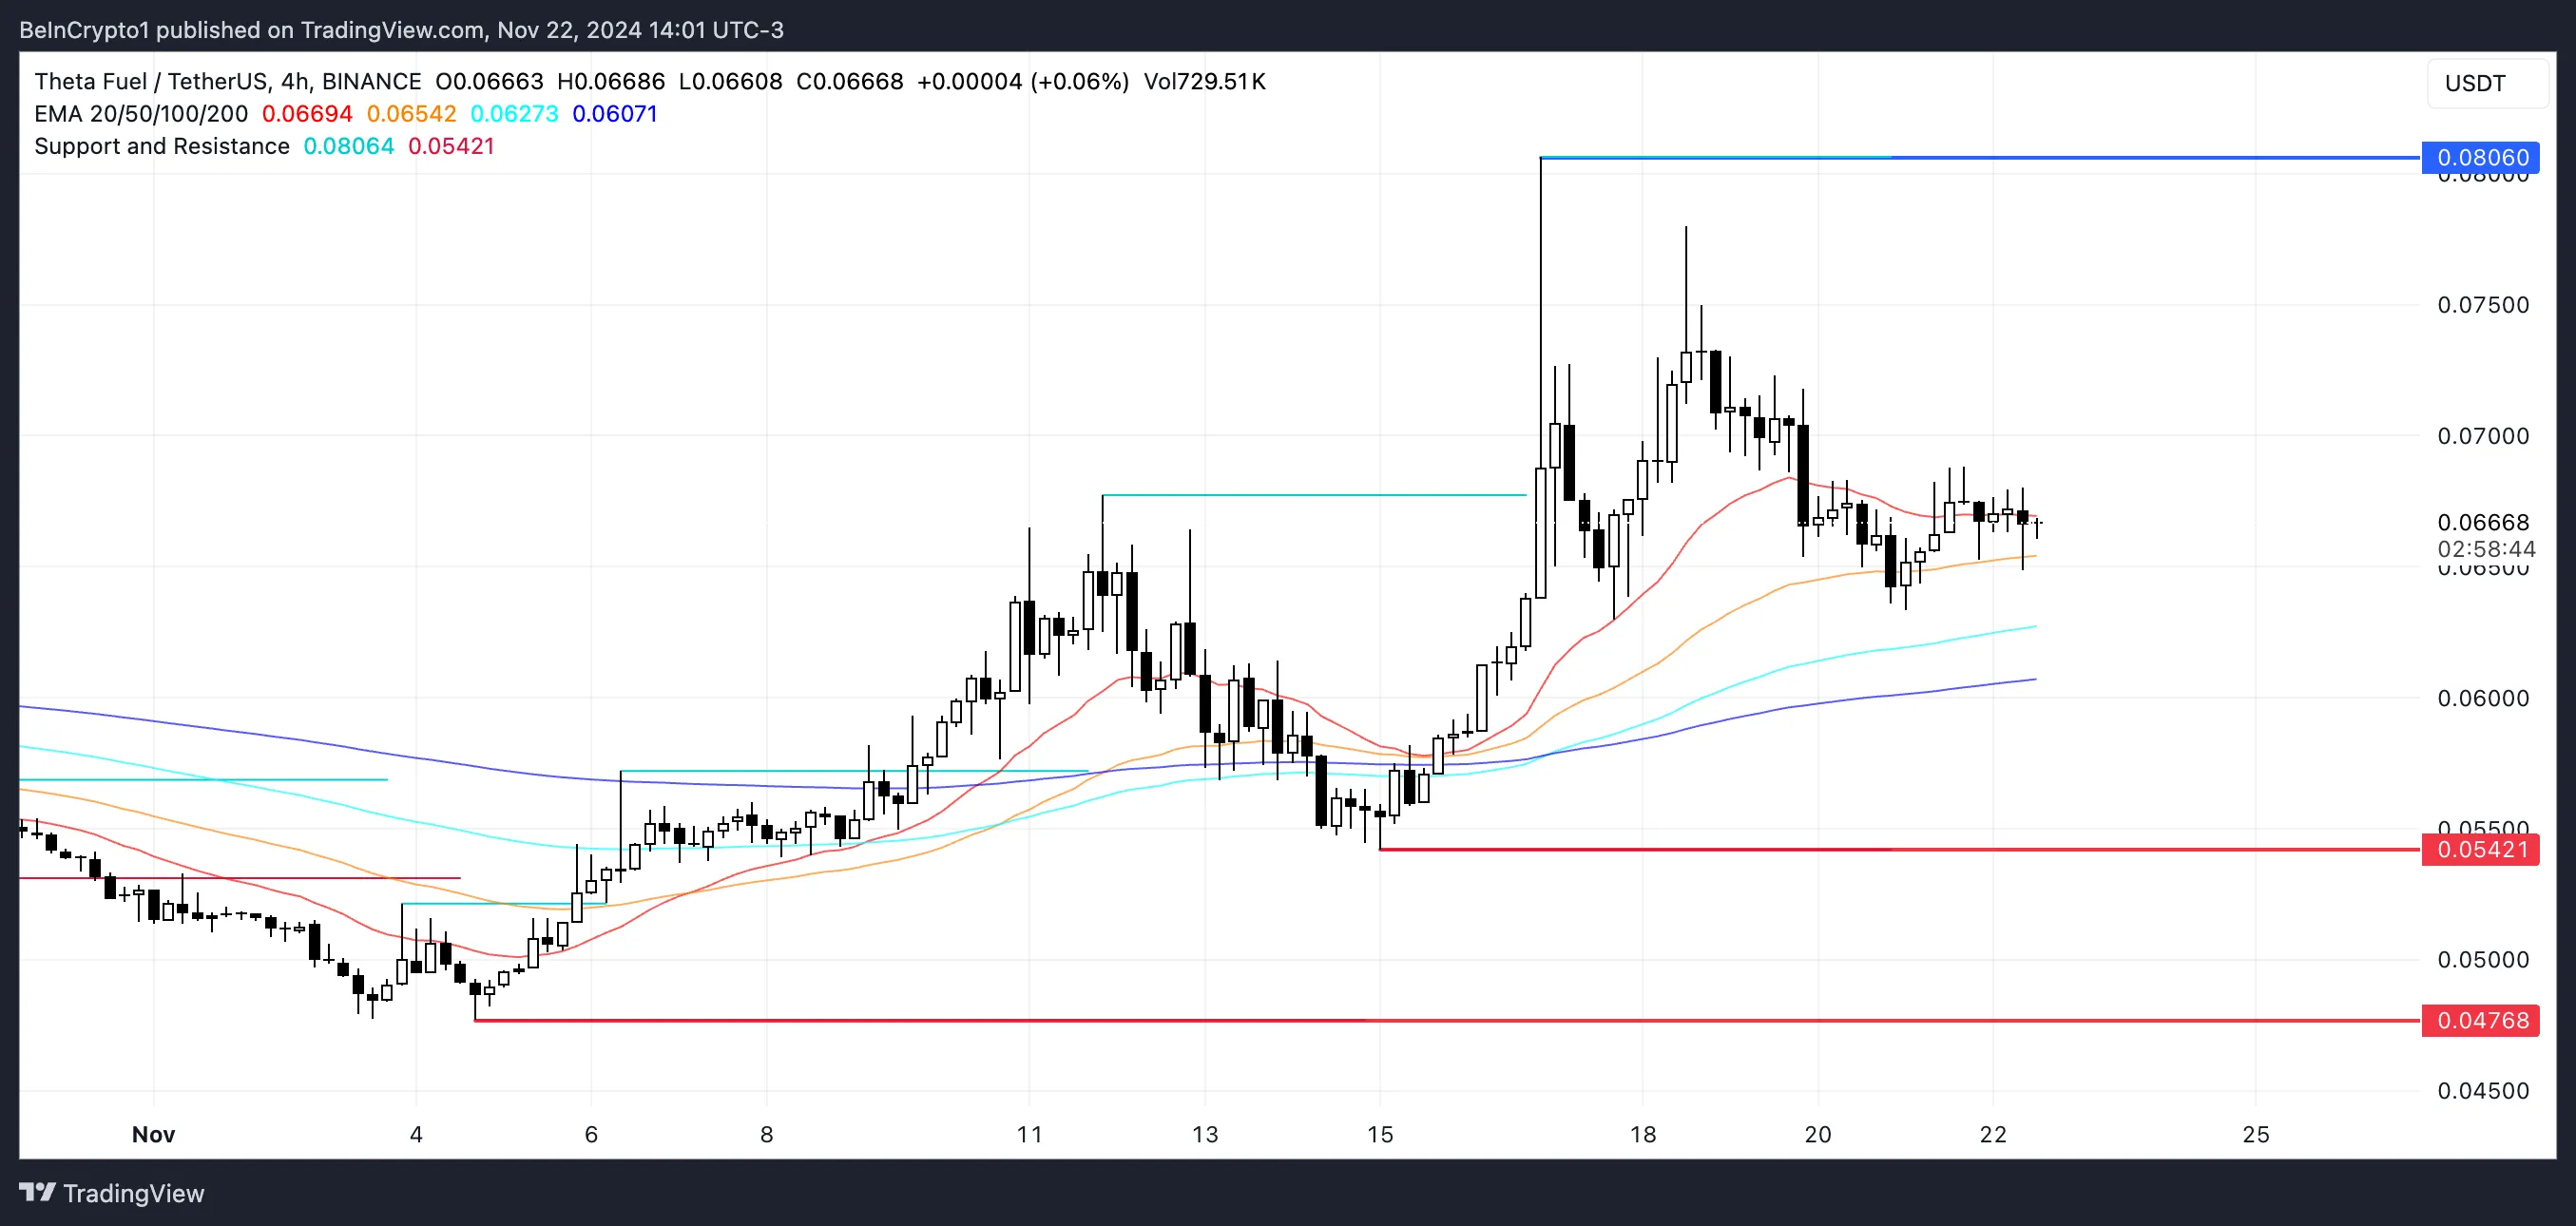
TFUEL’s RSI is currently at 50, indicating neutral momentum where neither buyers nor sellers dominate. If the uptrend gets strong again, it could rise to test $0.080 and potentially reach $0.1. However, if the trend is reverted, it could go down as much as $0.054 or even $0.047.
ZIGDAO (ZIG)
ZIGDAO, formerly known as Zignaly, is a platform designed to enable crypto copy trading with artificial intelligence. It allows users to invest in digital assets by following the strategies of top managers and funds.
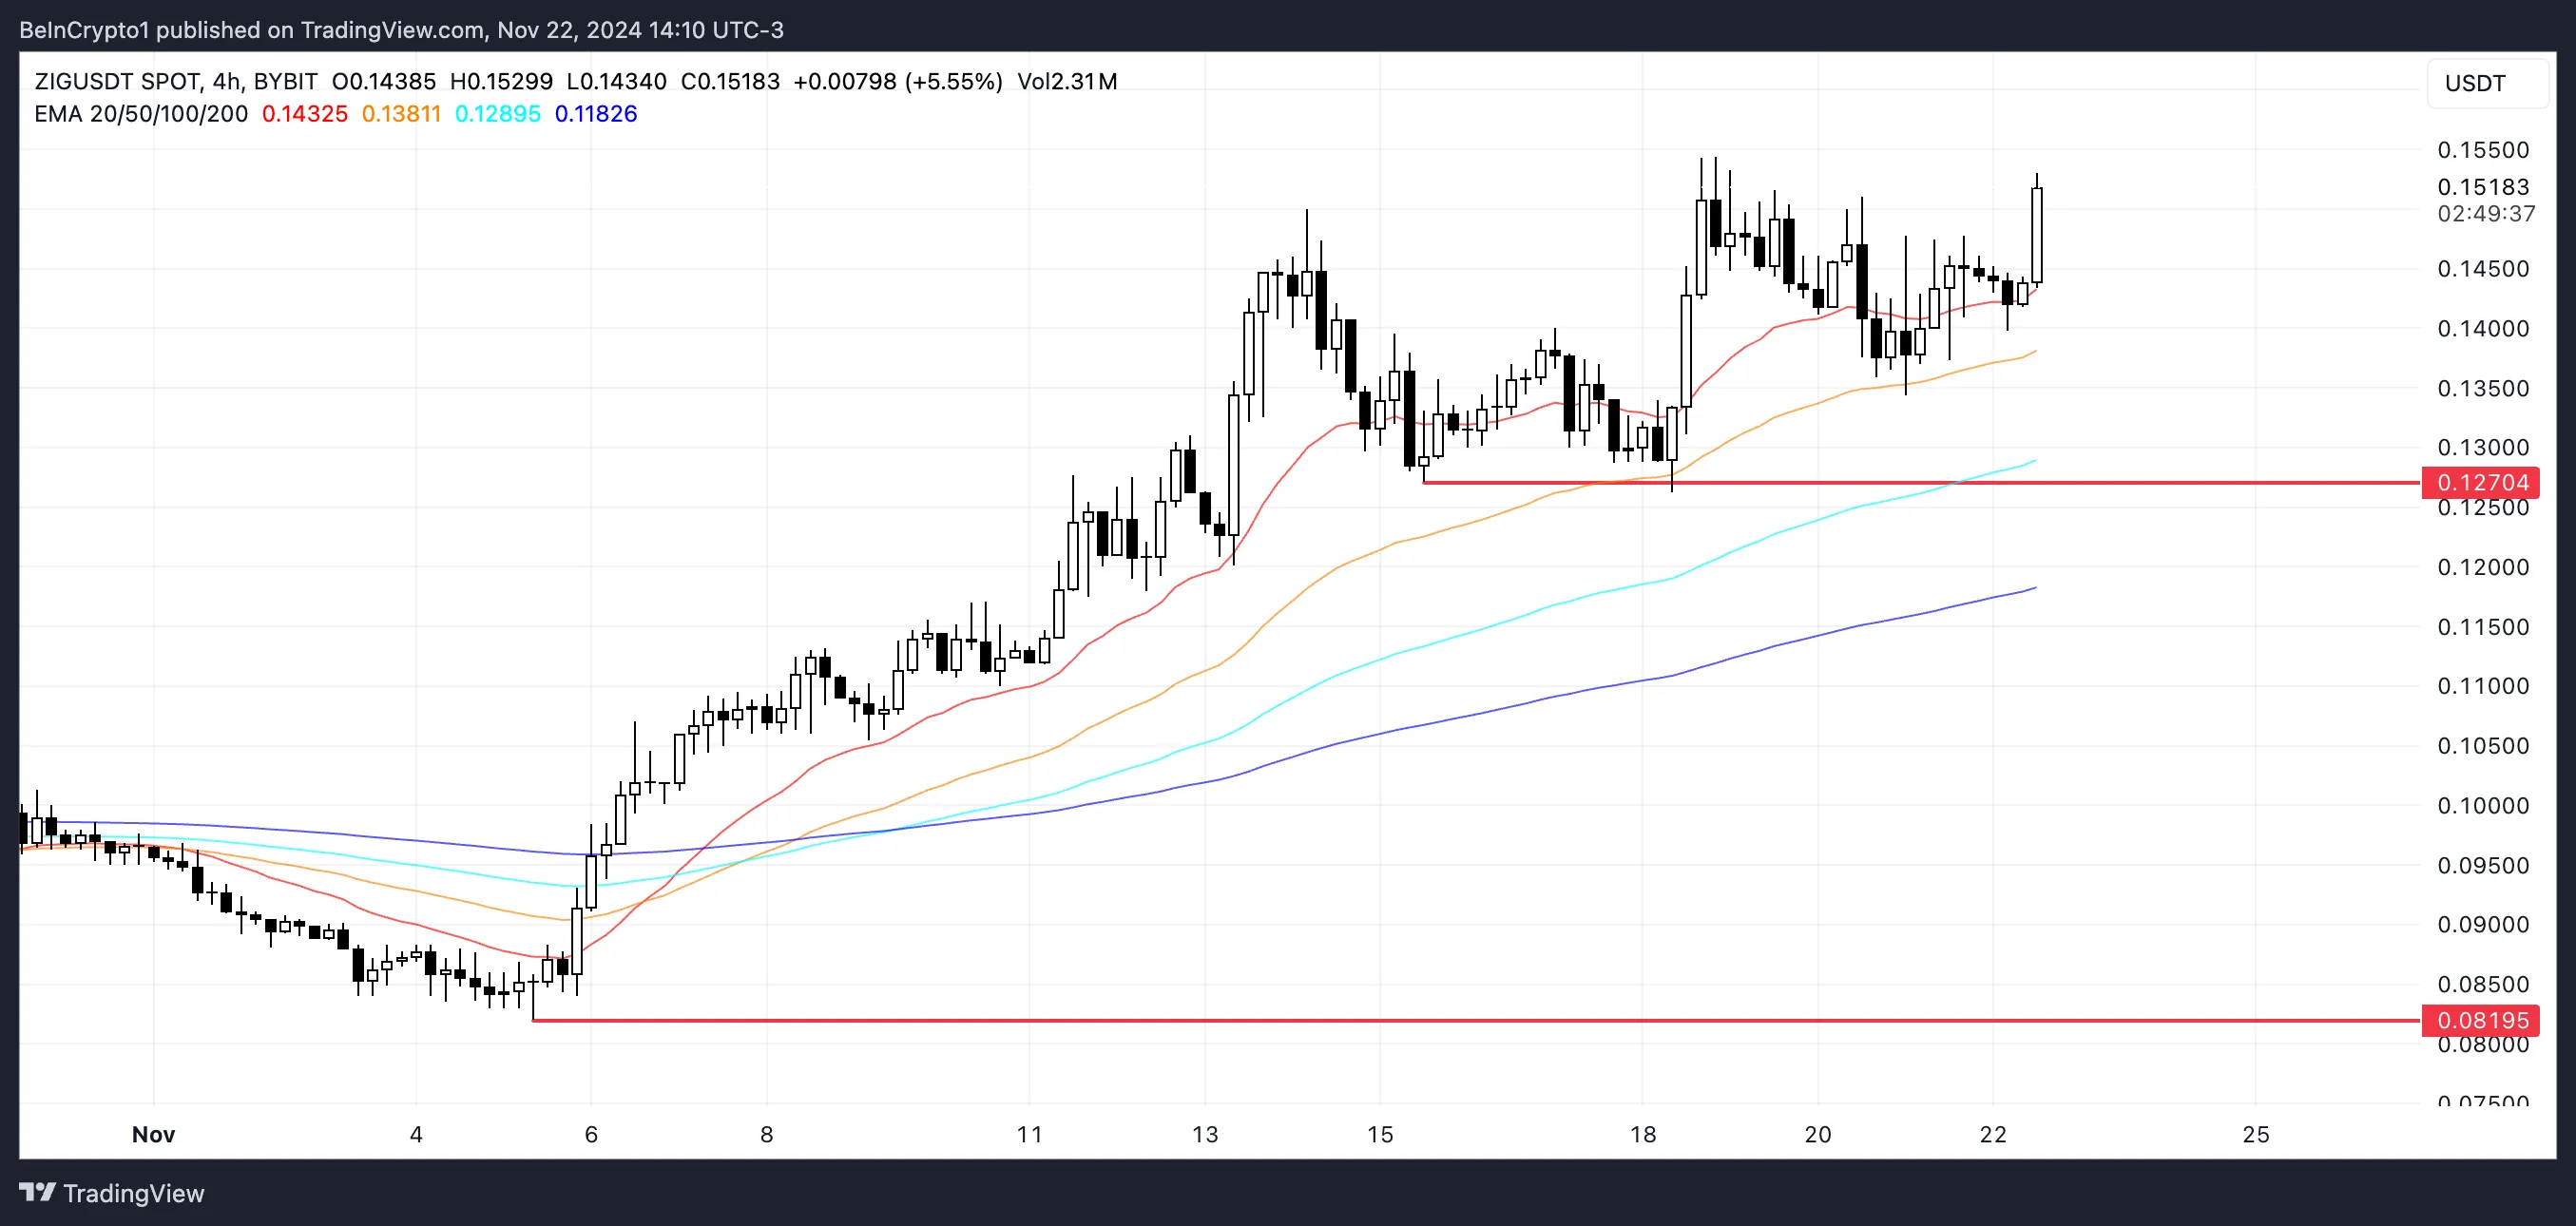
ZIG is currently 20% below its all-time high but may be gearing up to test it again. The coin has recently surpassed a $200 million market cap and is up 15% over the last seven days.
If the uptrend remains strong, ZIG could break past its all-time high, surpassing $0.19. However, a reversal in market sentiment could see the coin testing its support at $0.127. If that level fails, ZIG may face a deeper correction, potentially dropping to $0.081.
Akash Network (AKT)
Akash Network is a decentralized, open-source cloud computing platform designed to connect those in need of computing power with providers offering cloud resources using artificial intelligence.
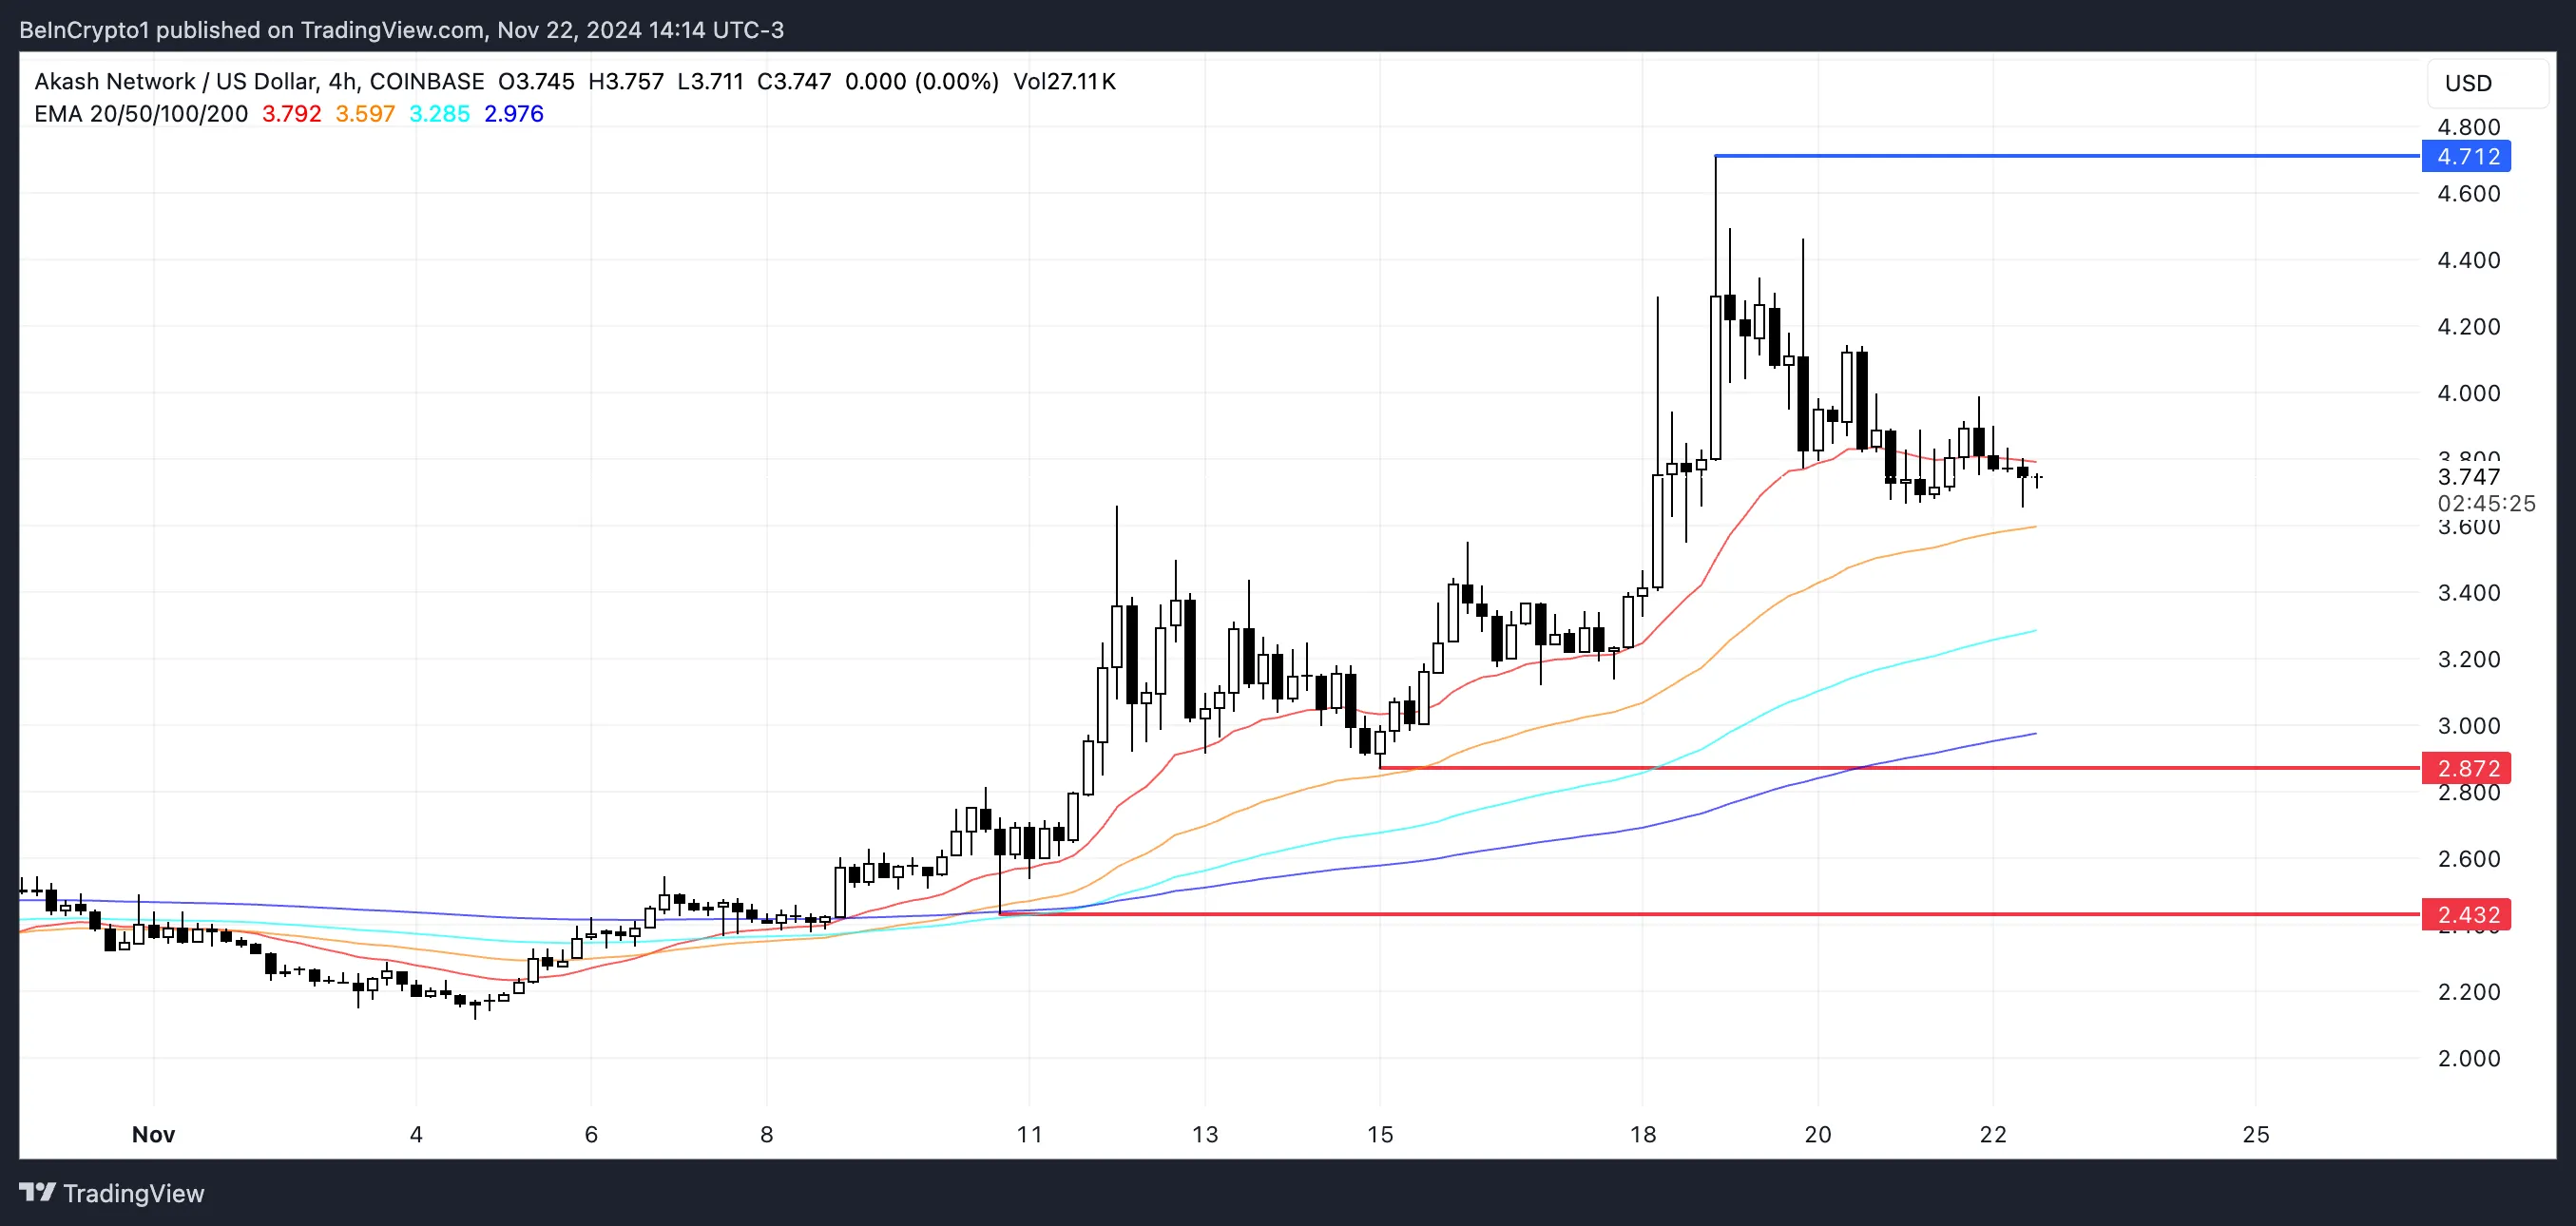
AKT, Akash’s native token, is currently the fifth-largest AI-focused coin in the market and is approaching a $1 billion market cap. With a 22% gain over the past seven days, AKT has demonstrated strong momentum, positioning itself for potential further growth as it eyes this significant milestone in the coming weeks.
If the uptrend continues, AKT could test resistance at $4.71 and possibly push toward $5 for the first time since May 2024. However, if market sentiment shifts and the trend reverses, AKT may face downward pressure, testing support levels at $2.87 and $2.43.
Disclaimer
In line with the Trust Project guidelines, this price analysis article is for informational purposes only and should not be considered financial or investment advice. BeInCrypto is committed to accurate, unbiased reporting, but market conditions are subject to change without notice. Always conduct your own research and consult with a professional before making any financial decisions. Please note that our Terms and Conditions, Privacy Policy, and Disclaimers have been updated.


Donald Trump, the President-elect of the United States, has nominated Scott Bessent as Treasury Secretary for his administration. This decision has generated enthusiasm in the emerging industry due to Bessent’s pro-crypto reputation.
Bessent and Cantor Fitzgerald CEO Howard Lutnick had been considered strong favorites for the position. However, Lutnick was eventually nominated as Commerce Secretary.
Crypto Industry Welcomes Scott Bessent’s Nomination for Treasury Secretary
In a November 22 announcement on Truth Social, Trump praised Bessent as the ideal candidate to support his administration’s economic goals. The President stated that Bessent will play a pivotal role in strengthening the US economy, fostering innovation, and maintaining the dollar’s status as the global reserve currency.
“Scott will support my policies that will drive US competitiveness, and stop unfair trade imbalances, work to create an economy that places growth at the forefront, especially through our coming world energy dominance,” Trump added.
Wall Street veteran Bessent, who founded the international macro investment company Key Square Group, brings extensive experience to the role. He had previously served as the chief investment officer for the prominent investor George Soros.
While President Trump’s announcement did not directly reference cryptocurrencies, many in the digital asset space view Bessent’s appointment as a positive sign. In past statements, Bessent has described crypto as a symbol of financial freedom. He also called Bitcoin an alternative investment for younger investors disillusioned with the traditional financial system.
“I have been excited about the president’s embrace of crypto and I think it fits very well with the Republican Party, crypto is about freedom in the crypto economy is here to stay,” Bessent stated.
His pro-crypto stance has led many to believe his leadership could encourage a more balanced approach to digital asset regulation. This would contrast with the outgoing administration’s enforcement-heavy tactics, such as its controversial sanctions on decentralized platforms like Tornado Cash.
Indeed, crypto industry leaders have responded enthusiastically to Bessent’s nomination. Ripple CEO Brad Garlinghouse commended Bessent’s nomination, calling it a win for innovation. He noted that Bessent’s leadership could mark a turning point for crypto-friendly policies in Washington.
Similarly, Kristin Smith, CEO of the Blockchain Association, highlighted the importance of Bessent working with Congress to establish clear regulations, ensure fair tax treatment, and protect self-custody rights for digital assets.
“Critical to this nomination would be working with Congress on a regulatory framework for digital assets, protecting the right to self custody, pushing for clearer tax treatment of digital assets, and working closely with industry experts to protect our nation’s security,” Smith remarked.
Disclaimer
In adherence to the Trust Project guidelines, BeInCrypto is committed to unbiased, transparent reporting. This news article aims to provide accurate, timely information. However, readers are advised to verify facts independently and consult with a professional before making any decisions based on this content. Please note that our Terms and Conditions, Privacy Policy, and Disclaimers have been updated.

ADA, the native coin of the Cardano blockchain, has made a significant price breakthrough. It has surpassed the $1 mark for the first time in two years. As of this writing, the altcoin trades at $1.09, a price level last observed in April 2022. `
Over the past 24 hours, ADA’s price has rocketed by 24%, and its trading volume has increased by 131% during the same period. With heightening buying pressure, the Cardano coin price rally is poised to continue.
Cardano Holders See Green
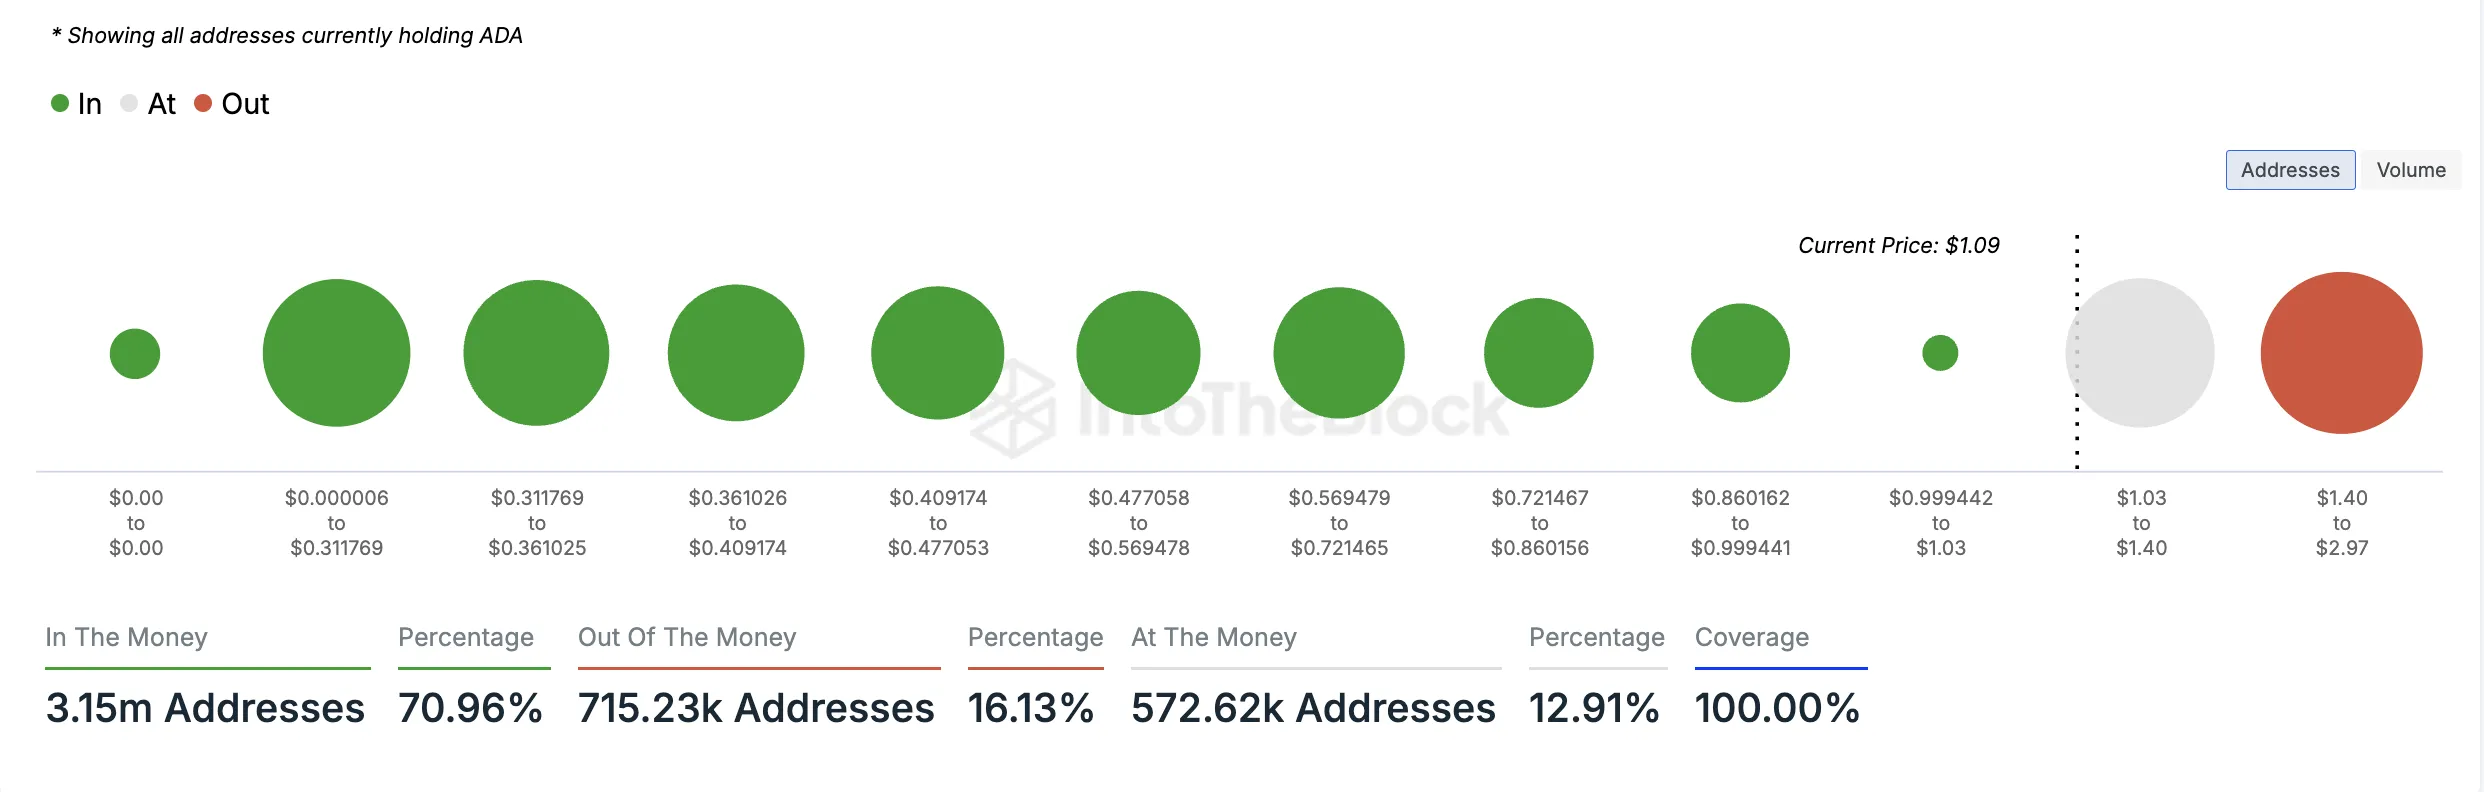
Cardano’s ascent above the $1 price mark has put many of its holders in profit. According to IntoTheBlock’s Global In/Out of the Money indicator, 3.15 million addresses, which comprise 71% of all ADA holders, are “in the money.”
An address is said to be “in the money” if the current market price of the asset it holds is higher than the average cost at which the address acquired those tokens. This means the holder would profit if they sold their holdings at the current market price.
Conversely, 715,230 addresses, which comprise 16% of all ADA holders, are “out of the money.” These addresses would incur a loss if they sold at the current price. Per IntoTheBlock’s data, this cohort of investors acquired their coins when ADA sold above $1.40.
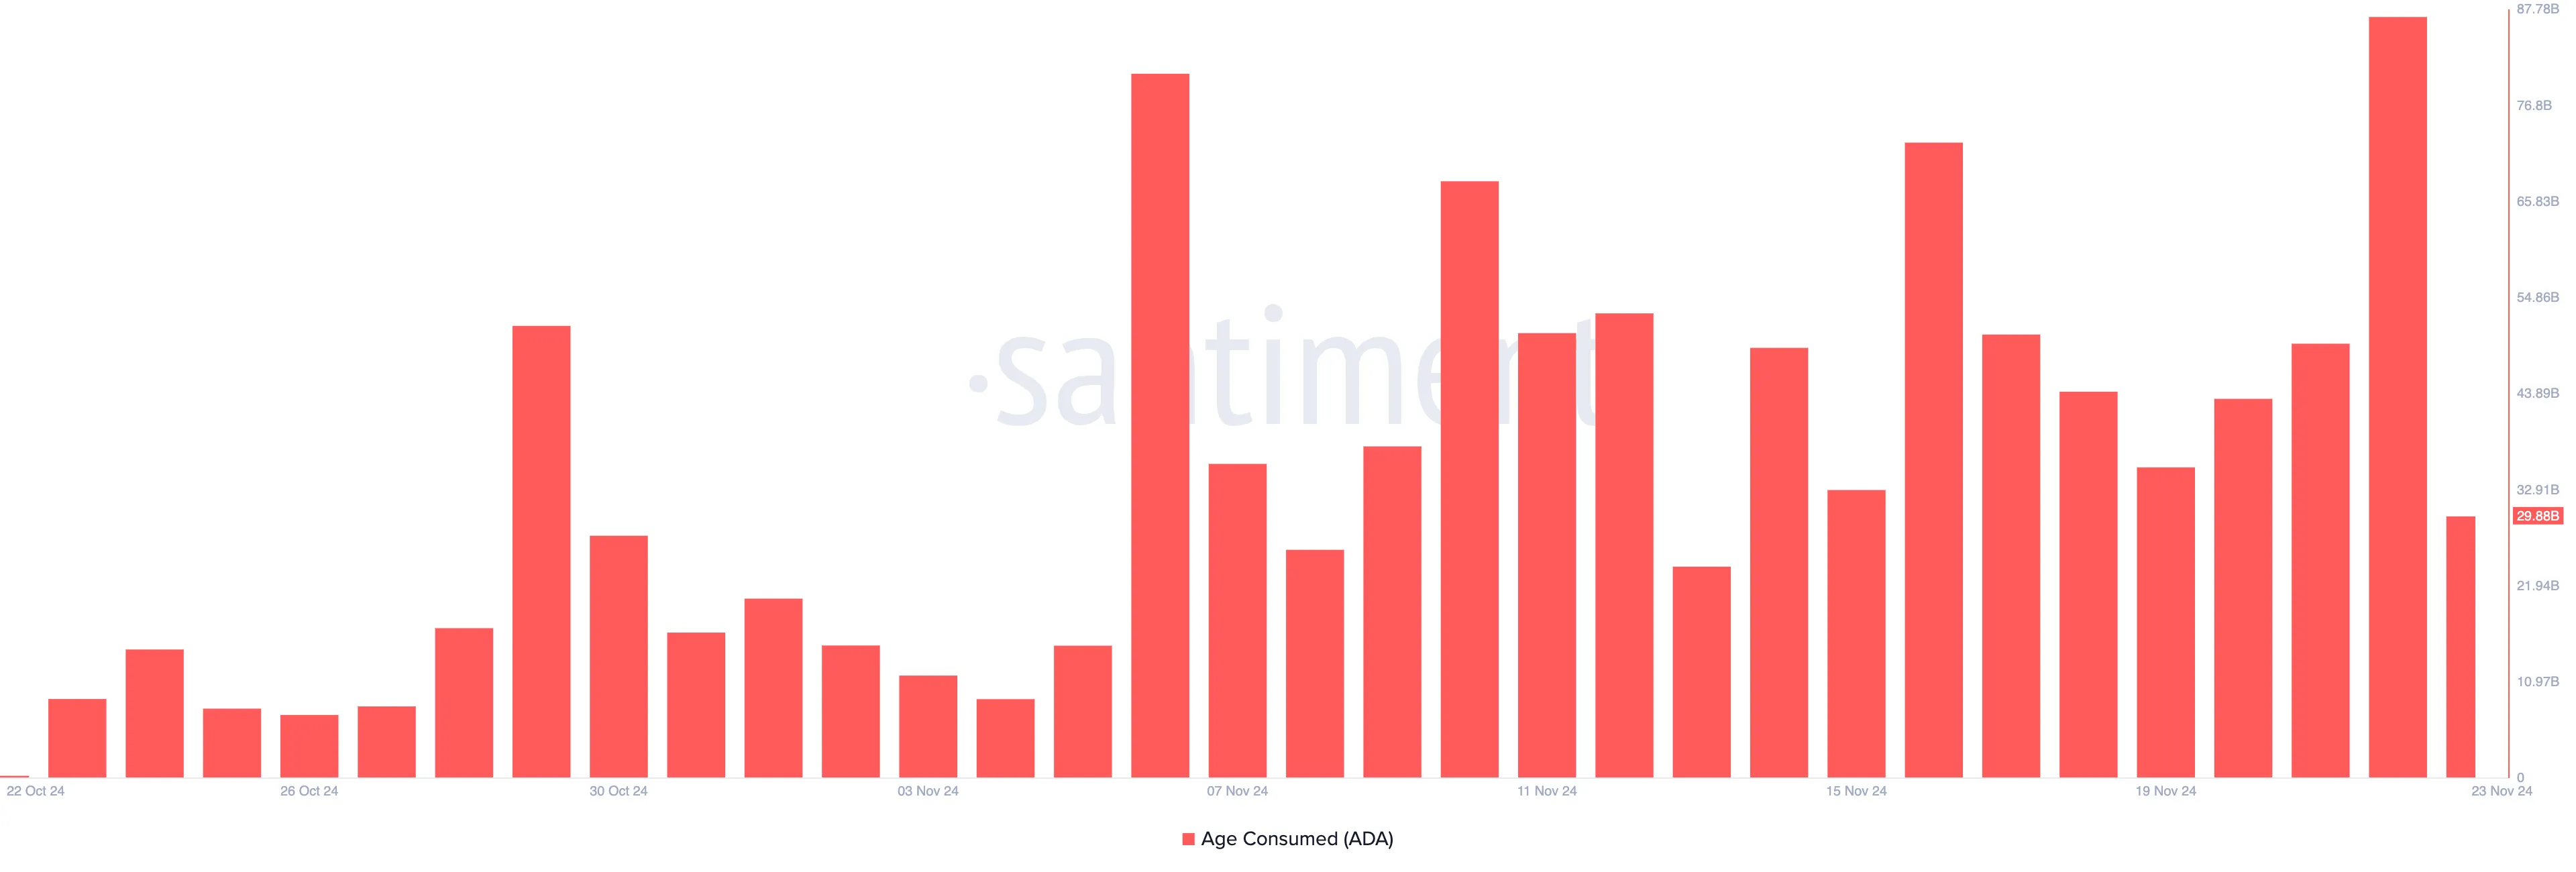
Notably, with many addresses now holding unrealized profits, long-term holders (LTHs) of ADA are repositioning, potentially to secure gains. This activity is reflected by the spike in ADA’s age-consumed metric, which, per Santiment’s data, skyrocketed to a monthly high of 86.91 billion on November 22, when the uptrend began.
This surge is notable because long-term holders rarely move their coins around. When they do, it often hints at a shift in market trends. Therefore, as in ADA’s case, if the spike is accompanied by increased trading volume and positive price action, it suggests that long-term holders are taking profits. This may fuel further price increases as new buyers enter the market.
ADA Price Prediction: The Upward Trend Is Strong
On the daily chart, ADA’s Aroon Up Line is at 100%. The Aroon indicator measures the strength and direction of a trend. When the Aroon Up line is at 100%, it indicates a strong upward trend, suggesting a recent high and a potential continuation of the bullish momentum.
If this holds and new demand continues to enter the market, the Cardano coin price rally will continue toward $1.24, a price high it last reached in March 2022.
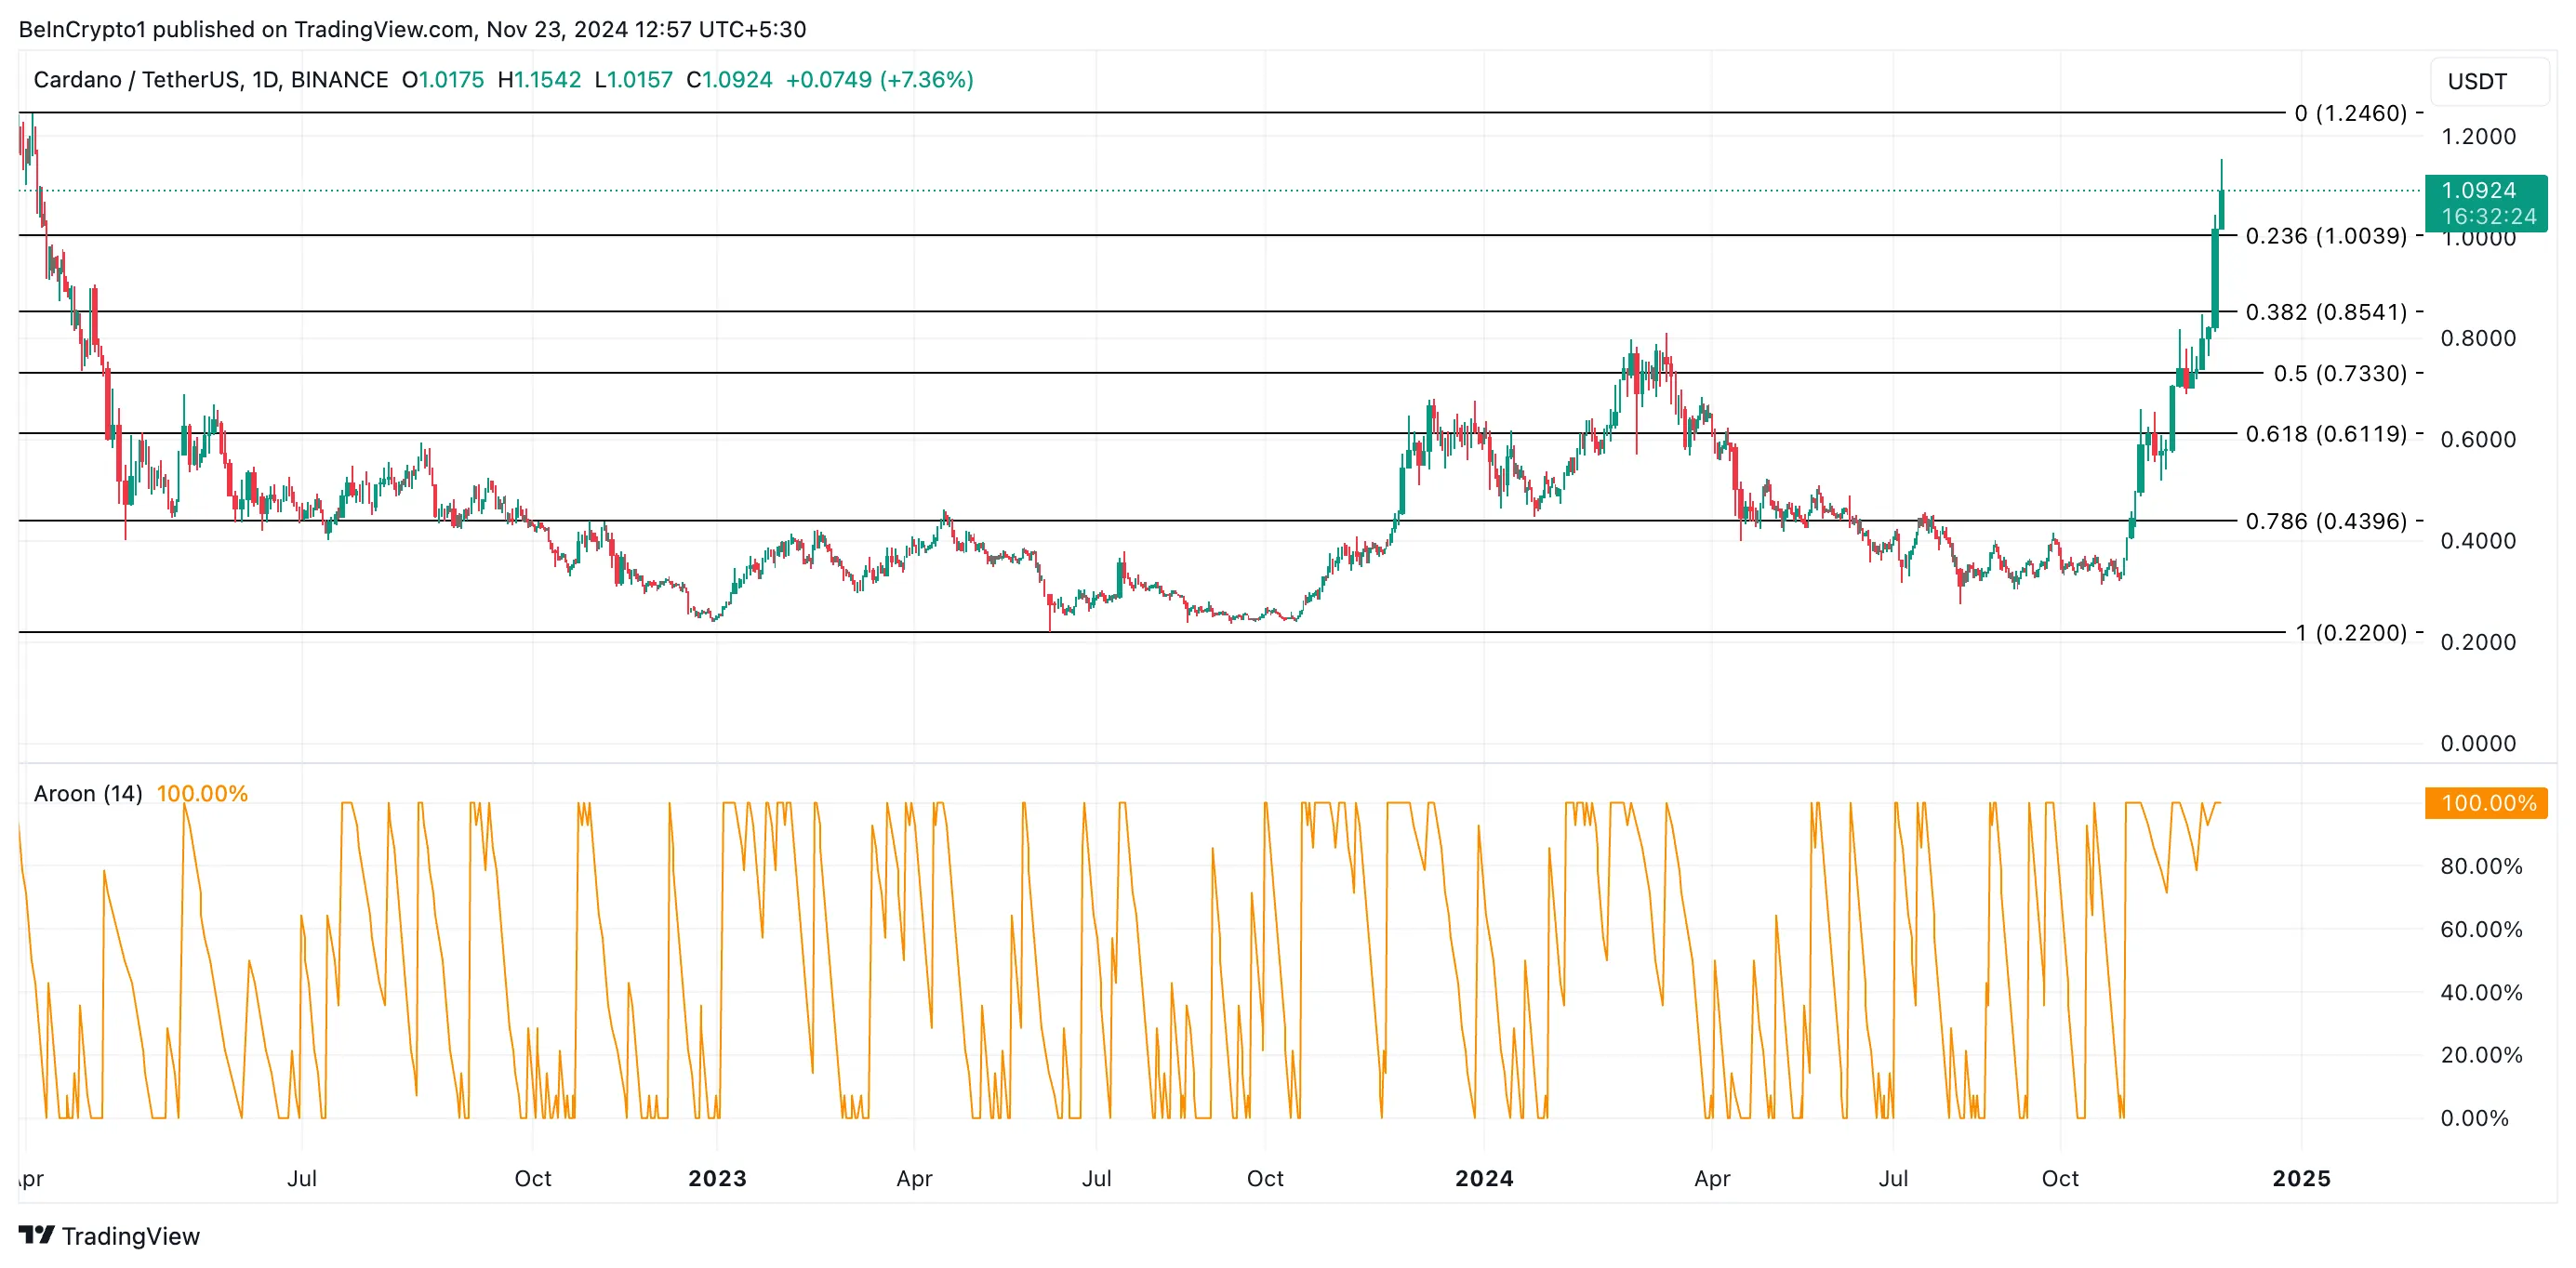
On the other hand, if profit-taking intensifies and buying pressure weakens, ADA’s price may fall to retest support at $1. Should this level fail to hold, the downtrend will be confirmed, and ADA’s price will plunge to $0.85.
Disclaimer
In line with the Trust Project guidelines, this price analysis article is for informational purposes only and should not be considered financial or investment advice. BeInCrypto is committed to accurate, unbiased reporting, but market conditions are subject to change without notice. Always conduct your own research and consult with a professional before making any financial decisions. Please note that our Terms and Conditions, Privacy Policy, and Disclaimers have been updated.
Alameda Research Dumping Polygon (POL) Amid Price Spike, What’s Next?
Artificial Intelligence Coins on the Rise: TFUEL, ZIG, and AKT

Terra Luna Classic Community Discord On Proposal Amid LUNC Price Rally

Trump Taps Pro-Crypto Scott Bessent for Treasury Secretary Role

Arthur Hayes Shills Another Solana Meme Coin, Price Rallies
Will the Cardano Coin Price Rally Continue?

2.52 Million Altcoins Are Ruining Crypto’s Future

Animoca Brands Valuation Tanks 75% In Two Years, Here’s Why

Crypto exchange BingX hacked for $43 million

Are The Big Players Losing Interest?

Hong Kong’s Securities Association Tips Authorities On Crypto Self-Regulation

Coinbase cbBTC Set to go Live on Solana
2.52 Million Altcoins Are Ruining Crypto’s Future
Animoca Brands Valuation Tanks 75% In Two Years, Here’s Why
Crypto exchange BingX hacked for $43 million
Are The Big Players Losing Interest?
Hong Kong’s Securities Association Tips Authorities On Crypto Self-Regulation
Coinbase cbBTC Set to go Live on Solana
-

 Market24 hours ago
3 altcoins that could go ballistic if Bitcoin (BTC) crosses $120,000 mark
-
 Altcoin24 hours ago
Dormant Ethereum Whale Dumps $224M Tokens, Has ETH Price Topped?
-

 Regulation16 hours ago
US SEC Commissioner Jaime Lizárraga to resign in January
-
 Blockchain20 hours ago
Sui and Franklin Templeton Team Up To Drive DeFi Adoption: Details
-
 Market20 hours ago
Altcoins Trending Today — November 22: MYTH, MAD, MODE
-

 Market19 hours ago
Sui Partners with Franklin Templeton for Blockchain Development
-
 Regulation18 hours ago
Blockchain Association Outlines 5 Crypto Priorities For Donald Trump’s Administration
-
 Market23 hours ago
Stellar (XLM) Price Climbs to Three-Year High