
Market
Bitcoin, Ethereum Face $2 Billion Options Expiration

The crypto market braces for volatility as approximately $2.06 billion in Bitcoin (BTC) and Ethereum (ETH) options will expire today.
How will the expiring options impact the market dynamics, with notable data points highlighting the significant stakes involved?
Key Insights on Today’s Bitcoin and Ethereum Options Expiration
Approximately 20,276 Bitcoin options contracts are set to expire today. These contracts have a notional value of $1.35 billion, with a put-to-call ratio of 0.49. In the context of crypto options trading, this ratio suggests a prevalence of purchase options (calls) over sales options (puts).
Read more: An Introduction to Crypto Options Trading
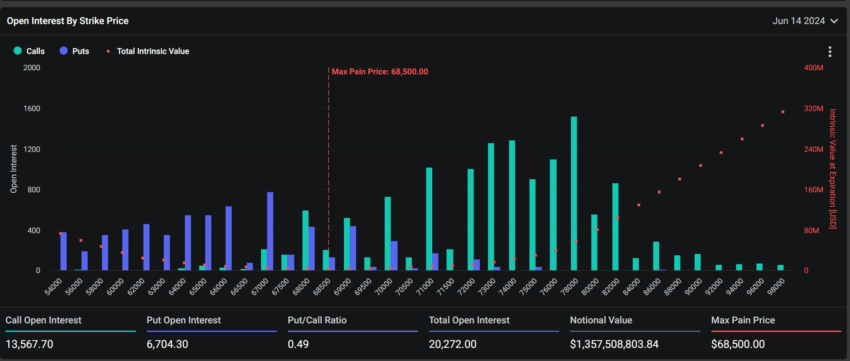
These expiring Bitcoin options have a maximum pain point of $68,500. This represents the price level where the greatest financial losses will be experienced by option holders, marking critical thresholds for market participants.
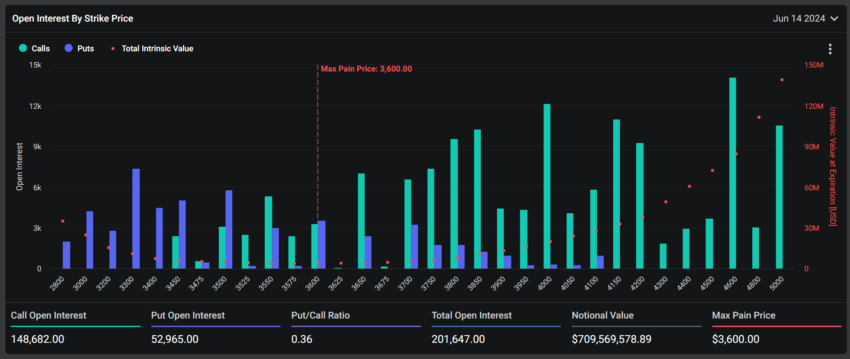
Additionally, 201,647 Ethereum contracts will expire at the same time. According to Deribit’s data, the notional value of these contracts is $709.76 million, with a maximum pain point of $3,600. The data further shows that the put-to-call ratio for these options is 0.36.
Adam, a macro researcher at options trading tool Greeks.Live, shared insights on today’s expiring Bitcoin and Ethereum contracts. He emphasized the week’s macroeconomic importance.
“This week is a big week for macroeconomics. Economic data is relatively favorable to the venture capital market. The US stock market has risen significantly, but the crypto market has performed poorly. Mainstream coins have fallen overall, and altcoins have fallen even more. There are fewer hot spots in the market recently, and the market is relatively quiet,” he noted.
He further explained the volatility and the potential strategic moves for traders.
“Currently, the major medium- and short-term implied volatilities of BTC are all below 50%, and the major medium- and short-term [implied volatilities] IVs of ETH are all below 60%. Both have fallen to relatively low levels, providing buyers with a high cost-effectiveness ratio. There should be new news on the approval of [spot] ETH [exchange-traded fund] ETF at the end of this month, so you can plan for next month’s call options in advance,” Adam suggested.
Bitcoin and Ethereum have faced price declines leading up to this expiration. Bitcoin, which traded at $71,643 on June 7, briefly dipped to $66,254 on June 11 before recovering to $69,945 on June 12.
Currently, Bitcoin trades at $67,064, reflecting a 6% drop over the past week. Meanwhile, Ethereum is trading at $3,519, marking a 7.8% decrease.
Read more: 9 Best Crypto Options Trading Platforms
While options expirations can cause temporary market disruptions, they are often followed by stabilization. Traders should remain vigilant, analyzing technical indicators and market sentiment to navigate the anticipated volatility effectively.
Disclaimer
In adherence to the Trust Project guidelines, BeInCrypto is committed to unbiased, transparent reporting. This news article aims to provide accurate, timely information. However, readers are advised to verify facts independently and consult with a professional before making any decisions based on this content. Please note that our Terms and Conditions, Privacy Policy, and Disclaimers have been updated.


Reason to trust
![]()
Strict editorial policy that focuses on accuracy, relevance, and impartiality
Created by industry experts and meticulously reviewed
The highest standards in reporting and publishing
Strict editorial policy that focuses on accuracy, relevance, and impartiality
Morbi pretium leo et nisl aliquam mollis. Quisque arcu lorem, ultricies quis pellentesque nec, ullamcorper eu odio.
Ethereum price attempted a recovery wave above the $1,880 level but failed. ETH is now trimming all gains and remains below the $1,880 resistance zone.
- Ethereum failed to stay above the $1,850 and $1,880 levels.
- The price is trading below $1,850 and the 100-hourly Simple Moving Average.
- There was a break below a key bullish trend line with support at $1,865 on the hourly chart of ETH/USD (data feed via Kraken).
- The pair must clear the $1,865 and $1,890 resistance levels to start a decent increase.
Ethereum Price Fails Again
Ethereum price managed to stay above the $1,800 support zone and started a recovery wave, like Bitcoin. ETH was able to climb above the $1,850 and $1,880 resistance levels.
The bulls even pushed the price above the $1,920 resistance zone. However, the bears are active near the $1,950 zone. A high was formed at $1,955 and the price trimmed most gains. There was a break below a key bullish trend line with support at $1,865 on the hourly chart of ETH/USD.
A low was formed at $1,781 and the price is now consolidating near the 23.6% Fib retracement level of the downward move from the $1,955 swing high to the $1,781 low.
Ethereum price is now trading below $1,850 and the 100-hourly Simple Moving Average. On the upside, the price seems to be facing hurdles near the $1,850 level. The next key resistance is near the $1,865 level and the 50% Fib retracement level of the downward move from the $1,955 swing high to the $1,781 low.

The first major resistance is near the $1,920 level. A clear move above the $1,920 resistance might send the price toward the $1,950 resistance. An upside break above the $1,950 resistance might call for more gains in the coming sessions. In the stated case, Ether could rise toward the $2,000 resistance zone or even $2,050 in the near term.
Another Decline In ETH?
If Ethereum fails to clear the $1,865 resistance, it could start another decline. Initial support on the downside is near the $1,800 level. The first major support sits near the $1,780 zone.
A clear move below the $1,780 support might push the price toward the $1,720 support. Any more losses might send the price toward the $1,680 support level in the near term. The next key support sits at $1,620.
Technical Indicators
Hourly MACD – The MACD for ETH/USD is gaining momentum in the bearish zone.
Hourly RSI – The RSI for ETH/USD is now below the 50 zone.
Major Support Level – $1,780
Major Resistance Level – $1,865
Cardano price started a recovery wave above the $0.680 zone but failed. ADA is consolidating near $0.650 and remains at risk of more losses.
- ADA price failed to recover above the $0.70 resistance zone.
- The price is trading below $0.680 and the 100-hourly simple moving average.
- There was a break below a connecting bullish trend line with support at $0.6720 on the hourly chart of the ADA/USD pair (data source from Kraken).
- The pair could start another increase if it clears the $0.70 resistance zone.
Cardano Price Dips Again
In the past few days, Cardano saw a recovery wave from the $0.6350 zone, like Bitcoin and Ethereum. ADA was able to climb above the $0.680 and $0.6880 resistance levels.
However, the bears were active above the $0.70 zone. A high was formed at $0.7090 and the price corrected most gains. There was a move below the $0.650 level. Besides, there was a break below a connecting bullish trend line with support at $0.6720 on the hourly chart of the ADA/USD pair.
A low was formed at $0.6356 and the price is now consolidating losses near the 23.6% Fib retracement level of the recent decline from the $0.7090 swing high to the $0.6356 low. Cardano price is now trading below $0.680 and the 100-hourly simple moving average.
On the upside, the price might face resistance near the $0.6720 zone or the 50% Fib retracement level of the recent decline from the $0.7090 swing high to the $0.6356 low. The first resistance is near $0.6950. The next key resistance might be $0.700.

If there is a close above the $0.70 resistance, the price could start a strong rally. In the stated case, the price could rise toward the $0.7420 region. Any more gains might call for a move toward $0.7650 in the near term.
Another Drop in ADA?
If Cardano’s price fails to climb above the $0.6720 resistance level, it could start another decline. Immediate support on the downside is near the $0.6420 level.
The next major support is near the $0.6350 level. A downside break below the $0.6350 level could open the doors for a test of $0.620. The next major support is near the $0.60 level where the bulls might emerge.
Technical Indicators
Hourly MACD – The MACD for ADA/USD is losing momentum in the bearish zone.
Hourly RSI (Relative Strength Index) – The RSI for ADA/USD is now below the 50 level.
Major Support Levels – $0.6420 and $0.6350.
Major Resistance Levels – $0.6720 and $0.7000.
Aayush Jindal, a luminary in the world of financial markets, whose expertise spans over 15 illustrious years in the realms of Forex and cryptocurrency trading. Renowned for his unparalleled proficiency in providing technical analysis, Aayush is a trusted advisor and senior market expert to investors worldwide, guiding them through the intricate landscapes of modern finance with his keen insights and astute chart analysis.
From a young age, Aayush exhibited a natural aptitude for deciphering complex systems and unraveling patterns. Fueled by an insatiable curiosity for understanding market dynamics, he embarked on a journey that would lead him to become one of the foremost authorities in the fields of Forex and crypto trading. With a meticulous eye for detail and an unwavering commitment to excellence, Aayush honed his craft over the years, mastering the art of technical analysis and chart interpretation.
As a software engineer, Aayush harnesses the power of technology to optimize trading strategies and develop innovative solutions for navigating the volatile waters of financial markets. His background in software engineering has equipped him with a unique skill set, enabling him to leverage cutting-edge tools and algorithms to gain a competitive edge in an ever-evolving landscape.
In addition to his roles in finance and technology, Aayush serves as the director of a prestigious IT company, where he spearheads initiatives aimed at driving digital innovation and transformation. Under his visionary leadership, the company has flourished, cementing its position as a leader in the tech industry and paving the way for groundbreaking advancements in software development and IT solutions.
Despite his demanding professional commitments, Aayush is a firm believer in the importance of work-life balance. An avid traveler and adventurer, he finds solace in exploring new destinations, immersing himself in different cultures, and forging lasting memories along the way. Whether he’s trekking through the Himalayas, diving in the azure waters of the Maldives, or experiencing the vibrant energy of bustling metropolises, Aayush embraces every opportunity to broaden his horizons and create unforgettable experiences.
Aayush’s journey to success is marked by a relentless pursuit of excellence and a steadfast commitment to continuous learning and growth. His academic achievements are a testament to his dedication and passion for excellence, having completed his software engineering with honors and excelling in every department.
At his core, Aayush is driven by a profound passion for analyzing markets and uncovering profitable opportunities amidst volatility. Whether he’s poring over price charts, identifying key support and resistance levels, or providing insightful analysis to his clients and followers, Aayush’s unwavering dedication to his craft sets him apart as a true industry leader and a beacon of inspiration to aspiring traders around the globe.
In a world where uncertainty reigns supreme, Aayush Jindal stands as a guiding light, illuminating the path to financial success with his unparalleled expertise, unwavering integrity, and boundless enthusiasm for the markets.

US Dollar Index Drops – What Does It Mean for Bitcoin?

Ethereum Price Recovery Stalls—Bears Keep Price Below $2K

Cardano (ADA) Downtrend Deepens—Is a Rebound Possible?

Analyst Forecasts 250% Dogecoin Price Rally If This Level Holds

XRP Price Under Pressure—New Lows Signal More Trouble Ahead

Bitcoin Price Swings Wildly—Yet Bears Keep the Upper Hand!

2.52 Million Altcoins Are Ruining Crypto’s Future

Animoca Brands Valuation Tanks 75% In Two Years, Here’s Why

Crypto exchange BingX hacked for $43 million

Are The Big Players Losing Interest?

Hong Kong’s Securities Association Tips Authorities On Crypto Self-Regulation

Coinbase cbBTC Set to go Live on Solana
2.52 Million Altcoins Are Ruining Crypto’s Future
Animoca Brands Valuation Tanks 75% In Two Years, Here’s Why
Crypto exchange BingX hacked for $43 million
Are The Big Players Losing Interest?
Hong Kong’s Securities Association Tips Authorities On Crypto Self-Regulation
Coinbase cbBTC Set to go Live on Solana
-

 Market23 hours ago
BNB Price Faces More Downside—Can Bulls Step In?
-

 Regulation18 hours ago
Kraken Obtains Restricted Dealer Registration in Canada
-

 Bitcoin24 hours ago
Tokenized Gold Market Cap Tops $1.2 Billion as Gold Prices Surge
-
 Altcoin14 hours ago
Here’s Why This Analyst Believes XRP Price Could Surge 44x
-
 Altcoin22 hours ago
What’s Fueling The Shibarium Boost?
-

 Bitcoin20 hours ago
Lummis Confirms Treasury Probes Direct Buys
-
 Altcoin13 hours ago
How Will Elon Musk Leaving DOGE Impact Dogecoin Price?
-
 Altcoin10 hours ago
First Digital Trust Denies Justin Sun’s Allegations, Claims Full Solvency