
Ethereum
Ethereum Buying Pressure Reaches Critical Level Amid Massive Whale Buying

Institutional investors have been accumulating Ethereum at a rapid pace after the SEC’s recent approval of Spot Ethereum ETFs. Crypto analyst Ali Martinez noted that this accumulation trend has created buying pressure that could be the much-needed catalyst for Ethereum to break above the $4,000 price mark.
According to a social media post by Ali Martinez, the number of Ethereum addresses holding over 10,000 ETH tokens has increased by 3% in the last three weeks, showing a positive trend among large investors.
Whales Accumulating Pushes Ethereum Buying Pressure
Speculation over ETF approvals and increasing institutional buy-in have helped fuel Ethereum’s price increase earlier this year. The first price surge occurred in February when multiple reports came out of the SEC potentially approving Spot Ethereum ETF applications after the approval of Spot Bitcoin ETFs.
Related Reading
This saw the price of Ethereum surging over 83% throughout the month to reach above $4,000 again for the first time since 2021. Similarly, court rulings in May, which increased the odds of Spot Ethereum ETF approval, pushed the price of ETH above $3,000 again.
Now that the SEC has finally approved these spot ETF applications, institutional investors are taking the chance to load up their portfolios with Ethereum. According to Glassnode data, this accumulation, which has been going on for the past three weeks, has pushed the number of wallets holding over 10,000 ETH past 975 and steadily approaching 1,000 addresses. Furthermore, data shows that the number of ETH mega-whale addresses has steadily increased in the past 30 days, with the recent metric showing an addition of 15 whale addresses.
The number of #Ethereum addresses holding 10,000+ $ETH has increased by 3% in the last three weeks, signaling an important spike in buying pressure! pic.twitter.com/7qq5HgGP37
— Ali (@ali_charts) June 9, 2024
On-chain data also reveals that social sentiment for ETH has stabilized after intense enthusiasm post-Spot Ethereum ETF approval. However, this hasn’t stopped the massive withdrawal from exchanges, leading Ethereum to become scarcer on centralized exchanges. This trend has now seen the Ethereum balance on centralized exchanges dropping below Bitcoin, even as Spot Bitcoin ETF wallets also accumulate Bitcoins. According to Glassnode data, less than 10.56% of Ethereum’s total supply is currently held on major exchanges.
ETH Price Outlook: What’s Next After Critical Buying Pressure?
With whales doubling down on Ethereum, the buying pressure has reached a critical point. This surge of interest signals a very bullish outlook for Ethereum’s price in the coming months, although there could be short-term volatility.
Related Reading
At the time of writing, Ethereum is trading at $3,527 and has fallen 3.83% in the past 24 hours. While the increase in buying pressure is a good start, the bulls still have some work to do to push Ethereum’s price higher. The first major resistance wall is around $3,700, where 1.82 million addresses hold 1.8 million ETH.
Featured image created with Dall.E, chart from Tradingview.com


Comparing current price action with past performances, Ethereum, the second-largest crypto asset, seems to have witnessed its worst-ever first quarter as it draws closer to its end. However, many investors are expressing interest in ETH’s prospects again, purchasing the asset in huge chunks.
Investors Buying The Ethereum’s Price Dip
Ethereum has continued to struggle to undergo a major upward move even as other digital assets make history in the ongoing market cycle. Despite the recent pullback in ETH’s price, Ali Martinez, a seasoned crypto analyst and trader, has highlighted a renewed bullish sentiment among investors.
Specifically, investors are seizing the opportunity to stack up on ETH in light of ongoing price correction, signaling interest and confidence in the asset’s long-term potential. This buying activity suggests that seasoned traders are considering the current drop as a strategic entry or buying point.
According to Ali Martinez, the development was spotted as Ethereum encountered a significant resistance wall between the $2,200 and $2,580 price mark. Examining the data from IntoTheBlock, the expert reported that over 12.43 million investors purchased a massive portion of 66.18 million ETH within the $2,200 and $2,580 price zones.
These kinds of accumulation show that both retail and institutional investors are hopeful about the market. Should this substantial buying activity extend, Ali Martinez is confident that bullish momentum might build up for ETH, leading to a break above the zone.

Market analyst and trader CryptoELITES predicts a robust upswing for ETH to new all-time highs in the upcoming weeks. CryptoELITES prediction is based on past price trends in which ETH witnessed a massive rally after a lengthy period of downward movements.
Delving into the recent price action, the expert believes ETH’s correction has reached a bottom similar to the 2017 and 2021 bull market cycles. With the altcoin potentially reaching a bottom, CryptoELITES anticipates an over 700% upsurge in 2025.
A 700% surge will bring the altcoin’s price to the $15,000 milestone before the ongoing bull market cycle completes. Given that Ethereum is mirroring past trends, a possible price reversal could be on the horizon.
ETH Eyeing A Breakout From Key Chart Pattern
While ETH is facing volatility, it is presently at a critical junction that might determine its next move. Jonathan Carter, a crypto and technical analyst, reveals that Ethereum is holding above the lower boundary of a Descending Triangle formation after navigating its price in the 4-hour time frame.
At this zone, the asset might muster enough momentum for a rebound. Carter expects a bounce from the current support zone to push ETH toward key resistance levels at $1,950, $2,080, $2,230, and $2,320. However, if the altcoin falls below the support, the price may drop further to the downside.
Featured image from Pexels, chart from Tradingview.com
Editorial Process for bitcoinist is centered on delivering thoroughly researched, accurate, and unbiased content. We uphold strict sourcing standards, and each page undergoes diligent review by our team of top technology experts and seasoned editors. This process ensures the integrity, relevance, and value of our content for our readers.

Reason to trust
![]()
Strict editorial policy that focuses on accuracy, relevance, and impartiality
Created by industry experts and meticulously reviewed
The highest standards in reporting and publishing
Strict editorial policy that focuses on accuracy, relevance, and impartiality
Morbi pretium leo et nisl aliquam mollis. Quisque arcu lorem, ultricies quis pellentesque nec, ullamcorper eu odio.
The Ethereum price has finally broken out of a months-long consolidation pattern, signaling the possible start of a significant bullish move. The recent breakout of an Ascending Triangle formation suggests that ETH is set for more gains, with a crypto analyst suggesting a price target of $7,800 in the coming months.
Ethereum Price Targets $7,700 ATH
The Ethereum price is believed to be targeting a new all-time high of $7,800 after its recent breakout from an Ascending Triangle. For months now, the cryptocurrency has been trading within this classic bullish chart pattern, where prices make higher lows while facing strong resistance at a fixed level.
Related Reading
This consolidation pattern has been active since late 2024, establishing strong resistance at $4,000. TradingView analyst Sohaibfx has predicted that if Ethereum can surpass this resistance level, it would confirm a bullish trend, leading to a strong upward continuation in its price.
Looking at the analyst’s price chart, Ethereum spent several months navigating between $2,000 and $4,000 in Q1 2025. This region represented an accumulation phase where buyers had quietly built their positions in anticipation of a potential rally.
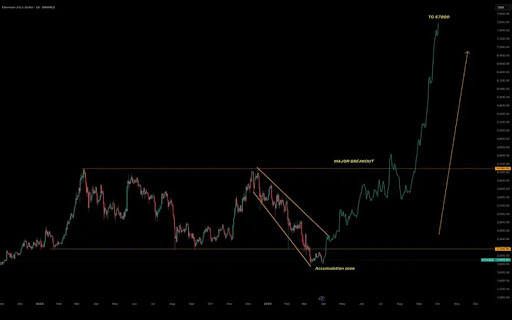
A descending channel marked in orange in the price chart also shows that Ethereum had experienced a significant pullback mid-to-late 2024 before breaking out. This was likely the final shakeout before it regained its bullish momentum.
According to Sohaibfx, a measured move of the Ascending Triangle suggests that Ethereum is poised for an explosive 333% surge to $7,800. This bullish target is calculated by determining the height of the triangle, which is the difference between its base at $2,000 and resistance level at $4,000.
When the price breaks above the resistance, the common method for estimating the possible next move is to add the triangle’s height to the breakout point, which gives a technical target of $6,000. However, based on past price behaviour and strong buying momentum, the Ethereum price could push even higher, with $7,800 being a key psychological level.
Support Levels And Momentum Indicators To Watch
In his price analysis, Sohaibfx has pinpointed the $4,000 and $3,000 price levels as support levels for Ethereum. This support should act as a safety net, where buyers are likely to step in to prevent further decline after Ethereum reaches its projected $7,800 target.
Related Reading
Moving forward, the analyst highlights key momentum indicators that should be monitored. While the analyst’s chart does not specify indicators like Moving Average Convergence Divergence (MACD) or Relative Strength Index (RSI), Ethereum’s sharp upward move suggests that strong momentum will be a major contributor to its rise to a new ATH.
Sohaibfx has advised traders to watch out for RSI levels above 70, as overbought conditions could signal a potential pullback while Ethereum approaches higher levels.
Featured image from Adobe Stock, chart from Tradingview.com

They say journalists never truly clock out. But for Christian, that’s not just a metaphor, it’s a lifestyle. By day, he navigates the ever-shifting tides of the cryptocurrency market, wielding words like a seasoned editor and crafting articles that decipher the jargon for the masses. When the PC goes on hibernate mode, however, his pursuits take a more mechanical (and sometimes philosophical) turn.
Christian’s journey with the written word began long before the age of Bitcoin. In the hallowed halls of academia, he honed his craft as a feature writer for his college paper. This early love for storytelling paved the way for a successful stint as an editor at a data engineering firm, where his first-month essay win funded a months-long supply of doggie and kitty treats – a testament to his dedication to his furry companions (more on that later).
Christian then roamed the world of journalism, working at newspapers in Canada and even South Korea. He finally settled down at a local news giant in his hometown in the Philippines for a decade, becoming a total news junkie. But then, something new caught his eye: cryptocurrency. It was like a treasure hunt mixed with storytelling – right up his alley!
So, he landed a killer gig at NewsBTC, where he’s one of the go-to guys for all things crypto. He breaks down this confusing stuff into bite-sized pieces, making it easy for anyone to understand (he salutes his management team for teaching him this skill).
Think Christian’s all work and no play? Not a chance! When he’s not at his computer, you’ll find him indulging his passion for motorbikes. A true gearhead, Christian loves tinkering with his bike and savoring the joy of the open road on his 320-cc Yamaha R3. Once a speed demon who hit 120mph (a feat he vowed never to repeat), he now prefers leisurely rides along the coast, enjoying the wind in his thinning hair.
Speaking of chill, Christian’s got a crew of furry friends waiting for him at home. Two cats and a dog. He swears cats are way smarter than dogs (sorry, Grizzly), but he adores them all anyway. Apparently, watching his pets just chillin’ helps him analyze and write meticulously formatted articles even better.
Here’s the thing about this guy: He works a lot, but he keeps himself fueled by enough coffee to make it through the day – and some seriously delicious (Filipino) food. He says a delectable meal is the secret ingredient to a killer article. And after a long day of crypto crusading, he unwinds with some rum (mixed with milk) while watching slapstick movies.
Looking ahead, Christian sees a bright future with NewsBTC. He says he sees himself privileged to be part of an awesome organization, sharing his expertise and passion with a community he values, and fellow editors – and bosses – he deeply respects.
So, the next time you tread into the world of cryptocurrency, remember the man behind the words – the crypto crusader, the grease monkey, and the feline philosopher, all rolled into one.

Elon Musk Rules Out The Use Of Dogecoin By The US Government

Market Cap Now Approaching $300 Million

Ethereum’s Price Dips, But Investors Seize The Opportunity To Stack Up More ETH
Trump Family Gets Most WLFI Revenue, Causing Corruption Fears

BNB Breaks Below $605 As Bullish Momentum Fades – What’s Next?
Strategy Adds 22,048 BTC for Nearly $2 Billion

2.52 Million Altcoins Are Ruining Crypto’s Future

Animoca Brands Valuation Tanks 75% In Two Years, Here’s Why

Crypto exchange BingX hacked for $43 million

Are The Big Players Losing Interest?

Hong Kong’s Securities Association Tips Authorities On Crypto Self-Regulation

Coinbase cbBTC Set to go Live on Solana
2.52 Million Altcoins Are Ruining Crypto’s Future
Animoca Brands Valuation Tanks 75% In Two Years, Here’s Why
Crypto exchange BingX hacked for $43 million
Are The Big Players Losing Interest?
Hong Kong’s Securities Association Tips Authorities On Crypto Self-Regulation

