Market
Avalanche (AVAX) Under Pressure: Prolonged Downtrend Next?

Avalanche (AVAX), the token of the smart contract blockchain, has been swinging toward lower price levels for almost a month. As a result, traders in the derivatives market are moving from a previous bullish thesis to a bearish bias.
AVAX had an impressive performance in 2023 and the first quarter of 2024. But recently, the token seems to have lost its stroke of luck.
Bulls Are Staying Away From Avalanche
AVAX trades at $31.53. However, the Long/Short Ratio shows traders expect the price to fall despite the 8.66% 7-day decrease. Evidence of this sentiment is reflected in the Long/Short Ratio.
The Long/Short Ratio measures traders’ expectations toward a cryptocurrency. Values of this indicator above 1 indicate that there are more long positions than shorts. Conversely, a Long/Short Ratio ratio lower than 1 suggests increased bearish predictions.
A long is a market participant expecting the price of a token to increase while filling the bid on a contract. On the other hand, a short is a trader betting on a price decrease.
According to the derivatives information portal Coinglass, AVAX’s Long/Short Ratio was 0.79. This reinforces the aforementioned perception in the market.
Read More: 11 Best Avalanche Wallets to Consider in 2024

Besides the ratio, Open Interest aligns with the potential price decrease. Open Interest refers to the value of outstanding contracts in the market.
This indicator decreases or increases based on net positioning. Unlike the Long/Short Ratio, Open Interest does not indicate whether there are more longs or more shorts. Instead, an increase in Open Interest refers to an influx of liquidity and open contracts.
However, a decrease suggests a rise in closed positions and increased outflow of money. As of this writing, AVAX’s open interest was $211.64 million. On June 7, when the price of AVAX was $35, Open Interest was much higher.

For the token’s value, the decrease may confirm a downward trend as opposed to the upward strength an increase in Open Interest may offer.
AVAX Price Prediction: Long Road From Rally
Meanwhile, AVAX’s market structure on the daily chart suggests a potential fall. The Exponential Moving Average (EMA) is a crucial indicator that corroborates this bias.
EMA measures trend direction and reflects how prices can change within a given period. On the AVAX/USD daily chart, the 20 EMA (blue) crossed below the 50 EMA (yellow) since April 13.
This position is called a death cross and is a bearish trend. It occurs when the longer EMA crosses above the shorter EMA. The opposite is the golden cross that occurs when the shorter EMA crosses above the longer EMA.
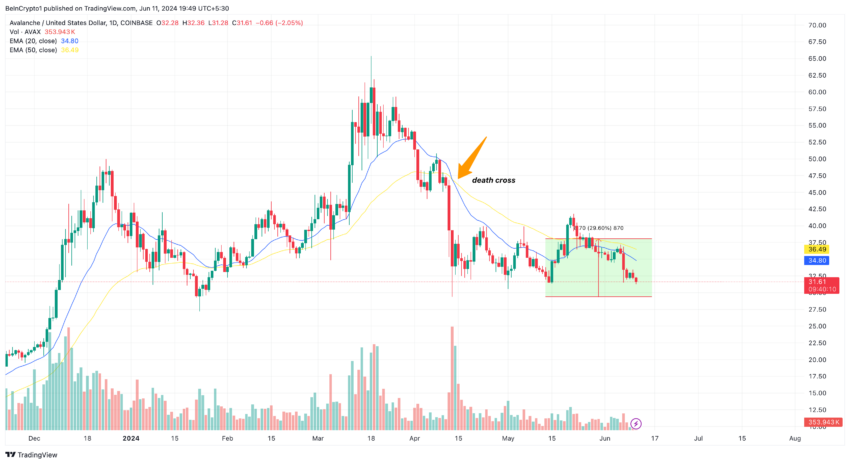
This position puts AVAX at risk of a decline to $29.38. Further, the Directional Movement Index (DMI) supports the potential price decrease.
The chart below shows that the -DMI (red) was 27.58, while the +DMI (blue) was 11.85. DMI measures both strength and direction. Therefore, the difference between the +/-DMI suggests a downward direction for AVAX.
Also, the Average Directional Index (ADX) trends upward. The ADX (yellow) shows the strength of the direction. If the ADX spikes, it means that the direction has strength behind the movement.
However, a low DMI reading means that the directional strength is weak. In AVAX’s case, it was the former.
Read More: How to Buy Avalanche (AVAX) with a Credit Card: A Step-by-Step Guide
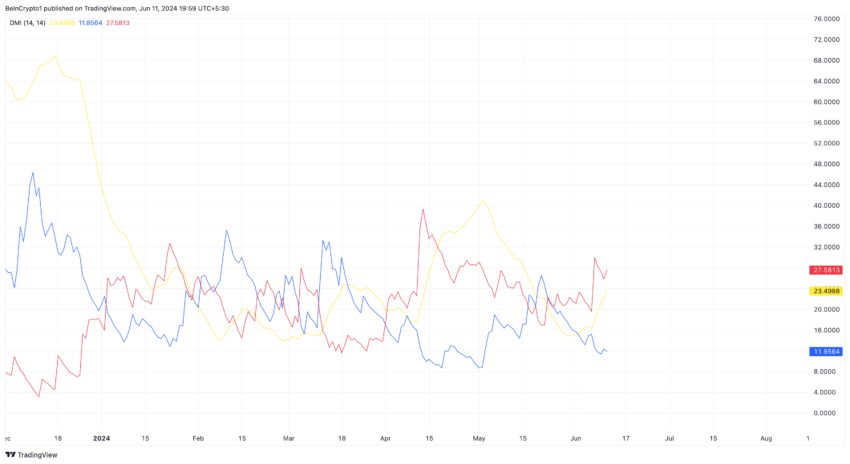
Therefore, the price may drop below $30 in the short term. However, the prediction may be null and void if the broader market begins to recover, as AVAX may follow the directions of other altcoins.
Disclaimer
In line with the Trust Project guidelines, this price analysis article is for informational purposes only and should not be considered financial or investment advice. BeInCrypto is committed to accurate, unbiased reporting, but market conditions are subject to change without notice. Always conduct your own research and consult with a professional before making any financial decisions. Please note that our Terms and Conditions, Privacy Policy, and Disclaimers have been updated.
Market
NFT Market Falls 12% in March as Ethereum Sales Drop 59%

According to the latest Binance research, the NFT market saw a sharp drop in March 2025. Total sales volume across the top 10 blockchains fell by 12.4%, signaling weaker buyer interest. Only two chains—Immutable and Panini—bucked the trend.
The number of unique NFT buyers dropped to its lowest level since October 2023, pointing to a slowdown caused by global economic pressures.
Are NFTs Dying Out in 2025?
Ethereum-based NFTs suffered the most. Sales on the network dropped 59.3%, with only CryptoPunks recording any growth among the top 20 collections. Bored Ape Yacht Club and Pudgy Penguins both posted losses of more than 50%.
Panini saw a strong surge in activity. Its digital collectibles jumped 259.2% in sales, placing it among the top 10 NFT blockchains.
With a long legacy in physical collectibles, Panini’s digital offering uses blockchain to validate asset ownership.

Despite the broader slowdown, brands and creators continue to explore new NFT concepts. Azuki collaborated with artist Michael Lau to launch a physical-backed NFT.
The Sandbox teamed up with Jurassic World to bring licensed dinosaurs into its metaverse experience.
Still, market contraction has led to several closures. Bybit announced it is shutting down its NFT Marketplace, Inscription Marketplace, and IDO platform.
X2Y2 is also winding down after handling $5.6 billion in trading volume. Activity has dropped by 90% since NFTs peaked in 2021, pushing many platforms out of the market.
“Marketplaces live or die by network effects. We fought tooth and nail to be #1, but after three years, it’s clear it’s time to move on. The NFT chapter taught us a lot—most of all, that lasting value beats chasing trends. That lesson’s why we’re drawing a line here, not a pause or a maybe, but a full stop on X2Y2 as we knew it,” X2Y2 wrote in its announcement.
Also, Kraken ended its NFT operations in February, shifting focus to other business areas.
Meanwhile, NFT-related tokens continue to fall. Magic Eden has lost 94% of its value since its launch four months ago. Pudgy Penguins (PENGU) has declined nearly 30% over the past month, despite its Coinbase listing.
Ethereum’s revenue has also taken a hit. Transaction fee income has dropped by 95% since late 2021, driven by falling NFT activity and fewer contributions from Layer 2 networks.
This has been reflected in Ethereum’s price, as the altcoin declined by 58.8% from its all-time high. Q1 2025 marked its worst quarter since 2018.
Disclaimer
In adherence to the Trust Project guidelines, BeInCrypto is committed to unbiased, transparent reporting. This news article aims to provide accurate, timely information. However, readers are advised to verify facts independently and consult with a professional before making any decisions based on this content. Please note that our Terms and Conditions, Privacy Policy, and Disclaimers have been updated.
Market
Solana Price Falls 19%; Losses Push Investors To Sell And Exit

Solana has faced significant price corrections recently, erasing gains made in mid-March. The altcoin is currently trading at $116, reflecting a 19% loss over the past ten days.
As the price continues to struggle, many investors are losing patience, pushing them to sell their holdings and exit the market.
Solana Losses Mount
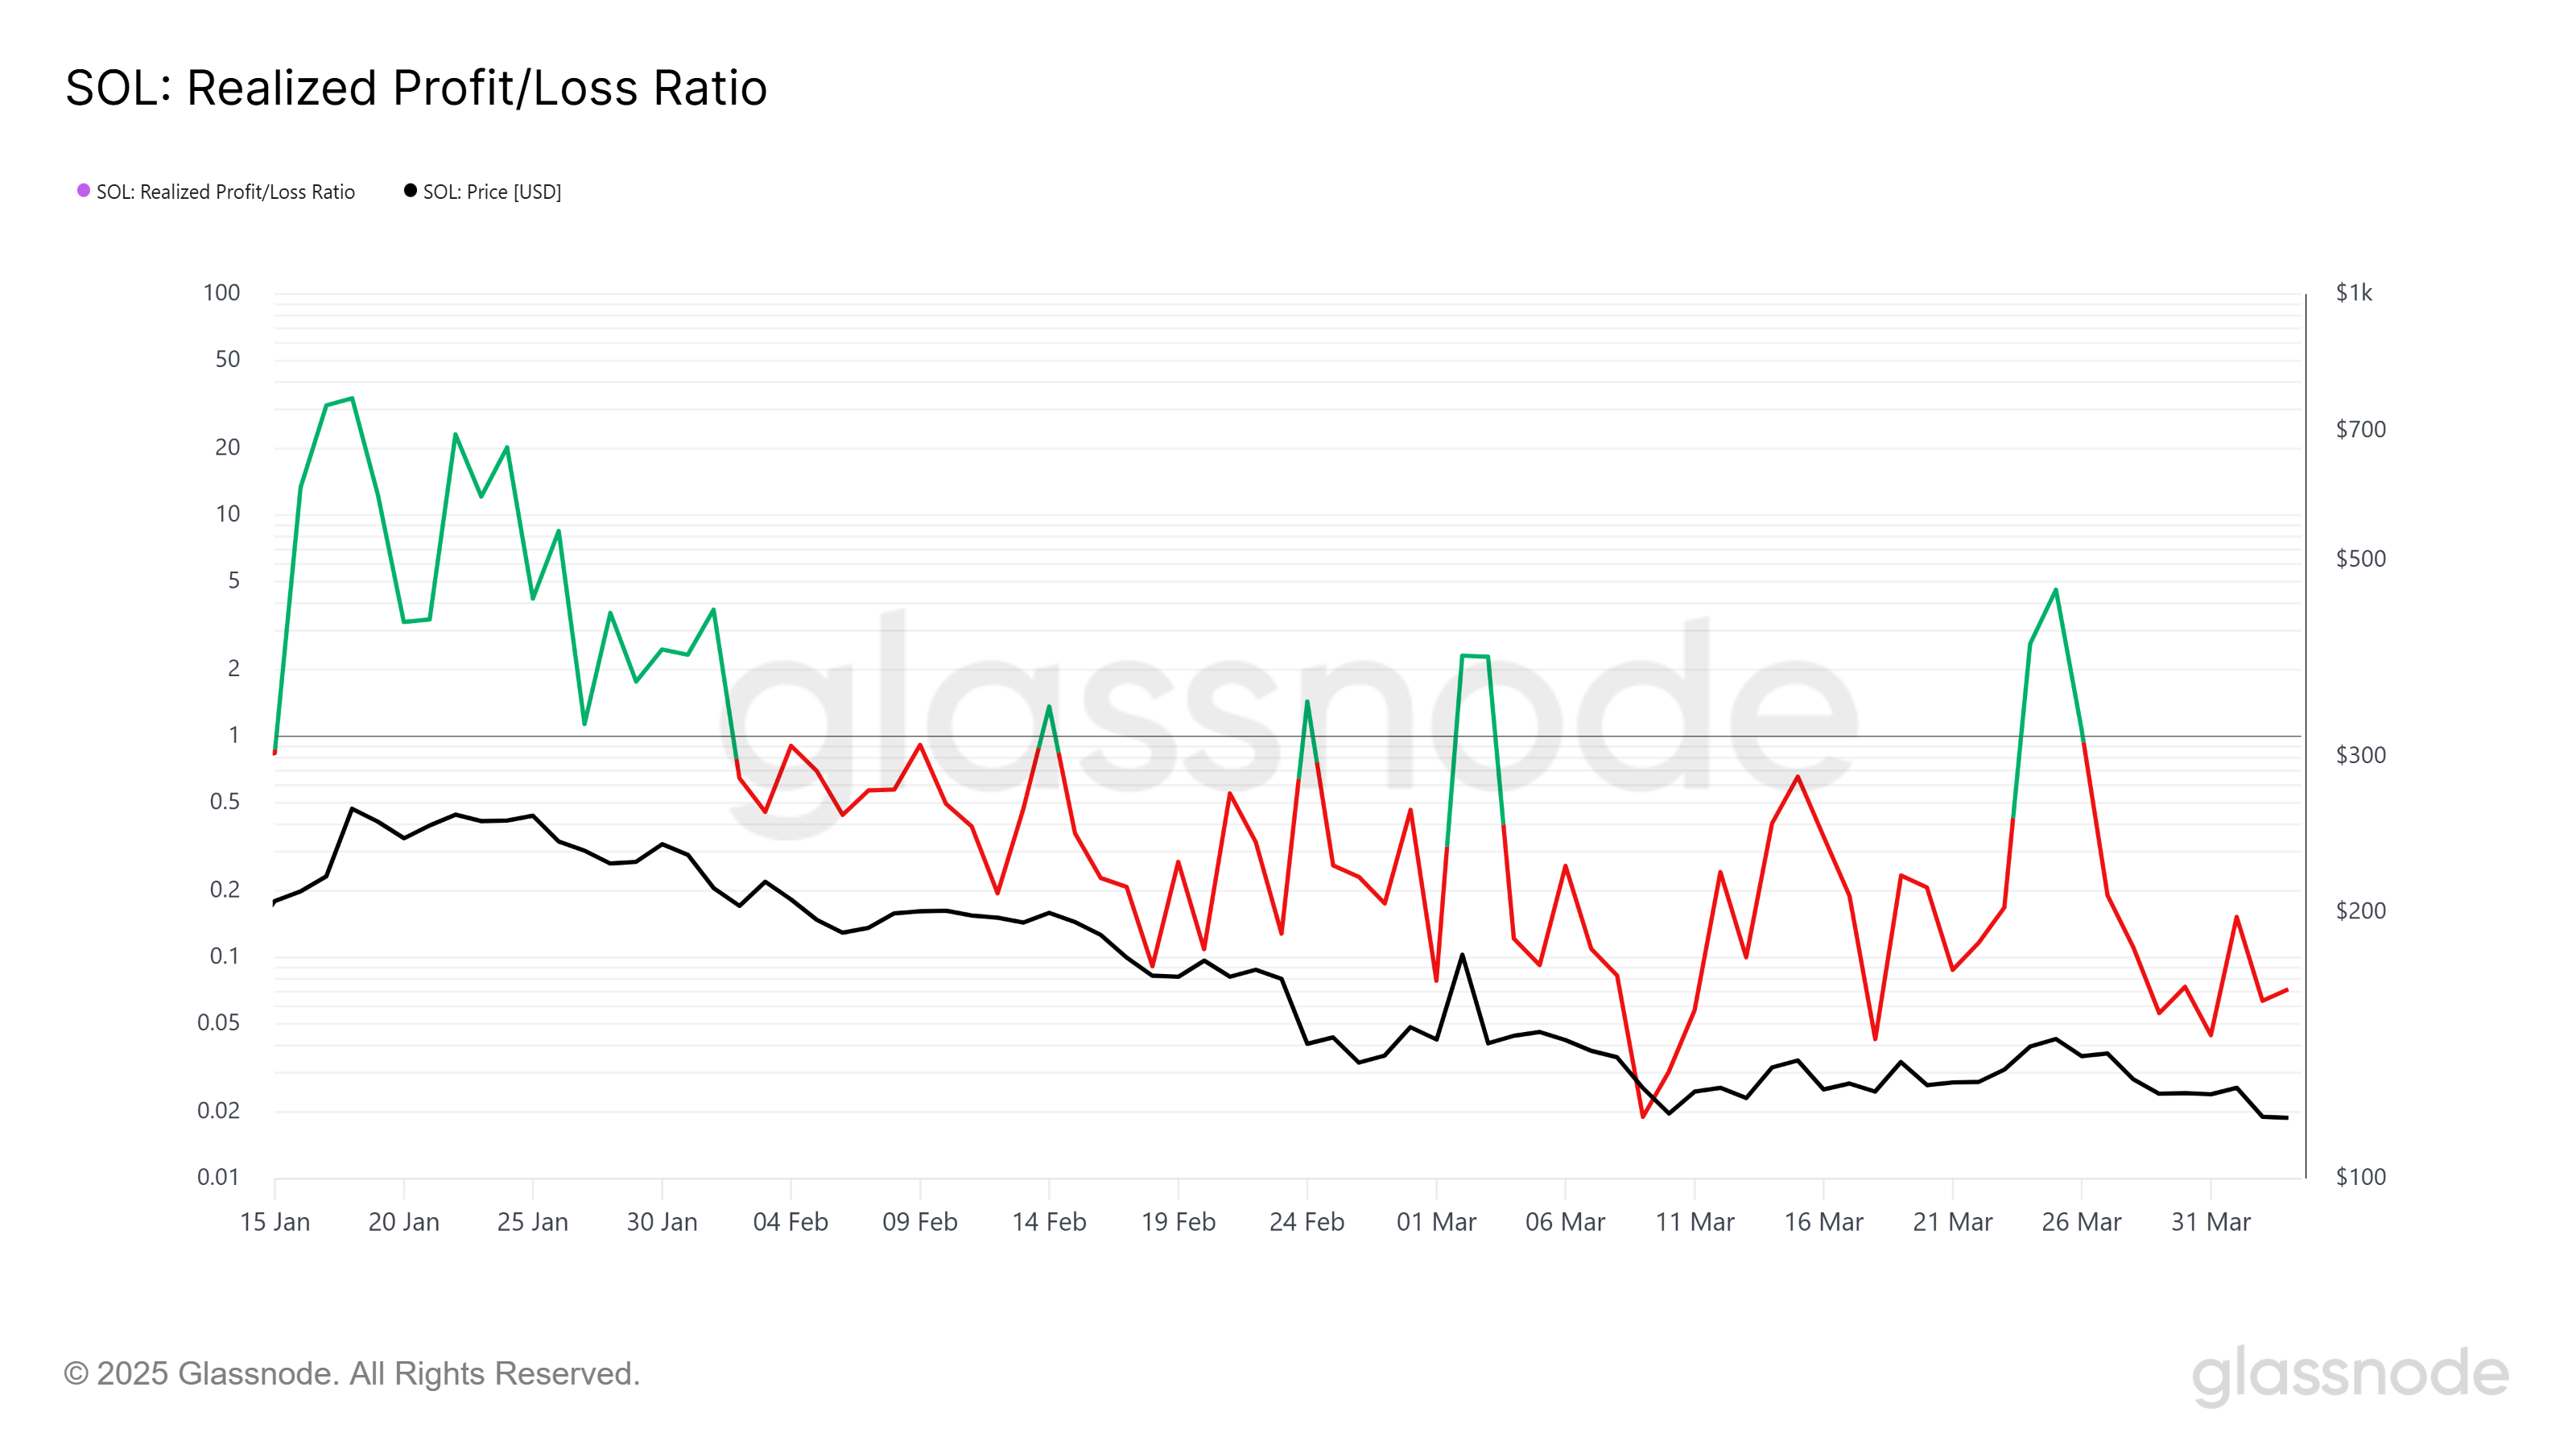
The Realized Profit/Loss (RPL) indicator shows that Solana has been underperforming for most of February and March. While there were brief moments of profit for short-term holders (STHs), the overall trend has been bearish.
These losses have contributed to mounting frustration among investors, leading many to consider selling their positions. The selling pressure is keeping the market from recovering as more and more investors choose to cut their losses.
As a result, investor sentiment has weakened, with many unwilling to hold onto their positions in the face of continued price declines. The Realized Profit/Loss data indicates that, in addition to the selling pressure from STHs, the broader market is also showing signs of caution.
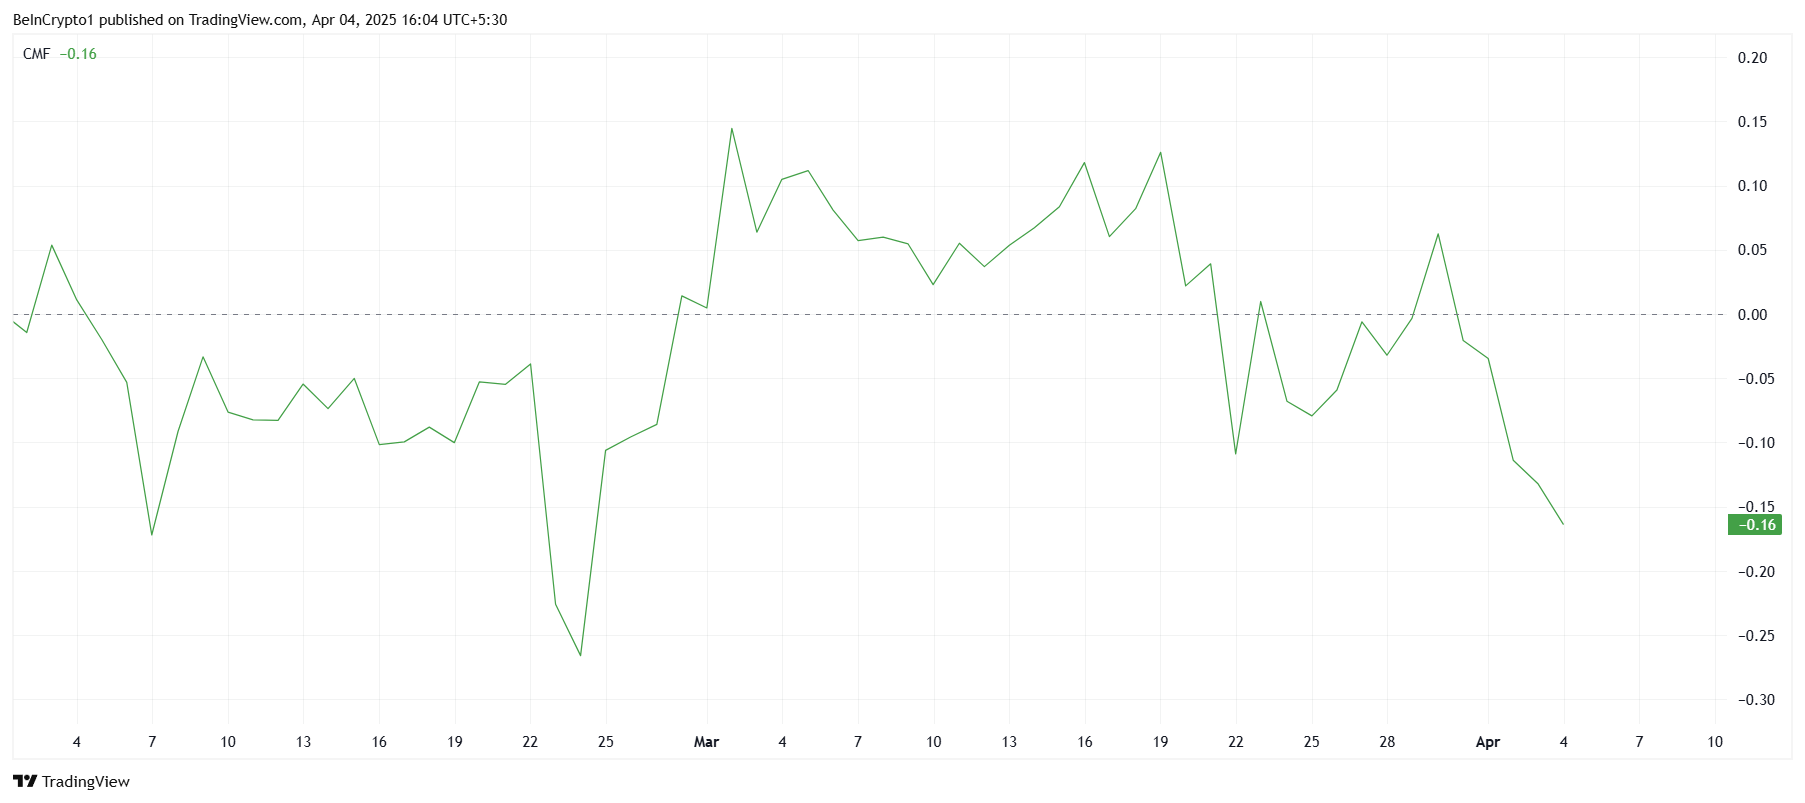
The Chaikin Money Flow (CMF) indicator also shows a concerning trend for Solana. Currently, at a monthly low, the CMF reflects that outflows are exceeding inflows, indicating that investors are pulling their money out of Solana. This lack of buying pressure is detrimental to the altcoin’s recovery prospects, as the outflows signal reduced confidence in the asset.
With the CMF in negative territory, Solana’s ability to rally appears limited, as the overall market sentiment remains subdued. The lack of investor conviction is further exacerbating the downward momentum.
SOL Price Could Witness Further Decline
At the time of writing, Solana’s price is at $116, and it is struggling to recover from the recent losses. Despite the slight uptick observed in the past 24 hours, the altcoin’s recovery remains uncertain. With investor confidence at a low, the price may continue to struggle in the short term.
The aforementioned factors suggest that Solana could dip further to $109, extending investors’ losses. If the bearish trend continues, SOL could test this support level before any potential signs of recovery emerge. This price action would keep investors on edge and delay any sustained rally.

However, if Solana can reclaim $118 as a support floor, it could spark a reversal. A breach of this level would push the altcoin toward $123, and flipping it into support would significantly bolster the bullish thesis. In this scenario, Solana could break through resistance levels and rise toward $135.
Disclaimer
In line with the Trust Project guidelines, this price analysis article is for informational purposes only and should not be considered financial or investment advice. BeInCrypto is committed to accurate, unbiased reporting, but market conditions are subject to change without notice. Always conduct your own research and consult with a professional before making any financial decisions. Please note that our Terms and Conditions, Privacy Policy, and Disclaimers have been updated.
Market
Why Analysts Believe Q2 is a Great Opportunity to Buy Altcoins

As Bitcoin (BTC) continues to dominate with increasing market share, many analysts believe Q2 of 2025 will be the ideal time to accumulate altcoins.
The altcoin market capitalization has dropped 40% from its all-time high (ATH), falling below $1 trillion. Many altcoin investors are facing losses. However, analysts believe this could be the setup phase for an upcoming altcoin season.
Will Q2 See an Altcoin Season?
Joao Wedson, an analyst from Alphractal, pointed out that many altcoins have performed poorly in the current market cycle (2022–2025).
In a post on X, Wedson emphasized that several altcoins have returned to their launch prices. Some of these were once hyped as “rockets to the moon.” This indicates a period of accumulation, making it a good time to place buy orders at low prices.

“Since December 2024, we’ve been in a bear market (actually, the sentiment was already bearish since October). But I still believe that between April and May, the market will heat up for cryptos—even if BTC drops further, as we still have lower targets.” — Joao Wedson, founder of Alphractal, predicted.
Wedson advises investors to focus on altcoin projects with strong fundamentals and growth potential. He suggests avoiding coins that will be surging in 2024, such as ETH, SOL, and TRX. His strategy is patiently waiting and buying at low prices—a cautious yet promising approach.
Meanwhile, another well-known analyst, Ash Crypto, predicts that once Bitcoin’s dominance reaches 70%, it will signal Bitcoin’s peak. Historically, this level has marked the start of an altcoin season within the following months.
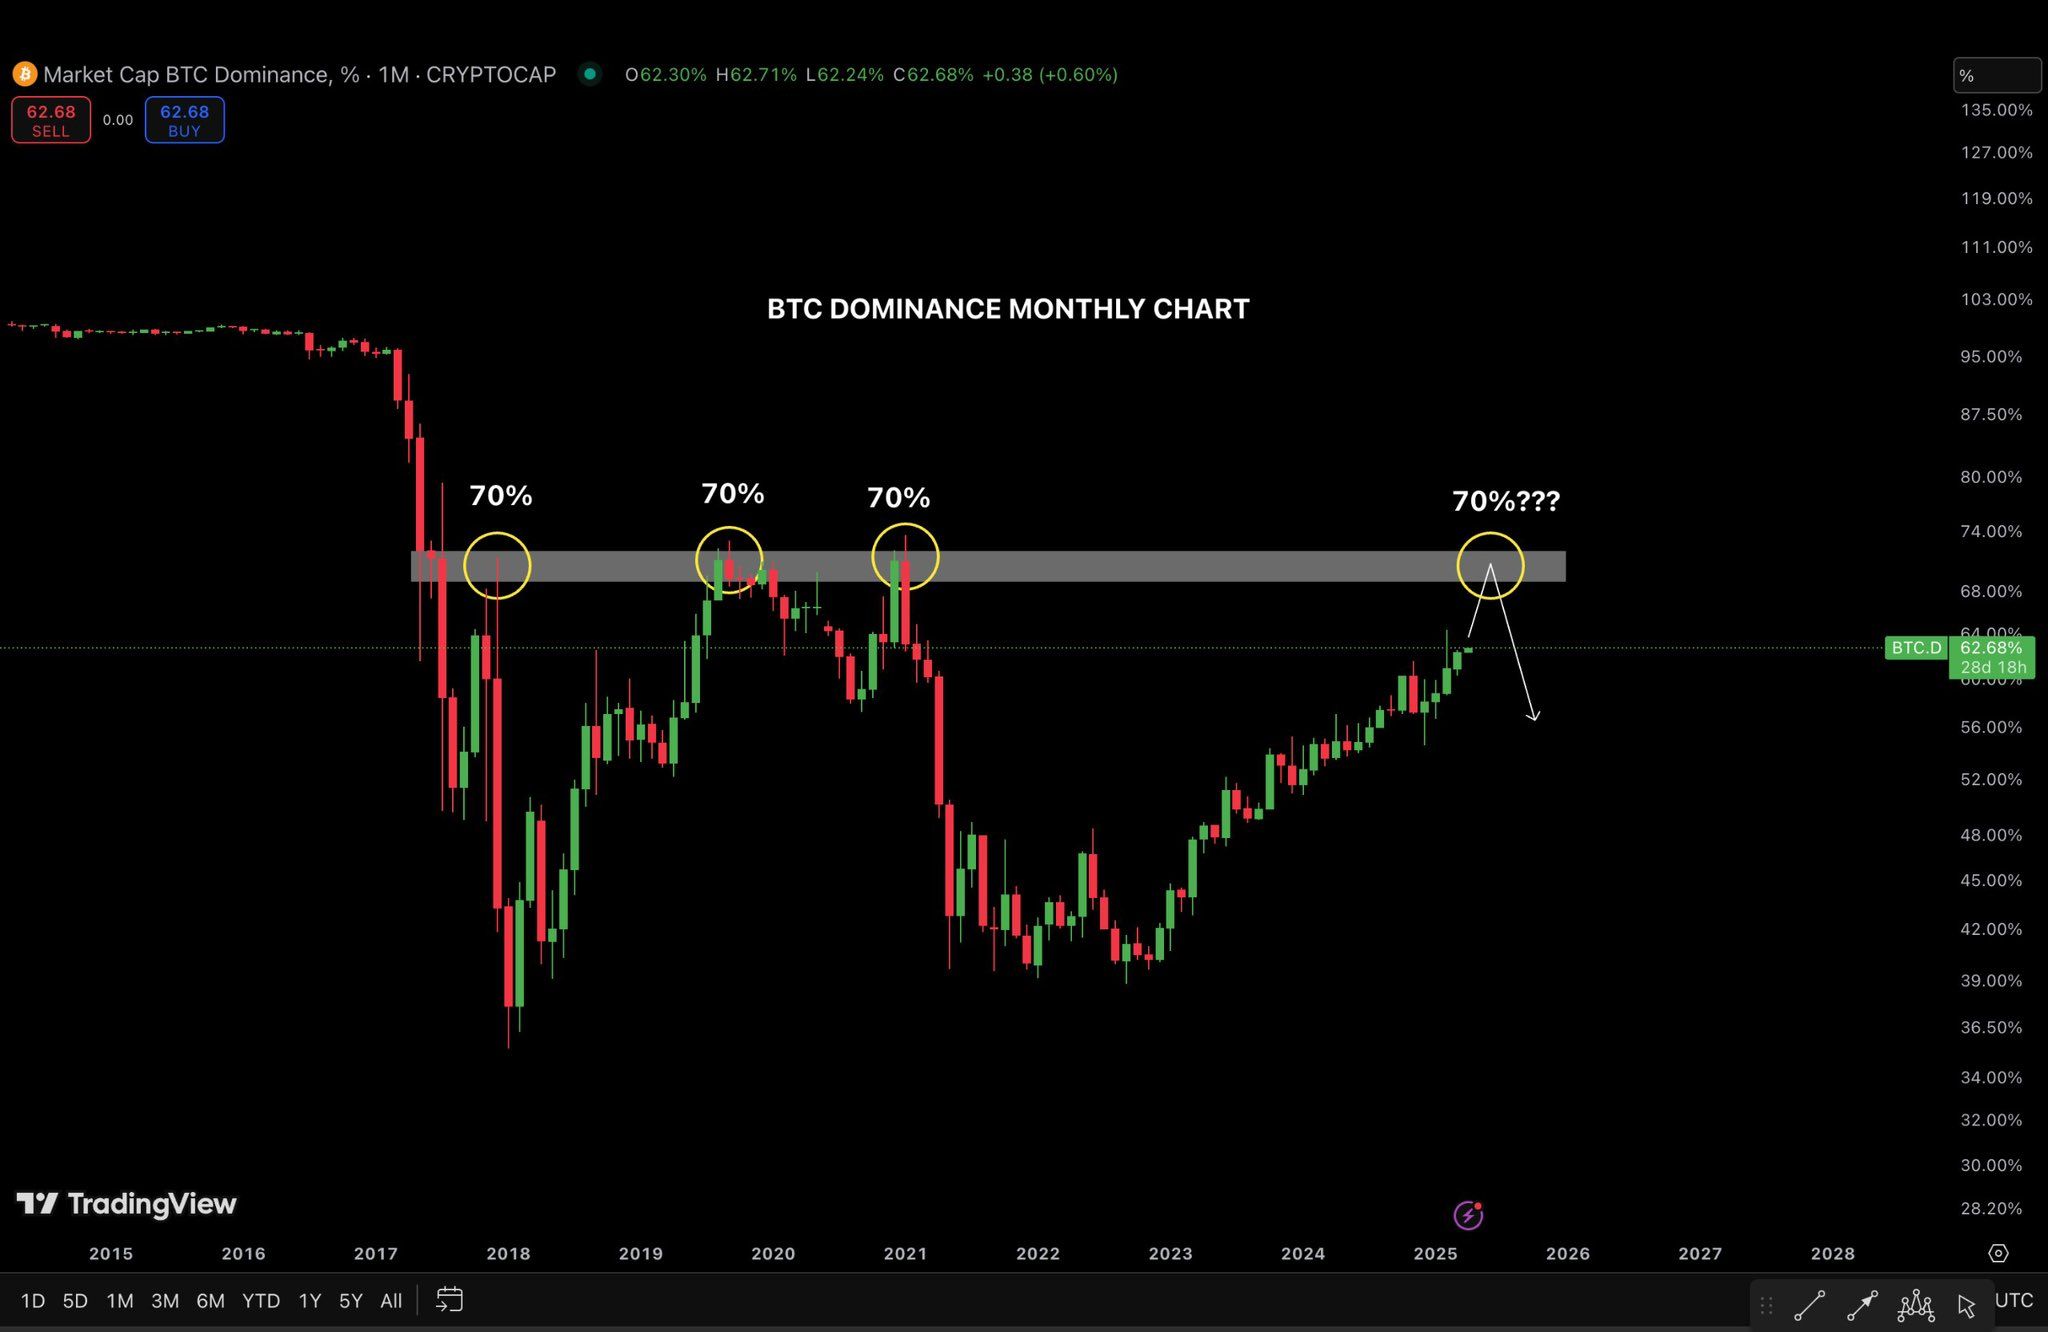
Bitcoin Dominance (BTC.D) represents Bitcoin’s market capitalization relative to the total crypto market cap. When BTC.D declines, it signals that capital flows into altcoins instead of Bitcoin.
Currently, BTC.D remains above 60% with no signs of weakening. Ash Crypto’s forecast strengthens the belief that Q2 and Q3 of 2025 could begin a significant altcoin rally.
Additionally, experienced trader Merlijn agrees with this outlook. In a recent post on X, he predicted that an altcoin season similar to 2021 is approaching. He highlighted that the next three to six months will be crucial for investors to shape their portfolios.
“Altcoin season is setting up—just like in 2021… The next 3–6 months could define your portfolio.” — Merlijn The Trader predicted.
However, a recent analysis from BeInCrypto reported that the Crypto Fear & Greed Index has dropped to 25 points, indicating “Extreme Fear.” Concerns over escalating trade wars are intensifying investor anxiety.
Some analysts, such as Coin Bureau founder Nic Puckrin, believe that Bitcoin is far from a bear market, but the future of several altcoins is questionable.
Disclaimer
In adherence to the Trust Project guidelines, BeInCrypto is committed to unbiased, transparent reporting. This news article aims to provide accurate, timely information. However, readers are advised to verify facts independently and consult with a professional before making any decisions based on this content. Please note that our Terms and Conditions, Privacy Policy, and Disclaimers have been updated.
-

 Ethereum22 hours ago
Ethereum Faces ‘Hyperinflation Hellscape’—Analyst Reveals Key On-Chain Insights
-

 Market22 hours ago
What to Expect After March’s Struggles
-

 Market21 hours ago
Bitcoin Price Still In Trouble—Why Recovery Remains Elusive
-

 Market20 hours ago
Ethereum Price Losing Ground—Is a Drop to $1,550 Inevitable?
-

 Market18 hours ago
Bitcoin & Ethereum Options Expiry: Can Prices Stay Stable?
-

 Bitcoin11 hours ago
Bitcoin Drops as China Escalates Trade War With 34% Tariff on US
-

 Bitcoin16 hours ago
Why Are Retail Investors Turning to XRP Over Bitcoin?
-

 Altcoin23 hours ago
Cardano Price Can Clinch $1 As It Eyes Bounce From New Support Zone


